
 ?Mathematical formulae have been encoded as MathML and are displayed in this HTML version using MathJax in order to improve their display. Uncheck the box to turn MathJax off. This feature requires Javascript. Click on a formula to zoom.
ABSTRACT
A new algorithm is proposed for the determination of aerosol particle size distribution from a set of screen diffusion battery penetrations. The idea is to determine the size spectra of the fractions of particles separated by the sections of diffusion battery, so the total size distribution is the sum of the spectra of fractions. The spectrum of each fraction is approximated by the lognormal function, which is defined by two parameters: the standard geometric deviation (SGD) and geometric mean diameter. The SGD value is chosen to be 1.35 for each fraction. The geometric mean diameters of fractions are calculated from the diffusion battery penetrations. For this purpose, analytical formulas are derived to link the mean single-fiber collection efficiency for each fraction with the experimentally measured penetrations. Then the mean diameters of fractions are calculated from the collection efficiencies using the fan model filtration theory. To achieve a better size resolution, numerical approach is proposed to calculate the particle size spectrum using the analytical solution as an initial approximation. The validity of the analytical and numerical solutions is investigated by comparing them with the spectra determined by means of transmission electron microscopy and gravity settling. For this purpose, the aerosol is generated using the evaporation-nucleation technique, Collison-type nebulizer, and hot-wire bulb generator. It is found that the analytical solution demonstrates a good sizing accuracy but relatively poor size resolution, while the numerical approach results in both good sizing accuracy and good size resolution for the two-mode aerosol.
Copyright © 2018 American Association for Aerosol Research
EDITOR:
1. Introduction
The need to measure aerosol spectra has grown during the last few decades in various fields of science and technology. The most important areas for the application of aerosol techniques include the ambient air quality studies (Harrison Citation1986; Manzoor and Kulshrestha Citation2015; Fuzzi et al. Citation2015; Sabbagh-Kupelwieser et al. Citation2010), nanoaerosol medicine (Sanders Citation2011; Carvalho et al. Citation2015), nanotechnology (Biskos et al. Citation2008), occupational health (Volkwein et al. Citation2011; Vosburgh et al. Citation2013; Gorbunov et al. Citation2009) and others.
The aerosol measurement techniques can be roughly divided into two types. The first-type techniques rely on particle sampling with subsequent laboratory analysis; the most popular methods include optical, atomic force, electron microscopy (Amaral et al. Citation2015; Hinds Citation1999; Last et al. Citation2010), impactors (Amaral et al. Citation2015; Mitchell and Nagel Citation2003; Kang et al. Citation2012). The methods of the second type give the short-time (in situ) analysis. Commonly used techniques of this type include light scattering, aerodynamic particle sizers, electrical mobility methods, diffusional separation techniques, and others (Sorensen et al. Citation2011; Baron et al. Citation2011; Flagan Citation2011; Cheng Citation2011; McMurry Citation2000).
Among the short-time measurement techniques, the differential mobility analyzer (DMA) is widely applied to measure the size spectra of particles larger than 10 nm (Intra and Tippayawong Citation2008). The main disadvantages of this method are its high cost and the requirement for charged particles. Another well-established method to measure the nanoparticle size distribution is the diffusion battery (Knutson Citation1999), which is free from the above-mentioned disadvantages. Diffusion batteries are simple and well suited for use in the open air (Dubtsov et al. Citation2017), to measure the occupational exposure (Vosburgh et al. Citation2013; Gorbunov et al. Citation2009), and for laboratory measurements (Onischuk et al. Citation2012; Onischuk et al. Citation2016a,Citationb).
The diffusion battery technique uses the particle size-dependent deposition rate to convert it to the particle diameter D. Most often the diffusion batteries are organized as a series of fine capillaries or wire grids (screens). As the aerosol moves through the battery, the particles are deposited on the inner surface of capillaries or on the surface of wire screens. After the formulation of Cheng – Yeh theory (Cheng and Yeh Citation1980; Cheng et al. Citation1985), the screen-type batteries became most popular. A battery of this type is versatile, compact in size, simple in construction, and can be easily cleaned if contaminated. It usually consists of the series of sections filled by parallel screens. Most often the diffusion batteries are constructed in such a way that the number of screens increases progressively with the section number. The experimental data are collected as the aerosol number concentration measured downstream of each section. That set of concentrations can be processed to retrieve the size distribution. However, the diffusion battery responses are not sharp. In other words, the size ranges of particles collected in different sections overlap, resulting in some degree of indeterminacy. Thus, a large number of equally valid size distribution functions can satisfy the same set of aerosol concentrations. However, if properly treated, the diffusion battery measurements can result in the particle size spectrum close to the real one. To recover the size distribution, one should employ a procedure called inversion. The central idea of inversion is the deduction of the particle size distribution function f(D) from penetrations gi:[1]
[1] where Ci and C0 are the particle number concentrations measured downstream of the i-th section and at the inlet of diffusion battery, respectively, i is the number of section (i = 1, 2, 3,…). Below we consider f(D) normalized to unity. The aerosol size distribution function is related to the experimentally measured penetrations by the Fredholm integral equations of the first kind, which are expressed in an ideal case in the form
[2]
[2] where Ki(D) are kernel functions for the diffusion battery, a and b are the limits of size interval. However, there are errors associated with the measurements of penetrations and, therefore, Equation (Equation2
[2]
[2] ) are satisfied only within an experimental accuracy, i.e.:
[3]
[3] where ϵi are the experimental errors. Equation (Equation3
[3]
[3] ) form so-called ill-posed inversion problem, which cannot be solved without some auxiliary information. The ill-posedness means that Equation (Equation3
[3]
[3] ) does not satisfy at least one of the following conditions:
| 1) | There is a solution f(D) for every set gi; | ||||
| 2) | The solution f(D) is unique; | ||||
| 3) | The solution f(D) is stable, i.e., for any perturbation ϵi tending to zero the corresponding perturbation in f(D) also tends to zero. | ||||
Indeed, an infinite number of functions that oscillate rapidly enough can be added to f(D) without affecting the validity of Equation (Equation3[3]
[3] ), i.e., the condition 2) is violated. Besides, the solution f(D) is highly sensitive to ϵi and the condition 3) is also violated.
To solve the inverse problem formulated as Equation (Equation3[3]
[3] ), different methods were elaborated, which can be roughly divided into two categories: graphical/analytical approaches, and numerical solutions. Pollak and Metnieks (Citation1957) elaborated a graphical exhaustion method, which makes it possible to resolve a multimodal aerosol into its constituents and estimate the modal diameters from the dependence of the apparent diffusion coefficient on the aerosol flow rate through the diffusion battery. Unfortunately, this approach is rather laborious and can be applied only to an aerosol consisting of a few monodisperse components. Fuchs et al. (Citation1962) proposed a graphical reverse method. The idea was to plot the calculated penetrations for lognormal distributions with different standard geometric deviations as the functions of flow rates through a parallel-walled channel. Comparing the experimentally measured penetrations with these curves one can evaluate the mean size and width of distribution function. The method proposed by Fuchs et al. (Citation1962) is less laborious than that of Pollak and Metnieks (Citation1957) but applicable only to a single-mode spectrum. Sansone and Weyel (Citation1971) and Kravchenko et al. (Citation1971) applied the method of Fuchs et al. (Citation1962) to the circular tubes, and Lee et al. (Citation1981) extended this approach to the screen-type diffusion battery. Mercer and Greene (Citation1974) simplified the graphical method of Fuchs et al. (Citation1962) by consolidating the numerous families of theoretical penetration curves into a single family. Nolan and Scott (Citation1963/1964) derived simple formulas to retrieve the dispersion for the size distribution function from the dependence of the apparent diffusion coefficient on the rate of aerosol flow through the diffusion battery. As the formulas were obtained by the Taylor expansion of the penetration function, they can only be applied to the single-mode size distributions in a narrow range of dispersions. Sinclair et al. (Citation1979) elaborated a graphical stripping method, which consists of subtracting the calibration penetration curves for monodisperse aerosols from the experimental curve for a polydisperse aerosol. The advantage of the stripping method is that a size distribution can be obtained without any assumption about its form. Lushnikov with co-authors (Lushnlkov and Zagaynov, Citation1990; and Zagaynov et al., Citation2006) have approximated the spectrum by the gamma-distribution. To evaluate the Laplace-type kernel, the saddle point method was used. This approach simplifies the inversion procedure, but it can be applied only to single-mode spectra.
For numerical computation, the particle size distribution function is most often represented in the finite-dimensional form. A variety of numerical methods had been published to solve the inverse problem Equation (Equation3[3]
[3] ). These methods include linear and nonlinear iterative techniques (Twomey Citation1975; Reineking and Porstendörfer Citation1986; Ferri et al. Citation1995), Tihonov's regularization procedure (Bashurova et al. Citation1992; Wang and Yangm Citation2008), least square methods (Voutilainen et al. Citation2001; Fierz et al. Citation2008), expectation-maximization algorithm (Maher and Laird Citation1985), matrix factorization methods (Paatero et al. Citation1991), the maximum entropy method (Yee Citation1989; Eremenko and Ankilov Citation1995; Gulak et al. Citation2010), the lognormal simplex method (Reineking and Porstendörfer Citation1986), extreme value estimation method (Aalto et al Citation1990) and others. The major drawbacks of numerical methods are the non-unicity of the solution and mathematically complex procedure to find the best solution out of the infinite group of size distributions giving penetrations that coincide within the experimental uncertainty with the measured ones.
In this work we propose a new method to determine the size distribution function of aerosol particles from the experimentally measured penetrations. The idea is to determine the size spectra of the fractions of particles separated by different sections of a diffusion battery. The total particle size distribution function is the sum of the spectra of fractions. The approach elaborated in this paper gives a one-to-one correspondence between the diffusion battery penetrations and the spectra of fractions using simple analytical formulas. To demonstrate the validity of this approach, the size spectra of aerosol generated by laboratory equipment are measured both with diffusion battery and by other physical methods including transmission electron microscopy and gravity settling method.
2. Materials and methods
2.1. Methods for aerosol generation and characterization
To measure the nanoaerosol number concentration, a Condensation Nucleus Counter (CPC) is used in pair with the diffusion battery (Ankilov et al. Citation1991; Dubtsov et al. Citation2017) (see the online supplementary information [SI], Figure S1). The particle size spectrum and mean diameter as determined by the diffusion battery are compared with those measured using other methods. The size spectrum and shape of aerosol particles for the diameter range 3 – 500 nm are studied using a JEM 100SX transmission electron microscope (TEM). To compare the spectra from the diffusion battery with the results of direct physical measurements for the range of particle diameters 500 – 1000 nm, a gravity settling system is used. The particle settling velocity is measured using an imaging system furnished by a CCD camera. The equivalent particle diameter is determined from the settling velocity using the drag force equation (see SI for more details).
The aerosol to measure the size distribution with a diffusion battery was generated using the following equipment. Within the diameter range 5 – 20 nm, the bulb-type hot-wire aerosol generator was used (Figure S2). In this device, the aerosol is formed by the indirect heating of a tungsten filament from an incandescent light bulb by a Ni-Cr heater. The number concentration of particles generated by the hot wire technique is within the range 104 – 107 cm−3. For the diameter range 5 – 500 nm, the evaporation – nucleation route (physical condensation) (Fuks and Sutugin Citation1968, Citation1971) was used (Figure S3) to generate the aerosol of Ag, NaCl or CsCl. The particle number concentration for the evaporation-nucleation technique was in the range 104 – 107 cm−3. To generate NaCl aerosol in the range of mean diameters 100 – 500 nm, the Collison-type nebulizer was also used. This device generates the liquid NaCl/water solution particles that are transformed to solid NaCl particles due to immediate water evaporation. The particle number concentration for the Collison-type nebulizer was varied within the range 104 – 105 cm−3. To generate submicron particles, a heterogeneous nucleation system was used (Figure S4). It consists of a saturator, hot-wire generator of seeding particles, and dibutyl phthalate condensation chamber. The system of this type generated aerosol with the mean particle diameter 500 – 1000 nm and the number concentration within the range 103 – 105 cm−3 (see SI for more details).
2.2. Diffusion battery design and particle to screen deposition equations
After the publication of Cheng-Yeh's theory of screen-type diffusion battery (Cheng and Yeh Citation1980; Cheng et al. Citation1980,Citation1985), the interest of aerosol scientists has turned to wire screens as particle collecting elements. The discovery made by Cheng and Yeh was in finding that the penetration efficiency for a stack of screens can be calculated using the fan model filtration theory (Kirsch et al. Citation1969, Citation1975; Stechkina et al. Citation1969; Kirsch and Stechkina Citation1977; Cheng et al. Citation1980; Kirsch and Chechuev Citation1985, Kirsh et al. Citation2010).
The diffusion battery used in this work consists of nine consecutive sections. The fluid flow cross-section diameter is 50 cm. The volumetric flow rate through the sections of the diffusion battery is 1.0 L/min, which corresponds to the linear flow velocity U0 = 0.85 cm/s. Each section is filled with a stack of woven nylon screens composed of the fibers of uniform diameter 5 × 10⁻³ cm; the solid volume fraction is α = 0.231 and the thickness of screen h = 1.13 × 10⁻² cm. The number of screens is 2, 2, 4, 8, 16, 32, 64, 128, 256 for the section numbers 1, 2, …, 9, respectively. Thus, the screens are distributed in sections in such a way that the number of screens in each section (except for the first one) is equal to the total number of screens upstream. This design of screen distribution gives some advantage in analytical inversion with respect to other designs, which will be discussed in more detail in Section 3.2. The particle number concentrations C0, C1, C2, …, C9 are measured at the inlet of diffusion battery and after sections 1, 2, …, i, respectively. To this end the diffusion battery is furnished by ten three-way automatic valves, one of them upstream, another downstream of diffusion battery and other eight distributed between sections. These valves switch the aerosol flow to aerosol spectrometer to measure the concentration consequently, starting from C9 and finishing with C0. The concentration Ci measured after the i – th section is governed by the total number N1,i = n1+n2+…+ni of screens upstream, where n1, …, ni are the numbers of screens in sections 1, …, i, respectively. For the monodisperse particles of diameter D, penetration through a cascade of sections 1, 2, …, i is (Cheng and Yeh Citation1980; Cheng et al. Citation1980,Citation1985; Kirsch et al. Citation1969; Stechkina et al. Citation1969; Kirsch and Stechkina Citation1977; Kirsch and Chechuev Citation1985; Kirsh et al. Citation2010)[4]
[4] where μ is the single-fiber collection efficiency,
, α is the solid volume fraction of a screen (the ratio of the volume of solid to the total volume of a screen), r is the radius of fibers, h is the thickness of a screen. For the particles within diameter range 1 – 1000 nm, two main mechanisms are responsible for particle collection by screens: diffusion and interception. Inertial impaction plays a relatively small role with respect to the other two mechanisms. Nevertheless, the contribution from all the tree mechanisms can be taken into account in accordance with the fan model filtration theory resulting in the single-fiber collection efficiency:
[5]
[5] where μD, μR, and μI are the single-fiber collection efficiencies for diffusion, interception and inertial impaction, respectively, μDR is the interaction term which takes into account the enhanced collection due to interception for the diffusing particles.
It was determined experimentally (Kirsch et al. Citation1969) that[6]
[6] where
[7]
[7] is Peclet number,
is the particle diffusion coefficient, k is Boltzmann constant, T is absolute temperature, η is the gas dynamic viscosity, which is η = 1.8⋅10−4 poise for air at room temperature, CC is the Cunningham correction factor equal to (Fuchs Citation1964; Reist Citation1993):
[8]
[8] where λ = 65 nm is the gas mean free pass for air, A, Q and b are parameters equal to A = 1.252, Q = 0.399, b = 1.100 (Reist Citation1993).
The interception efficiency can be expressed as[9]
[9] where
,
is the interception parameter. The interaction term and inertial impaction efficiency are governed by the formulas
[10]
[10]
[11]
[11] where
,
is Stokes number, ρ is the particle density (g/cm3).
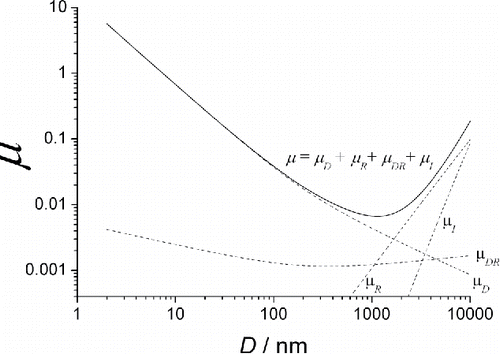
Comparing the experimental particle penetrations through the stacks of screens with those calculated by Equations Equation(4)–(11), Cheng et al. (Citation1980, Citation1985) demonstrated a very good agreement for the particles of diameters ranging from 0.01 to 1 μm. shows the single-fiber collection efficiency μ as a function of particle diameter for the diffusion battery used in this article. The μ vs. D dependence is U− shaped, with the minimum at a diameter of 1100 nm. The useful range of this curve is to the left from the minimum, where the collection efficiency decreases monotonically with an increase in D. Therefore, in our case the formulas Equations Equation(5)–(11) can be used only for particle diameters D < 1100 nm.
Figure 1. Total single-fiber deposition efficiency μ (solid line) and the terms μD, μR, μI and μDR (dash lines) calculated according to Equations Equation(5)–(11) for the screens used in this paper, as functions of particle diameter.
3. Results and discussion
3.1. Inversion problem
To derive analytical formulas for the calculation of particle size distribution, it is necessary to write down Equation (Equation3[3]
[3] ) for errors
in the following way
[12]
[12] where the kernel functions Ki(D) are equal to the penetration efficiency Pi (Equation (Equation4
[4]
[4] )), m is the number of sections of diffusion battery. The linear combination of Equations (Equation12
[12]
[12] ) gives:
[13]
[13] where
and the functions
are governed by the following relationships
[14]
[14]
(the kernels K1, K2, … and differences K1 – K2, K2 – K3, … are given in Figure S8 for comparison). In other words, the quantities h1, h2, …, hm-1 are the fractions of particles which are collected by sections 1, 2, …, m-1, respectively, and hm is the fraction of the rest of the particles which are in the flow downstream of the section m-1. The functions are the size spectra of the fractions of particles collected by sections 1, 2, …, m-1, respectively, and
is the size spectrum of the last fraction. The total size distribution function is
[15]
[15]
Thus, finding the spectra of fractions one can obtain the total size spectrum f(D).
As the aerosol passes through the diffusion battery, the initial sections collect the fractions of particles with the mean diameter smaller than that for the fractions to be collected in the next sections, i.e., the mean diameter of fractions monotonically increases with the section number i. To find the solution f(D) we approximate each function by the lognormal distribution
[16]
[16] where Di is the geometric mean diameter and σ is the standard geometric deviation (SGD) which is set one and the same for all the fractions. It is important to find the proper value of σ to describe correctly the original spectrum by the sum of the spectra of fractions. The functions
cannot be wider than any of the modes of the original spectra; otherwise a multimodal original spectrum will be approximated by a wide single-mode size distribution. On the other hand, if functions
are much narrower than the modes of the original spectrum, then the smooth original size distribution will be approximated by a comb spectrum consisting of a series of discrete narrow peaks.
All the aerosol systems can be conventionally subdivided into monodisperse and polydisperse ones. Particles characterized by SGD of 1.1 to 1.2 are said to be monodisperse. Aerosols that have a wider range in diameter are considered polydisperse (John Citation2011). Monodisperse aerosols are used as test-objects. Special laboratory techniques are used to produce monodisperse test aerosols like nebulization of aqueous suspensions of polystyrene latex, vibrating orifice generator, electrostatic classification and others (Chen et al. Citation2011; Flagan Citation2011).
Most aerosols in ambient environments and workplaces as well as those generated in laboratory processes, have polydisperse size distributions. Thus, atmospheric aerosol size distribution reveals three distinct modes, called the nuclei, accumulation, and coarse modes (Whitby Citation1978). The geometric standard deviations for these three modes are about 1.6-1.7, 1.6 – 2.2 and 2 – 3, respectively (John Citation2011). The indoor aerosol originates from infiltration of atmospheric aerosol, tobacco smoking, cooking. A typical SGD value for this type of aerosol is about 1.6 (John Citation2011). The aerosols generated in laboratory and industrial processes include combustion aerosol (σ ≈ 1.6 – 1.8) (Onischuk et al Citation2000, Citation2003), aerosol from evaporation – nucleation (σ ≈ 1.4 – 1.6) (Onischuk et al Citation2009, Citation2012), from pyrolysis of gaseous precursors (σ ≈ 1.7 – 2.0) (Onischuk et al Citation2000, Citation2001) and others.
The coagulation of any polydisperse aerosol system with a wide initial size distribution results in spectrum narrowing due to predominant collisions of small particles with the large ones. Finally, after a sufficiently long time interval, the size distribution of a coagulating aerosol can approach a lognormal function with a fixed geometric standard deviation, independent of the initial width of size distribution which is called self-preserving size distribution (Friedlander and Wang Citation1966). The value of SGD for the self-preserving spectrum is about σ∞ ≈ 1.35 (Dekkers and Friedlander, Citation2002; Lee et al. Citation1984). This value can be considered as the lower limit for SGD of any real aerosol from natural, industrial or laboratory processes. Moreover, the width of any mode from these aerosols cannot be narrower than that for self-preserving spectrum. Therefore, it is convenient to approximate the spectra of diffusion battery fractions by the log-normal functions with σ = 1.35. This SGD value gives sufficiently narrow spectra of fractions to resolve the modes of polydisperse spectra. On the other hand, this value of σ gives functions
wide enough to avoid excessively oscillating solutions and to make the final solution f(D) rather smooth even for a limited number of diffusion battery sections. Thus, to find the approximate solution f(D) one just needs to determine the mean diameters Di of fractions separated by the sections of the diffusion battery.
To demonstrate the principle of deconvolution of function f(D) into the spectra of fractions, let us consider a model two-mode spectrum as shown in , which is a sum of two lognormal functions[17]
[17] with D1 = 10 nm, D2 = 200 nm and σ1 = σ2 = 1.4. For this model spectrum, we first calculate the size distributions
of fractions using Equations (Equation14
[14]
[14] ) and (Equation4
[4]
[4] )–(Equation11
[11]
[11] ). Then, using the size distributions obtained, we calculate the geometric mean diameters for these fractions. Afterwards, using these mean diameters, we approximate the spectra of fraction by the lognormal function Equation (Equation16
[16]
[16] ) with σ = 1.35. Finally, we calculate the total spectrum as the sum of these lognormal distributions. Comparing the recovered spectrum with the original one, we can understand the weak and strong sides of our approach.
Figure 2. Original two-mode spectrum (a) and spectra recovered analytically as the sum of lognormal functions Equation (Equation18[18]
[18] ) with Di calculated numerically using Equations (Equation14
[14]
[14] ) (b), by formulas Equations (Equation26
[26]
[26] , Equation29
[29]
[29] , Equation32
[32]
[32] ) (c), and by formulas Equations (Equation38
[38]
[38] ) (d). Dash lines are lognormal approximations of two main peaks.
![Figure 2. Original two-mode spectrum (a) and spectra recovered analytically as the sum of lognormal functions Equation (Equation18[18] f*(D)=∑i=1mϕi*(D)[18] ) with Di calculated numerically using Equations (Equation14[14] ϕ1(D)=(1−K1(D))f(D)ϕ2(D)=(K1(D)−K2(D))f(D)…… ……… ……… ……… ……….ϕm−1(D)=(Km−2(D)−Km−1(D))f(D)ϕm(D)=Km−1(D)f(D)[14] ) (b), by formulas Equations (Equation26[26] μϕ1(n1)=−ln(g1−g21−g1)χn1[26] , Equation29[29] μϕi(Ni,i+1)=−ln(gi+1−gi exp(−χμi (Ni,i+1)(ni+ni+1))gi−1−gi)χ(ni+ni+1)[29] , Equation32[32] μϕm(nm)=μm−1(nm)=−ln(gmgm−1)χnm[32] ) (c), and by formulas Equations (Equation38[38] Di/nm=(0.25 β n1ln(1−gigi−gi+1))3/4,(i=1)Di/nm=(0.25 β (ni+ni+1)ln(gi−1−gigi+1−gi exp(−χμi(Ni,i+1)(ni+ni+1))))3/4,(1<i<m)Di/nm=(0.25β niln(gi−1gi))3/4,(i=m)[38] ) (d). Dash lines are lognormal approximations of two main peaks.](/cms/asset/81e9ddb5-07ba-41df-8727-28c2bc689889/uast_a_1387642_f0002_b.gif)
The functions calculated for the model spectrum are shown in . As the original spectrum consists of two peaks at 10 and 200 nm, these two peaks are expected to be observed in the spectra of fractions. Indeed, the peak at 10 nm dominates in size distributions ϕ1 and ϕ2 but the contribution from the other peak at 200 nm is negligible, because the initial sections of the battery collect only small particles with a high diffusion coefficient. On the other hand, the size distributions
contain only the 200 nm mode because the smaller particles were collected in the previous sections of the battery. The function ϕ3 includes both peaks at 10 and 200 nm in comparable intensities, but the contribution of this function to the total size spectrum is rather small because the majority of small particles is already collected by the previous sections, and the collection efficiency for large particles is not high due to the small number of screens in the section 3. It seems to be reasonable to approximate the functions
by the single-mode lognormal distribution
() because most fractions contain only one-mode particles and the bimodal fractions have low relative weights. compares the original function f(D) (spectrum a) and the recovered function (spectrum b) which is the sum of lognormal approximations:
[18]
[18]
Figure 3. Original two-mode spectrum (a), functions (b) calculated for the original spectrum via Equations (Equation14
[14]
[14] ) and (Equation4
[4]
[4] )–(Equation11
[11]
[11] ) as well as the single mode log-normal approximations
(b). The curves in panels b and c are shifted vertically with respect to each other to avoid overlapping.
![Figure 3. Original two-mode spectrum (a), functions ϕ1(D),ϕ2(D),…,ϕ9(D) (b) calculated for the original spectrum via Equations (Equation14[14] ϕ1(D)=(1−K1(D))f(D)ϕ2(D)=(K1(D)−K2(D))f(D)…… ……… ……… ……… ……….ϕm−1(D)=(Km−2(D)−Km−1(D))f(D)ϕm(D)=Km−1(D)f(D)[14] ) and (Equation4[4] Pi(D,N1,i)=CiC0=exp(−χμN1,i)[4] )–(Equation11[11] μI=I⋅St(2κ)2[11] ) as well as the single mode log-normal approximations ϕ1*(D),ϕ2*(D),…,ϕ9*(D) (b). The curves in panels b and c are shifted vertically with respect to each other to avoid overlapping.](/cms/asset/a8848d94-e383-4c90-bfdf-bc3db37f3388/uast_a_1387642_f0003_b.gif)
One can see a good agreement between the original and recovered spectra. The main peaks at 10 and 200 nm from these spectra are in almost ideal concordance. The first recovered peak fits the lognormal function with the geometric mean diameter of 11.4 nm and σ = 1.4, and the second main peak fits the lognormal function with the geometric mean diameter of 200 nm and σ = 1.4 (dash lines in ). However, there is a small peak at about 40 nm in the retrieved spectrum which is the result of the two mode function ϕ3 being approximated by the single mode function . However, the contribution of this peak to the total spectrum is less than 5%.
Thus, the approximation of particle size distribution as a sum of lognormal functions Equation (Equation18[18]
[18] ) can be an easy non-consuming way to retrieve particle size distribution from diffusion battery measurements. The retrieved spectrum is a good reproduction of the structure of the original size distribution, and it gives a correct mean diameter. The calculated spectrum demonstrates the idea of our approach, which is in the reconstruction of the total spectrum from the mean diameters of fractions. To obtain this size distribution, we calculated the mean diameters of fractions numerically for the known model spectrum. However, to recover an a priori unknown size spectrum in the real experiment from the diffusion battery measurements, we should find the algorithm to determine mean diameters Di from the diffusion battery penetrations. The method to calculate the mean particle diameter for the diffusion battery fractions is described in the next section.
3.2. Analytical formulas for the determination of particle size distribution from diffusion battery measurements
In this section and the following one, analytical formulas to recover the particle size distribution will be derived using the diffusion battery experimental concentrations C0, C1, …, Cm as input parameters. It is convenient to introduce the mean single-fiber collection efficiency in a stack of N screens for the particles with size distribution function ϕi. For the particles coming out of the j-th section, we also introduce the mean single-fiber collection efficiency
in a stack of N screens. Thus, for example, the quantity
is the mean single-fiber collection efficiency in the k-th section filled with nk screens for the aerosol which passed through the previous k-1 sections (or for the inlet aerosol in the case of k = 1):
[19]
[19]
For the series including the sections l, …, l+s with the total number of screens Nl,l+s = nl + nl+1 + ··· + nl+s the mean single-fiber collection efficiency for the particles which passed through the previous l−1 sections is[20]
[20]
As the mean single-fiber collection efficiency is a function of the number N of screens, it is important to clarify the character of this dependence. Consider a single-mode aerosol which is to be supplied to the inlet of the diffusion battery. Let the size distribution of particles be governed by the lognormal function with the geometric mean diameter of 150 nm and σ = 1.4. Then, using Equations (Equation4
[4]
[4] ) and (Equation12
[12]
[12] ) the penetrations gi can be calculated for this size distribution function as
[21]
[21]
The calculated values g1, g2, …, g9 are 0.955, 0.912, 0.833, 0.697, 0.493, 0.256, 0.0775, 0.00959, 0.000290, respectively. For each penetration gi one can calculate the mean single-fiber collection efficiency[22]
[22]
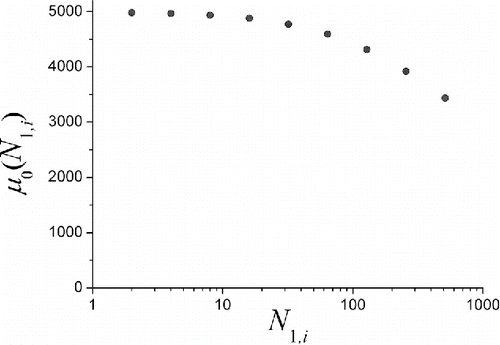
demonstrates the calculated dependence for the size spectrum under consideration. Nine points in the graph correspond to
for i = 1, 2, 3, …, 9, respectively. One can see that the mean collection efficiency decreases monotonically with the increasing number of screens, and, therefore, when estimating the mean particle diameter from the mean collection efficiency in the sections one should take into account the numbers of screens in these sections.
Figure 4. vs. N1,i dependence for the model lognormal size distribution.
Now let us find the mean diameter D1 for the fraction of particles collected by the first section. All the original particles can be divided into two groups. The first-group particles, the fraction of which is g1, are those penetrated through the first section of the diffusion battery, and the second group is constituted by the particles collected on the first section screens. The fraction of the second-group particles in the original spectrum is[23]
[23]
These two groups can be considered as two independent parts of the original spectrum (with different mean diameters), and each of them is governed by its own size distribution function. If in some imaginary experiment we select the first group of particles and let it pass through the first section, then, as follows from Equation (Equation4[4]
[4] ), the fraction of penetrated particles is
, where
is the mean single-fiber collection efficiency in a stack of n1 screens for the first group particles. Similarly, for the second group, penetration through the first section is
, where
is the mean single-fiber collection efficiency in a stack of n1 screens for the second group particles. As the total penetration g1 of the original aerosol through the first section is equal to the sum of penetrations of the above-mentioned fractions, we have
[24]
[24]
In our case n1 = n2 = 2, therefore, . Then, as follows from Equation (Equation19
[19]
[19] )
[25]
[25] and finally we get from Equations (Equation23
[23]
[23] ) and (Equation25
[25]
[25] ) the rigorous formula for the mean collection efficiency in the first section for the particles of first fraction
[26]
[26]
For monodisperse particles, the single-fiber collection efficiency μ is directly related to the particle diameter D by the formulas Equations (Equation5[5]
[5] ) and (Equation11
[11]
[11] ). In the case of polydisperse particles, some equivalent diameter can be brought into correspondence with mean single-fiber collection efficiency. This equivalent diameter is equal to the diameter of monodisperse particles with the same penetration through the stack of screens as that for polydisperse ones. The equivalent diameter corresponding to
is considered as the modal diameter for the particles of first fraction. Then, substituting the right-hand side of Equation (Equation26
[26]
[26] ) instead of μ in the left-hand side of Equation (Equation5
[5]
[5] ) and solving Equations (Equation5
[5]
[5] )–(Equation11
[11]
[11] ) numerically we obtain D1 and, finally,
from Equation (Equation16
[16]
[16] ).
In the general case for 1 < i < m for aerosol passing through two adjacent sections i and i+1 one can write down the equation similar to Equation (Equation24[24]
[24] ):
[27]
[27]
Taking into account that[28]
[28]
we obtain from Equations (Equation27[27]
[27] ) and (Equation28
[28]
[28] )
[29]
[29]
The quantity in the right-hand side of Equation (Equation29
[29]
[29] ) cannot be determined directly from the experimentally measured penetrations (because, for this purpose the aerosol from the outlet of section i should be redirected back to the inlet of section i). However, as
is a monotonic function of N (see ), one can find an approximate value of
using a simple interpolation. In other words, for the aerosol coming out of the i-th section, the mean single-fiber efficiency
of collection in the stack of ni + ni+1 screens can be considered as the arithmetic mean of the collection efficiencies in stacks with ni+1 and (ni+1 + ni+2) screens. The last two values can be calculated from the diffusion battery penetrations. Thus, for 1 < i <m – 1 we get
[30]
[30]
For i = m – 1 we cannot use Equation (Equation30[30]
[30] ) (as the last penetration is gm and gi+2 doesn't exist for i = m − 1), therefore we use the following formula
[31]
[31]
Equation (Equation31[31]
[31] ) is a rougher approximation than Equations (Equation30
[30]
[30] ). However, one can estimate, for example, for the modal single-mode spectrum considered in , that even this rough approximation gives only 2% of sizing error. This error is essentially less than the total sizing accuracy of the analytical solution. It will be shown in Section 3.4. () that the total sizing accuracy of the analytical solution is about 10%, which is mainly determined by the experimental errors ϵi (see Equation (Equation3
[3]
[3] )). Substituting Equation (Equation30
[30]
[30] )/Equation (Equation31
[31]
[31] ) into Equation (Equation29
[29]
[29] ) and, then, substituting the right-hand side of Equation (Equation29
[29]
[29] ) instead of μ in the left-hand side of Equation (Equation5
[5]
[5] ) and, finally, solving Equations (Equation5
[5]
[5] )–(Equation11
[11]
[11] ) numerically we obtain Di and
from Equation (Equation16
[16]
[16] ).
Table 1. Arithmetic mean diameters determined from TEM/Settling and diffusion battery measurements.
For i = m one can rigorously calculate[32]
[32]
which gives us the quantities Dm and . After finding
the final size distribution function
can be calculated using Equations (Equation16
[16]
[16] ) and (Equation18
[18]
[18] ). The size distribution calculated in this way is shown in to be almost identical to the size distribution as recovered earlier from the geometric mean diameters of fractions calculated numerically for the bimodal spectrum known a priori ().
Thus, the formulas Equations (Equation5[5]
[5] )–(Equation11
[11]
[11] ), (Equation16
[16]
[16] ), (Equation18
[18]
[18] ), (Equation26
[26]
[26] ), (Equation29
[29]
[29] ), and (Equation32
[32]
[32] ), give an easy way to calculate analytically the parameters of particle size distribution from diffusion battery penetrations. As mentioned in Section 2.2, the screens in our diffusion battery are distributed in sections in such a way that the number of screens in each section (except for the first one) is equal to the total number of screens upstream. One of the advantages of this design is that n1 = n2. In this case we obtain the mathematically exact mean diameter D1 for the first fraction which follows from Equation (Equation26
[26]
[26] ) solved together with the μ vs. D dependency shown in . On the other hand, Equation (Equation32
[32]
[32] ) is another rigorous formula which gives us the exact value of mean diameter for the last fraction. As mentioned above, the formulas Equations (Equation29
[29]
[29] ) and (Equation30
[30]
[30] ) result in the approximate values of mean diameters for fractions with the accuracy of about 2%. Thus, from the mathematical point of view, the total sizing accuracy of the analytical inversion under consideration is rather high. Some additional advantages of the chosen screen distribution over sections will be shown in our subsequent publication where new formulas for analytical inversion will be derived using this design.
To obtain a more ideal agreement between the calculated and original spectra, one can use the analytical solution as an initial approximation in the numerical simulation. In this case, we can tremendously save the calculation resources, as we just need a weak tuning of the analytical solution to fit the experimental penetrations better. It is appropriate to mention that the numerical solution is independent of the value of SGD used in analytical solution. In Section 3.3 we describe our approach to this numerical tuning.
For particle diameters D < 200 nm the deposition efficiency is mainly governed by the diffusion mechanism, i.e., Equation (Equation5[5]
[5] ) can be expressed as
[33]
[33]
Substituting Equation (Equation7[7]
[7] ) into Equation (Equation33
[33]
[33] ) one gets
[34]
[34]
For small particles, the diffusion coefficient can be determined in terms of the molecular-kinetics theory using the Chapman-Enskog approach (Poling et al. Citation2001)[35]
[35] where σLJ is Lennard – Jones parameter (for air, it is σLJ = 0.37 nm), Ω is the diffusion collision integral, which can be taken as equal to Ω ≈ 1.25 for the collisions of air molecules with relatively large particles (Poling et al. Citation2001),
is the concentration of gas molecules,
is the mass of gas molecules. For particle diffusion in the air at a temperature of 293K and pressure 1 atm, we obtain from Equation (Equation35
[35]
[35] )
[36]
[36]
Then, Equation (Equation34[34]
[34] ) can be written in the following form
[37]
[37]
Finally, substituting Equation (Equation37[37]
[37] ) instead of
,
and
in Equations (Equation26
[26]
[26] ), (Equation29
[29]
[29] ) and (Equation32
[32]
[32] ), respectively, we obtain the formulas which give the mean diameters Di of fractions from the diffusion battery measurements:
[38]
[38] where
and
can be obtained from Equations (Equation30
[30]
[30] ) and (Equation31
[31]
[31] ).
The formulas Equation (Equation38[38]
[38] ) are easy to use as they do not need any iteration procedure to calculate mean diameters Di and allow recovering the size distribution with a reasonable accuracy (compare and ) just using a simple calculator.
3.3. Numerical calculations of size distribution
The size distribution as determined from approximate analytical formulas Equations (Equation26[26]
[26] ), (Equation29
[29]
[29] ), and (Equation32
[32]
[32] ) can be considered as an initial approximation for the numerical calculation. Then the more exact solution can be obtained in an iterative procedure. To carry out the numerical simulations, the range of particle diameters 2 – 1100 nm was divided into 75 channels uniformly in the logarithmic scale. Then, the particles were distributed over these channels in agreement with the analytically determined size distribution function. The total number of particles was normalized to unity. The particles from j-th channel have one and the same diameter Dj equal to the geometric mean of maximum and minimum values of the j-th channel size range. To detach slightly the starting size distribution from the analytical solution, the initial spectrum was randomized by multiplying the number of particles in each channel by coefficient 1 + γ, where γ is a random quantity to be in the range from −γmax to γmax. The quantity γmax was set as equal to 0.15. This value controls the distance in the field of solutions over which the randomization transfers the solution from the analytical one.
After randomization, the total number of particles was normalized to unity again. Then the penetrations were calculated
[39]
[39] where i is the number of diffusion battery section, j is the channel number,
is the number of particles in the j – th channel,
is calculated by Equations (Equation5
[5]
[5] )–(Equation11
[11]
[11] ) for diameter Dj of particles of j-th section. The weighted penetration probability was determined using the numerically calculated penetrations for the randomized spectrum:
[40]
[40] where
,
and
are the experimentally measured concentrations. The calculated quantity
was compared with the experimental weighted penetration probability determined from the experimental penetrations gi (Equation (Equation1
[1]
[1] ))
[41]
[41]
To this aim the deviation was calculated
[42]
[42] where
means the absolute value.
After the calculation of the particle permutations were provided. To this aim, the number npart of particles for displacement from channel to channel was calculated:
[43]
[43]
where γpart is a parameter to be varied from 0 to 1, Nch = 75 is the number of size range channels. One can see that npart is equal to the fraction γpart of the average number of particles per channel. Then the number npart of particles was displaced from one channel (randomly chosen) to the neighboring one, at first to the smaller size side, and then to the opposite side. If the number of particles in the chosen channel before displacement was less than γpart/Nch, the value npart was set as equal to the number of particles in the channel. After each displacement, the quantity was calculated. If
decreased due to the displacement, particle permutation was accepted, otherwise particle displacement was canceled. Thus, the random particle permutation was continued until
reached its minimum. Afterwards the value npart was decreased twice, and the random particle displacement was repeated until
reached the new minimum. Thus, decreasing consequently the value npart, the spectrum adjustment was performed until
reached the final minimum. Then the spectrum randomization with consequent particle perturbation to minimize
was repeated for five times. If after the next randomization−permutation step the final value of
was higher than before, the step was canceled. The initial and consequent randomizations are necessary to find the deepest minimum of
in the neighborhood of the initial analytical solution but not the first met local minimum. Note, γpart in the nominator of Equation (Equation43
[43]
[43] ) was selected to be equal to γmax. This means that the spread of the zone for searching minimum of
after randomization is approximately equal to the distance of transfer in the field of solutions due to the randomization. That means that we have a large continuous zone for searching the minimum of
in the field of solutions consisting of a series of overlapping spots. If γpart << γmax, the zone for searching the minimum would be formed as small separate spots. In the opposite case of γpart >> γmax all the randomization procedures would result in searching the minimum within one and the same single spot. It is found that five randomization steps are enough to reach the deepest minimum within the experimental accuracy 5% of measuring concentrations C0, …, Cm (see Section 3.4 for some details). A typical calculation time was less than 1s.
As above-said, the basis of our numerical calculations is the minimization of quantity . This numerical approach is conceptually close to the Tikhonov regularization method (TRM) (Tikhonov and Arsenin Citation1979) which is in searching the following minimum
[44]
[44]
where δ is the regularization parameter and S is stabilizer. Normally the second order stabilizer is used (Bashurova et al Citation1992)[45]
[45]
Actually the quantity S imposes a smoothing constraint which gives a stable solution to the highly ill-posed mathematical problem. In other words, the use of smoothing constrain allows one to restrict the infinite field of mathematically valid solutions to a single one. In our case the use of the analytical solution as an initial approximation plays the role of smoothing constraint. Our numerical approach has the same accuracy as TRM but saves the computation time tremendously.
3.4. Comparison with experimentally measured spectra
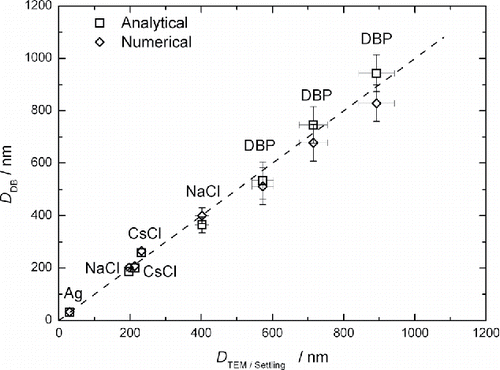
The particle size distributions measured with the help of diffusion battery were compared with the spectra as retrieved from the TEM and gravity settling methods. When measuring size spectra by means of diffusion battery, the aerosol number concentration was kept in the range 104 – 105 cm−3. Typical TEM images of Ag, NaCl and CsCl particles are shown in Figures S5 – S7. Particles of Ag are aggregates consisting of small primary particles, NaCl particles have a rectangular shape, and the shape of CsCl particles is close to spherical. When determining the size distribution from TEM images, the equivalent diameter of each particle was found as the geometric mean between the length and width of the rectangle enclosing the image of a single particle or aggregate. This diameter is close to the projected area equivalent diameter, and the latter one is about equal to the mechanical mobility diameter (Rogak et al. Citation1993). The settling equivalent diameter is equal to the mechanical mobility diameter as well. As the diffusion battery separates particles by the mechanical mobility, the size spectrum from TEM images or settling experiments can be compared with that from diffusion battery measurements. compares the TEM/Settling and diffusion battery spectra. The agreement between the diffusion battery and there physical methods seems to be rather good. However, one should note that the analytical and numerical solutions are appreciably different for silver. The reason for this unconformity lies in the experimental errors of diffusion battery. Aerosol is not homogeneous as it enters the diffusion battery. The aerosol inhomogeneity results in the fluctuations of aerosol concentrations measured downstream of diffusion battery cascades, and, as a consequence, in the error in measuring penetrations. The width and shape of aerosol spectrum are more sensitive to the experimental errors than the mean diameter. The experimental errors may affect the analytical and numerical solutions in different manners. That is why we observe a different concordance of analytical and numerical solutions in the case of silver. shows the mean diameter correspondence between the TEM/Settling and diffusion battery measurements. One can conclude that both analytical and numerical solutions demonstrate good sizing accuracy. The mean diameters are summarized in as well.
Figure 5. Comparison of particle size distributions obtained from diffusion battery and TEM/gravity settling measurements. Hystogram – TEM/gravity settling measurements, lines – diffusion battery (dash line – analytical solution, solid line – numerical solution). All the spectra are normalized to the maximum value.
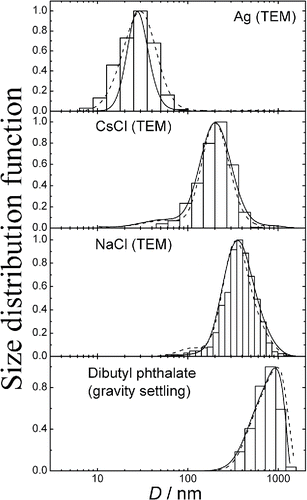
Figure 6. Mean diameter correspondence between the TEM/Settling and diffusion battery measurements. DDB and DTEM/Settling are the arithmetic mean diameters determined by diffusion battery and TEM/Settling method, respectively. Dash line is one to one correspondence between DDB and DTEM/Settling.
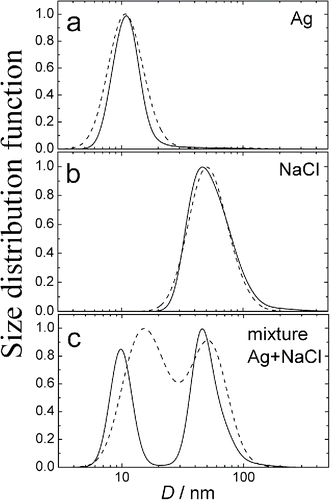
Tests of the size resolution were also provided. For this purpose, two evaporation-nucleation aerosol generators were put in parallel generating Ag and NaCl particles of mean diameters 10 and 50 nm, respectively ( and ). Then the two aerosol flows were mixed together, and the resulting size distribution was measured with the diffusion battery (). One can see relatively poor size resolution by the analytical solution (dash line), but the numerical adjustment of analytical solution demonstrates an excellent resolution (solid line).
Figure 7. Particle size distributions retrieved from diffusion battery measurements for aerosol of Ag (a), NaCl (b) and mixture Ag + NaCl (c). Dash line – analytical solution, solid line – numerical solution. All the spectra are normalized to the maximum value.
4. Conclusions
A new method to determine the size distribution function of aerosol particles from the experimentally measured diffusion battery penetrations is proposed. This method is quite different from the traditionally used way to transform some initial size distribution gradually until the calculated diffusion battery penetrations became in good agreement with the experimental ones. The main idea of our approach is to determine the size spectra of fractions of particles separated by different sections of the diffusion battery, and the total particle size distribution function is the sum of the spectra of fractions. To find the size spectra of fractions, a special algorithm is elaborated, which allows one to calculate the mean diameter of the fractions of particles from the experimental diffusion battery penetrations. To this end, analytical formulas are derived relating the mean single-fiber collection efficiency for the particles of different fractions to the diffusion battery penetrations. Thus, the mean single-fiber collection efficiencies for fractions are calculated using the experimental penetrations and then, using the fan model filtration theory, the mean diameters of fractions are calculated by the iteration procedure. Finally, the spectra of fractions are approximated by monomodal distributions using calculated mean diameters. The advantage of our analytical approach is that it gives the one-to-one correspondence between the diffusion battery penetrations and the particle size distribution. Besides, the analytical solution is stable, i.e., for any penetration perturbation tending to zero the corresponding perturbation in size distribution also tends to zero.
For relatively small particles with the mean diameter less than 200 nm, simplified analytical formulas are derived directly relating the mean diameter of fractions to the diffusion battery penetrations. Then the size spectrum of the original aerosol can be calculated directly without any iteration procedure.
To demonstrate the validity of this approach, the size spectra of aerosol generated by laboratory equipment are determined from both the diffusion battery analytical solution and other physical methods. It is found that the analytical solution demonstrates a good sizing accuracy but relatively poor size resolution. To improve the size resolution, a numerical approach is proposed. The difference of this approach from the traditional numerical methods is in the fact that we use the analytical solution as the first approximation, thus tremendously saving the computational recourses. The numerical adjustment demonstrates an excellent size resolution for the neighboring peaks at 10 and 50 nm for the aerosol generated by the laboratory equipment.
Thus, we believe that the new analytical approach can be useful for specialists in different areas of science and engineering as it allows recovering the particle size spectrum from the diffusion battery measurements without complex mathematical processing. On the other hand, in combination with numerical calculations, the analytical method allows obtaining an exact solution without heavy computational expenses.
The reported study was funded by RFBR and Novosibirsk region according to the research project № 17-43-540767 р_а.
Nomenclature
| C0 | = | particle number concentration measured at the inlet of diffusion battery (cm−3) |
| CC | = | Cunningham correction factor |
| Ci | = | particle number concentration measured downstream of the i-th section of diffusion battery (cm−3) |
| D | = | particle diameter (cm) |
| Df | = | particle diffusion coefficient (cm2/s) |
| f(D) | = | particle size distribution function |
| = | particle size distribution approximated by the sum of lognormal functions | |
| gi = Ci/C0 | = | penetration through the first i sections of diffusion battery |
| h | = | thickness of screen (cm) |
| h1, h2, …, hm | = | fractions of particles separated by diffusion battery |
| = | inertial impaction parameter | |
| i | = | number of the diffusion battery section |
| Ki(D) | = | kernel function for the diffusion battery |
| k | = | Boltzmann constant (erg/K) |
| = | mass of gas molecules (g) | |
| nk | = | number of screens in the k-th section of diffusion battery |
| npart | = | number of particles for displacement from channel to channel in numerical calculations |
| N1,i | = | total number of screens upstream of i-th section of diffusion battery |
| Nl,l+s = nl + nl+1 + ··· + nl+s | = | total number of screens for the series of diffusion battery sections with numbers from l to l+s |
| = | Peclet number | |
| = | penetration through a cascade of sections 1, 2, …, i for monodisperse particles of diameter D | |
| = | interception parameter | |
| r | = | radius of fiber (cm) |
| = | Stokes number | |
| T | = | absolute temperature (K) |
| U0 | = | velocity of undisturbed flow through the diffusion battery (cm/s) |
| α | = | solid volume fraction |
| = | penetration probability deviation | |
| ϵi | = | experimental error for the penetration gi |
| η | = | gas dynamic viscosity (Poise) |
| κ = −0.5 ln | = | hydrodynamic factor |
| λ | = | gas mean free pass (cm) |
| μ | = | single-fiber collection efficiency |
| μD | = | single-fiber collection efficiency due to diffusion |
| μDR | = | correction term for single-fiber collection efficiency due to interception for the diffusing particles |
| μI | = | single-fiber collection efficiency for inertial impaction |
| = | mean single-fiber collection efficiency in a stack of N screens for particles coming out of the j-th section of diffusion batter | |
| μR | = | single-fiber collection efficiency for interception |
| = | mean single-fiber collection efficiency in a stack of N screens for the particles with size distribution function ϕi. | |
| ρ | = | particle density (g/cm3) |
| σ | = | standard geometric deviation (SGD) |
| σLJ | = | Lennard - Jones parameter (cm) |
| = | size spectra of the fractions of particles separated by diffusion battery | |
| = | lognormal approximation of spectrum ϕi | |
| = |
| |
| = | calculated weighted penetration probability | |
| = | experimental weighted penetration probability | |
| Ω | = | diffusion collision integral |
UAST_1387642_Supplemental_data
Download PDF (824.6 KB)Related Research Data
References
- Aalto, P., Tapper, U., Paatero, P., and Raunemaa, T. (1990). Deconvolution of Particle Size Distributions by Means of Extreme Value Estimation Method. J. Aerosol Sci., 21:S159–S162.
- Amaral, S. S., de Carvalho, J. A., Costa, M. A. M., and Pinheiro, C. (2015). An Overview of Particulate Matter Measurement Instruments. Atmosphere, 6:1327–1345.
- Ankilov, A., Baklanov, A., Mavliev, R., and Eremenko, S. (1991). Comparison of the Novosibirsk automated diffusion battery with the Vienna electromobility spectrometer. J. Aerosol Sci., 22:S325–328.
- Baron, P. A., Mazumder, M. K., Cheng, Y.-S., Peters, T. M. (2011). Real-Time Techniques for Aerodynamic Size Measurement, in Aerosol Measurement. Principles, Techniques, and Applications, P., Kulkarni, P. A. Baron, and K. Willeke, Eds, Willey, New Jersey, pp. 321–338.
- Bashurova, V. S., Dreiling, V., Hodger, T. V., Jaenicke, R., Koutsenogii, K. P., Koutsenogii, P. K., Kraemer, M., Makarov, V. I., Obolkin, V. A., Potjomkin, V. L., and Pusep, A. Y. (1992). Measurements of Atmospheric Condensation Nuclei Size Distributions in Siberia. J. Aerosol Sci., 23:191–199.
- Biskos, G., Vons, V., Yurteri, C. U., and Schmidt-Ott, A. (2008). Generation and Sizing of Particles for Aerosol-Based Nanotechnology. KONA Powder Particle J., 28:13–35.
- Carvalho, S. R., Watts, A. B., Peters, J. I., and Williams, R. O. (2015). Dry Powder Inhalation for Pulmonary Delivery: Recent Advances and Continuing Challenges. in Pulmonary Drug Delivery. Advances and Challenges, A. Nokhodchi and G. P. Martin, eds, Wiley, London, 35–62.
- Chen, B. T., Fletcher, R. A., and Cheng, Y.-S. (2011). Calibration of Aerosol Instruments. in Aerosol Measurement. Principles, Techniques, and Applications, P. Kulkarni, P. A. Baron, and K. Willeke, Eds, Willey, New Jersey, 449–478.
- Cheng, Y. S. and Yeh, H. C. (1980). Theory of a Screen-type Diffusion Battery. J. Aerosol Sci., 11:313–320.
- Cheng, Y. S., Keating, J. A., and Kanapilly, G. M. (1980). Theory and Calibration of a Screen-type Diffusion Battery. J Aerosol Sci., 11:549–556.
- Cheng, Y. S., Yeh, H. C., Brinsko, K. J. (1985). Use of Wire Screens as a Fan Model Filter, Aerosol Sci. Technol., 4:165–174.
- Cheng, Y.-S. (2011). Instruments and Samplers Based On Diffusional Separation. in Aerosol Measurement. Principles, Techniques, and Applications, P. Kulkarni, P. A. Baron, and K. Willeke, Eds, Willey, New Jersey, 365–379.
- Dekkers, P. J. and Friedlander, S. K. (2002). The Self-Preserving Size Distribution Theory. I. Effects of the Knudsen Number on Aerosol Agglomerate Growth. J. Colloid Interface Sci. 248:295–305.
- Dubtsov, S., Ovchinnikova, T., Valiulin, S., Chen, X., Manninen, H.E., Aalto, P.P., Petäjä, T. (2017). Laboratory Verification of Aerosol Diffusion Spectrometer and the Application to Ambient Measurements of New Particle Formation. J. Aerosol Sci., 105:10–23.
- Eremenko, S. and Ankilov, A. (1995). Conversion of the diffusion battery data to particle size distribution: Multiple Solutions Averaging algorithm (MSA), J. Aerosol Sci. 26: 749–750.
- Ferri, F., Bassini, A., Paganini, E. (1995). Modified Version of the Chahine Algorithm to Invert Spectral Extinction Data for Particle Sizing. Appl. Opt., 34:5829–5839.
- Fierz, M, Weimer, S, Burtscher, H. (2008). Design and Performance of an Optimized Electrical Diffusion Battery, J. Aerosol Sci., 40:152–163
- Flagan, R. C. (2011). Electrical Mobility Methods for Submicrometer Particle Characterization. in Aerosol Measurement. Principles, Techniques, and Applications, P. Kulkarni, P. A. Baron, and K. Willeke, Eds, Willey, New Jersey, 339–364.
- Flagan, R. C. (2011). Electrical Mobility Methods for Submicrometer Particle Characterization, in Aerosol Measurement. Principles, Techniques, and Applications, P. Kulkarni, P. A. Baron, and K. Willeke, Eds, Willey, New Jersey, 339–364.
- Friedlander, S. K. and Wang, C. S. (1966). The Self-Preserving Particle Size Distribution for Coagulation by Brownian Motion, J. Colloid Interface Sci., 22:126–132.
- Fuchs, N. A. (1964). The Mechanics of Aerosols. Pergemon Press, Oxford.
- Fuchs, N. A., Stechkina, I. B., and Starosselskii, V. I. (1962). On the Determination of Particle Size Distribution in Polydisperse Aerosols by the Diffusion Method, Brit. J. Appl. Phys., 13:280–281.
- Fuks, N.A. and Sutugin, A.G. (1968). Highly Dispersed Aerosols, Russ. Chem. Rev., 37(11):855–862.
- Fuks, N.A. and Sutugin, A.G. (1971). High-Dispersed Aerosols, in Topics in Current Aerosol Research G. M. Hidy and J. R. Brock Eds, Pergamon Press, New-York, 1–60.
- Fuzzi, S., Baltensperger, U., Carslaw, K., Decesari, S., van der Gon, H. D., Facchini, M. C., Fowler, D., Koren, I., Langford, B., Lohmann, U., Nemitz, E., Pandis, S., Riipinen, I., Rudich, Y., Schaap, M., Slowik, J. G., Spracklen, D. V., Vignati, E., Wild, M., and Williams, M., Gilardoni, S. (2015). Particulate Matter, Air Quality and Climate: Lessons Learned and Future Needs, Atmos. Chem. Phys. 15:8217–8299.
- Gorbunov, B., Priest, N. D., Muir, R. B., Jackson, P. R., and Gnewuch, H. (2009). A Novel Size-Selective Airborne Particle Size Fractionating Instrument for Health Risk Evaluation, Ann. Occup. Hyg., 53:225–237.
- Gulak, Y., Jayjock, E., Muzzio, F., Bauer, A., and McGlynn, P. (2010). Inversion of Andersen Cascade Impactor Data using the Maximum Entropy Method, Aerosol Sci. Technol., 44:29–37.
- Harrison, R. M. (1986). Analysis of Particulate Pollutants, in Handbook of Air Pollution Analysis, R. M. Harrison and R. Perry, eds, Chapman and Hall, New York, 155–214.
- Hinds, W. C. (1999). Aerosol Technology: Properties, Behavior, and Measurement of Airborne Particles. John Wiley & Sons, New-York.
- Intra, P. and Tippayawong, N. (2008). An Overview of Differential Mobility Analyzers for Size Classification of Nanometer-sized Aerosol Particles. Songklanakarin J. Sci. Technol. 30:243–256.
- John, W. (2011). Size distribution characteristics of aerosols, in Aerosol Measurement. Principles, Techniques, and Applications, P. Kulkarni, P. A. Baron, and K. Willeke, Eds, Willey, New Jersey, 41–54.
- Kang, J. S., Lee, K. S., Lee, K. H., Sung, H. J., and Kim, S. S. (2012). Characterization of a Microscale Cascade Impactor, Aerosol Sci. Technol., 46:966–972.
- Kirsch, A. A. and Chechuev, P. V. (1985). Diffusion Deposition of Aerosol in Fibrous Filters at Intermediate Peclet Numbers, Aerosol Sci. Technol., 4:11–16.
- Kirsch, A.A. and Stechkina, I.B. (1977). Inertial Deposition of Aerosol Particles in Model Filters at Low Reynolds Numbers, J. Aerosol Sci., 8:301–307.
- Kirsch, A.A., Stechkina, I.B., and Fuchs, N.A. (1969). Studies on Fibrous Aerosol Filters—Experimental Determination of Fibrous Filters Efficiency in the Range of Maximum Particle Penetration. Colloid J. USSR, 31(2):227–232.
- Kirsch, A.A., Stechkina, I.B., and Fuchs, N.A. (1975).. Efficiency of Aerosol Filters Made of Ultrafine Polydisperse Fibres. J. Aerosol Sci., 5:119–124.
- Kirsh, V. A., Pripachkin, D. A., and Budyka, A. K. (2010). Inertial deposition of aerosol particles from laminar flows in fibrous filters, Colloid J. (Russ) 72(2):211–215.
- Knutson, E. O. (1999). History of Diffusion Batteries in Aerosol Measurements. Aerosol Sci. Technol., 31:83–128.
- Kravchenko, I. I., Lekhtmakher, S. O., and Ruzer, L. S. (1971). Calculation of Particle Diffusional Deposition for Aerosol with the Lognormal Size Distribution in Cylindrical Channels. Colloid J. USSR 33:923–924
- Last, J. A., Russell, P., Nealey, P. F., Murphy, C. J. (2010). The Applications of Atomic Force Microscopy to Vision Science, Invest. Ophthalmol. Visual Sci., 51:6083–6094.
- Lee, K. W., Chen, J., and Gieseke, J. A. (1984). Log-Normally Preserving Size Distribution for Brownian Coagulation in the Free-Molecule Regime, Aerosol Sci. Technol., 3(1):53–62.
- Lee, K. W., Connick, P. A., and Gieseke, J. A. (1981). Extension of the Screen Type Diffusion Battery Theory, J. Aerosol Sci., 12:385–386.
- Lushnlkov, A.A. and Zagaynov, V.A. (1990). On Diffusion Dynamical Method of the Particle Size Analysis. J. Aerosol Sci., 21:S163–S165.
- Maher, E. F., and Laird, N. M. (1985). EM Algorithm Reconstruction of Particle Size Distributions From Diffusion Battery Data. J. Aerosol Sci., 16:557–570.
- Manzoor, S. and Kulshrestha, U. (2015). Atmospheric Aerosols: Air Quality and Climate Change Perspectives. Curr. World Environ., 10:738–746
- McMurry, P. H. (2000). A review of atmospheric aerosol measurements. Atmos. Environ., 34:1959–1999.
- Mercer, T. T. and Greene, T. D. (1974). Interpretation of diffusion battery data. J. Aerosol Sci., 5:251–255.
- Mitchell, J. P. and Nagel, M. W. (2003). Cascade Impactors for the Size Characterization of Aerosols from Medical Inhalers: Their Uses and Limitations. J. Aerosol Med., 16:341–377.
- Nolan, P. J. and Scott, J. A. (1963/1964). Observations on the Heterogeneity of Condensation Nuclei, Proceedings of the Royal Irish Academy. Section A: Math. Phys. Sci., 63:35–47.
- Onischuk, A. A., Tolstikova, T. G., Sorokina, I. V., Zhukova, N. A., Baklanov, A.M., Karasev, V. V., Borovkova, O. V., Dultseva, G. G., Boldyrev, V. V., Fomin, V. M., (2009). Analgesic Effect from Ibuprofen Nanoparticles Inhaled by Male Mice. J Aerosol Med. Pulm. Drug. Deliv., 22:245–53.
- Onischuk, A. A., Vosel, S. V., Borovkova, O. V., Baklanov, A. M., Karasev, V. V., and di Stasio, S. (2012). Experimental Study of Homogeneous Nucleation from the Bismuth Supersaturated Vapor: Evaluation of the Surface Tension of Critical Nucleus, J. Chem. Phys., 136(1–18):224506.
- Onischuk, A.A., di Stasio, S., Karasev, V.V., Baklanov, A.M., Makhov, G.A., Vlasenko, A.L., Sadykova, A.R., Shipovalov, A.V., and Panfilov, V.N. (2003). Evolution of structure and charge of soot aggregates during and after formation in a propane/air diffusion flame. J. Aerosol Sci., 34:283–403.
- Onischuk, A.A., di Stasio, S., Karasev, V.V., Strunin, V.P., Baklanov, A.M., and Panfilov, V.N. (2000). Evidence for Long-Range Coulomb Effects during Formation of Nanoparticle Aggregates from Pyrolysis and Combustion Routes. J. Phys. Chem. A, 104:10426–10434
- Onischuk, A.A., Levykin, A.I., Strunin, V.P., Sabelfeld, K.K., and Panfilov, V.N. (2001). Formation of electrical dipoles during agglomeration of unchurged particles of hydrogenated silicon. J. Aer. Sci., 32:87–105.
- Onischuk, A. A., Tolstikova, T. G., An'kov, S. V., Baklanov, A. M., Valiulin, S. V., Khvostov, M. V., Sorokina, I. V., Dultseva, G. G., and Zhukova, N. A. (2016a). Ibuprofen, Indomethacin and Diclofenac Sodium Nanoaerosol: Generation, Inhalation Delivery and Biological Effects in Mice and Rats. J. Aer. Sci., 100:164–177.
- Onischuk, A. A., Valiulin, S. V., Vosel, S. V., Karasev, V. V., Zelik, V. D., and Baklanov, A. M. (2016b). Surface Tension of Sulfur Nanoparticles as Determined from Homogeneous Nucleation Experiments. J. Aer. Sci., 97:1–21.
- Onischuk, A. A., Vosel, S. V., Borovkova, O. V., Baklanov, A. M., Karasev, V. V., and di Stasio, S. (2012). Experimental Study of Homogeneous Nucleation from the Bismuth Supersaturated Vapor: Evaluation of the Surface Tension of Critical Nucleus. J. Chem. Phys., 136(1–18):224506
- Paatero, P., Tapper, U., Aalto, P., and Kulmala, M. (1991). Matrix Factorization Methods for Analysing Diffusion Battery Data. J. Aerosol Sci., 22:S273–S276.
- Poling, B.E., Prausnitz, J.M., and O'Connell, J.P. (2001).. The Properties of Gases and Liquids. McGraw-Hill, New York.
- Pollak, L. W. and Metnieks, A. L. (1957). On the Determination of the Diffusion Coefficient of Heterogeneous Aerosols by the Dynamic Method, Geofisica Pura e Applicata, 37:183–190.
- Reineking, A. and Porstendörfer, J. (1986). High-Volume Screen Diffusion Batteries and α-Spectroscopy for Measurement of the Radon Daughter Activity Size distributions in the Environment. J. Aerosol Sci., 17:873–879.
- Reist, P. C. (1993). Aerosol Science and Technology. McGraw-Hill Inc., New York.
- Rogak, S. N., Flagan, R. C., and Nguyen, H. V. (1993). The Mobility and Structure of Aerosol Agglomerates, Aerosol Sci. Technol., 18(1):25–47.
- Sabbagh-Kupelwieser, N., Horvath, H., and Szymanski, W. W. (2010). Urban Aerosol Studies of PM1 Size Fraction with Reference to Ambient Conditions and Visibility. Aerosol Air Qual. Res., 10:425–432.
- Sanders, M. (2011). Pulmonary Drug Delivery: An Historical Overview, in Controlled Pulmonary Drug Delivery, H. D.C. Smyth and A. J. Hickey, eds, Springer, New York, 51–73.
- Sansone, E. B. and Weyel, D. A. (1971). A Note on the Penetration of a Circular Tube by an Aerosol with a Log-normal size Distribution. J. Aerosol Sci., 2:413–415.
- Sinclair, D., Countess, R. J., Liu, B. Y. H. and Pui, D. Y. H. (1979). Automatic Analysis of Submicron Aerosols, in Book: Aerosol Measurement, D. A. Lundgren, F. S. Jr. Harris, M. Lippmann, W. E. Clark, and M. D. Durham, Eds, A University of Florida Book, University Presses of Florida Gainesville, 544–563.
- Sorensen, C. M., Gebhart, J., O'Hern, T. J., and Rader, D. J. (2011). Optical Measurement Techniques: Fundamentals and Applications, in Aerosol Measurement. Principles, Techniques, and Applications, P. Kulkarni, P. A. Baron, and K. Willeke, Eds, Willey, New Jersey, 277–320.
- Stechkina, I. B., Kirsch, A. A., and Fuchs, N. A. (1969). Studies on Fibrous Aerosol Filters-IV Calculation of Aerosol Deposition in Model Filters in the Range of Maximum Penetration, Ann. Occup. Hyg., 12:1–8.
- Tikhonov, A. N. and Arsenin, V. Ya. (1979). Methods of Solution of Ill-Posed Problems. Nauka, Moscow (in Russian).
- Twomey, S. (1975). Comparison of Constrained Linear Inversion and an Iterative Nonlinear Algorithm Applied to the Indirect Estimation of Particle Size Distributions, J. Comput. Phys., 18:188–200.
- Volkwein, J. C., Maynard, A. D., Harper, M. (2011). Workplace Aerosol Measurement, in Book: AEROSOL MEASUREMENT. Principles, Techniques, and Applications, P. Kulkarni, P. A. Baron, and K. Willeke, Eds, Willey, New Jersey, 571–590.
- Vosburgh, D. J. H., Klein, T., Sheehan, M., Anthony, T. R., Peters, T. M. (2013). Design and Evaluation of a Personal Diffusion Battery. Aerosol Sci. Technol., 47:435–443.
- Voutilainen, A., Kolehmainen, V., Stratmann, F., Kaipio, J.P. (2001). Computational Methods for the Estimation of the Aerosol Size Distributions. in Mathematical Modeling. Problems, Methods, Applications, L.A. Uvarova and A. V. Latyshev, Eds, Springer Science+Business Media, Llc, New York, 219–230.
- Wang, Y. and Yangm, Ch. (2008). Regularizing Active Set Method for Retrieval of the Atmospheric Aerosol Particle Size Distribution Function. J. Opt. Soc. Am. A, 25:348–356.
- Whitby, K. (1978). The Physical Characteristics of Sulfur Aerosols. Atmos. Environ., 12:135–159.
- Yee, E. (1989). On the Interpretation of Diffusion Battery Data. J. Aerosol Sci., 20:797–811.
- Zagaynov, V.A., Birjukov, J. G., and Lushnlkov, A. A (2006). Method of measuring spectrum of dimensions of condensation nuclei of aerosol particles and device to that end, patent RU 2 340 885 C2.