
ABSTRACT
Mass concentrations calculated from Aerodyne's aerosol mass spectrometers depend on particle collection efficiency (CE) and relative ionization efficiency (RIE, relative to the primary calibrant ammonium nitrate). We present new laboratory RIE measurements for a wide range of organic aerosol species (RIEOA). An improved laboratory RIE calibration protocol with size and mass selection of calibrant particles and a light scattering-based detection of CE is used. Simpler calibrations of alcohol RIEs using binary mixtures with NH4NO3 are demonstrated. Models that account for only thermal velocity and electron ionization of vaporized molecules do not reproduce RIEOA measurements, confirming that other processes are significant. The relationship between RIEOA and average carbon oxidation state (), a metric used to describe atmospheric OA, is investigated. An average RIEOA of 1.6 ± 0.5 (2σ) is found for −1.0 <
< 0.5, a range consistent with most ambient OA except hydrocarbon-like organic aerosol (HOA) and cooking organic aerosol (COA). RIEOA from 2 to 7 are found for
below and above this range. The RIEOA typically used for ambient OA (1.4 ± 0.3) is within the laboratory RIEOA measurement uncertainty of oxidized organic species, but is a factor of 2 to 5 lower than that of reduced species. Such biases in OA mass concentrations have not been observed in published field analyses. Chemically reduced ambient OA may have composition, phase states, or compensating CE effects that are not mimicked well in the laboratory. This work highlights the need for further ambient OA studies to better constrain the composition dependence of ambient RIEOA, and the need to always calibrate with the OA under study for laboratory experiments.
Copyright © 2018 American Association for Aerosol Research
EDITOR:
Introduction
Atmospheric aerosol particles have received considerable attention in the past few decades because of their effects on human health, climate, and air quality (IPCC Citation2013; Pope et al. Citation2013; Zhang et al. Citation2015). Since atmospheric aerosol particles are typically complex mixtures of inorganics and hundreds of organic compounds, real-time and online quantification of these species have posed a challenge to current existing analytical techniques (Hallquist et al. Citation2009; Nozière et al. Citation2015). In general, most OA instrumentation represents a tradeoff between molecular speciation and detection of total organic mass (Hallquist et al. Citation2009). In the case of Aerodyne aerosol mass spectrometers (AMS), for example, the information regarding full molecular identities is sacrificed to make more accurate total aerosol organic mass concentration measurements (Canagaratna et al. Citation2007). While molecular identification and quantification of a small fraction of OA species have been made possible using off-line and on-line methods (Williams et al. Citation2006; Hohaus et al. Citation2010; Yatavelli and Thornton Citation2010; Lopez-Hilfiker et al. Citation2014; Dzepina et al. Citation2015; Gkatzelis et al. Citation2017), fully molecular-resolved online quantification of aerosol organic content has not been attained.
A detailed description of the AMS and its working principles can be found in the review article by Canagaratna et al (Citation2007). Briefly, particles suspended in air are sampled through an aerodynamic lens and focused into a narrow beam that impacts a resistively heated (ca. 600°C) vaporizer where the non-refractory particle species are vaporized. The vapors are subsequently ionized with a 70 eV electron beam and the ions are extracted into a mass spectrometer to be analyzed (Jayne et al. Citation2000; Jimenez et al. Citation2003; Canagaratna et al. Citation2007). The mass concentration of any given species, CS, in units of µg m−3, can be obtained from the measured mass spectral signals as follows:[1]
where MWS is the molecular weight of the species in question in g mol−1; IS,i corresponds to the ion rate (in ions s−1) of each ion, i, from species S; NA is Avogadro's number; Q is the volumetric sample flow rate into the instrument in cm3 s−1, IES is the species-dependent ionization efficiency (in ions molecule−1) and the 1012 factor is needed for unit conversion (so that Cs is in units of μg m−3).
IES reflects the number of ions detected per sampled number of molecules of species S (Canagaratna et al. Citation2007). A related mass specific ionization efficiency in which the detected number of ions is normalized by the input mass rather than input number of molecules can also be used to characterize the detection efficiency (Ng et al. Citation2011; Onasch et al. Citation2012). AMS IES reflect the net efficiency of the entire vaporization, ionization, and ion detection processes. Thus, in addition to the ionization process itself, IES values also reflect other aspects of the detection system including: (Equation1[1] ) vaporization and thermal decomposition of parent molecules on the 600°C vaporizer to yield products in the vapor phase that often differ in molecular identity from their parents (Canagaratna et al. Citation2015), (Equation2
[2] ) adsorption/desorption of the thermally vaporized species on the ionizer surfaces (Drewnick et al. Citation2015), and (Equation3
[3] ) ion transmission efficiency of the ion optics and mass spectrometer, as well as the detection efficiency of the electron multiplier or microchannel plate detector (Jimenez et al. Citation2003). Since the efficiency of the AMS detection scheme is influenced by several processes besides ionization alone, IES is obtained from empirical calibrations rather than explicit theoretical models (Canagaratna et al. Citation2007; Jimenez et al. Citation2016). In addition, for ease of operation and communication IES/MWS is expressed in terms of the corresponding properties of a primary calibrant (NH4NO3: AN) and a species-dependent relative ionization efficiency (RIES), which accounts for relative differences in the detection efficiencies between the species S and nitrate as follows:
[2]
It is useful to note that Equation (Equation2[2] ) differs slightly from Equation (Equation3
[3] ) in Canagaratna et al. (Citation2007) because it uses RIENO3 to account for the fact that in practice, IENO3 calibrations only monitor the NO+ and NO2+ ions.
The use of a primary calibrant allows signals measured at all m/xz to be converted to “nitrate-equivalent” mass concentrations (when using RIES = RIENO3) or speciated mass concentrations (using RIES values that correspond to the different species). RIES values for species such as NH4, NO3, and SO4 are obtained from laboratory and field calibrations using size-selected NH4NO3, (NH4)2SO4 (AS) (Hogrefe et al. Citation2004; Canagaratna et al. Citation2007; Ng et al. Citation2011) or mixed ammonium sulfate/nitrate particles (Xu et al. Citation2017). Similar RIES calibrations can also be performed using single-component organic aerosols (Slowik et al. Citation2004; Dzepina et al. Citation2007; Jimenez et al. Citation2016; Robinson et al. Citation2017), with an average RIEOA value of 1.4 being obtained from several commercially available surrogates of ambient oxidized OA constituents. The 2σ uncertainty of RIEOA as applied to ambient OA was estimated to be ±20% (Bahreini et al. Citation2009).
In addition to the efficiency of the ionization/detection process, previous studies have shown that the signal measured by the AMS can also be impacted by the efficiencies with which particles are sampled into the AMS and reach the AMS vaporizer, and by particle bounce without vaporization at the vaporizer (collection efficiency, CES). Thus, Equation (Equation1[1] ) is modified as follows:
[3]
CES = EL × ES × EB, where the three terms represent the transmission efficiency of the aerodynamic lens for spherical particles (EL), the efficiency with which non-spherical particles reach the vaporizer relative to spherical particles of the same aerodynamic diameter (ES), and the efficiency with which particles vaporize (vs. bounce) when they impact the vaporizer (EB) during the timescale of MS mode measurements (typically several seconds), respectively (Huffman et al. Citation2005). The effect of ES on CES is typically minor for ambient particles although it can be major for some pure standards and soot-containing particles (Huffman et al. Citation2005; Salcedo et al. Citation2007). Previous measurements have shown that in the standard lens, submicron particles in the size range of 100–550 nm vacuum aerodynamic diameter (dva) are measured with 100% transmission efficiency, with reduced transmission for smaller and larger particles (Liu et al. Citation2007; Hu et al. Citation2017b). The geometry of the lens has also been modified for transmitting supermicron particles (Williams et al. Citation2013; Peck et al. Citation2016; Xu et al. Citation2017), enabling measurement of non-refractory (NR) PM2.5 in the atmosphere (Peck et al. Citation2016; Xu et al. Citation2017). Particles that reach the vaporizer, can bounce without detection (EB term). Liquid particles do not bounce on the standard vaporizer while some solid particles do (Matthew et al. Citation2008). For ambient particles, bounce is the most significant term controlling the overall CES. A composition-dependent collection efficiency (CDCE) parameterization has been derived for ambient particles to reflect the observed changes in CE with variations in ammonium nitrate (NH4NO3) fraction and ammonium sulfate acidity (Middlebrook et al. Citation2011). We note that 300 nm NH4NO3 particles are chosen as the primary calibration source for AMS IES because they have a CES value of unity and do not leave a residue in the vaporizer that could produce a background signal. Laboratory and ambient inorganic-containing particles show qualitatively similar trends with respect to the effect of chemical composition on CE values (Matthew et al. Citation2008; Middlebrook et al. Citation2011). Substantial impacts of OA composition on CE have been observed in the laboratory (Bahreini et al. Citation2005; Docherty et al. Citation2012; Robinson et al. Citation2017). However, no clear effect of ambient OA fractions or types on CE has been established (Middlebrook et al. Citation2011).
The variation of RIEOA values with chemical composition is not well known. RIEOA calibrations for different functionalities and oxidation levels are of particular interest since they could change due to variations in intrinsic molecular electron impact ionization cross-sections (Jimenez et al. Citation2003), thermal decomposition (Canagaratna et al. Citation2015), transit times within the ionization region (Murphy Citation2016a), interaction with ionizer surfaces, and other factors. Difficulties in RIEOA calibrations performed so far include the fact that input mass concentrations calculated from size-selected particle number concentrations have uncertainties due to the assumed particle shape and density values. Moreover, measured AMS OA mass concentrations depend not only on RIEOA but on its product with CEOA which, unlike for NH4NO3, is not unity for many OA species (Bahreini et al. Citation2005; Docherty et al. Citation2012; Robinson et al. Citation2017).
This work introduces a new calibration protocol designed to reduce the uncertainties associated with the input sample mass concentrations. A key aspect of this method is the use of a Centrifugal Particle Mass Analyzer (CPMA; Olfert and Collings Citation2005) for mass selection. Calibration particles are mobility-selected with a DMA and then mass-selected with a CPMA to provide unambiguous and more accurate control of the aerosol mass concentrations that are sampled into the AMS. This study also utilizes direct measurement of CEOA values as well as the use of a capture vaporizer with CE ∼ 1 for ambient aerosols to deconvolute CEOA and RIEOA from each other. While the equipment used for the new calibration protocol is not available to all AMS users, the general trends observed here should still be applicable to all AMS instruments. Previous work on RIEOA calibration (Slowik et al. Citation2004; Dzepina et al. Citation2007; Jimenez et al. Citation2016) is extended to include organic molecules with a wide range of carbon oxidation states (OSC). Mixed organic/inorganic particles and SOA particles generated from α-pinene, naphthalene, dodecane, and squalane are also measured. The degree to which measured RIES can be predicted with theoretical models of the ionization process is explored. Sources of variability in the measured RIEOA values are investigated. Implications of these measurements for ambient OA measurements are also discussed.
2. Experimental and computational methods
2.1. Experimental measurement of RIES
In general, RIES calibrations involve sampling a known input sample mass concentration of the calibrant (Min) with the AMS. The AMS is alternated between the operating modes that allow for measuring ensemble mass concentrations (MS mode) and particle time-of-flight (PToF mode). The ratio between the nitrate-equivalent mass measured with the AMS in the MS mode and the known input mass concentration equals the product of RIES and CES as follows:[4]
Equation (Equation4[4] ) shows that in addition to CES, the RIES calibration requires knowledge of the calibrated IENO3 value. Nitrate calibrations are typically performed just before RIES calibrations. RIES can be directly determined when CES is also measured during the calibrations.
Known mass concentrations of single component aerosols composed of selected multifunctional organic molecules were generated from aqueous solutions using either a constant output atomizer (Aerosol generator 3076, TSI, Shoreview, MN, USA) or a custom-built evaporation-condensation generator (Sinclair and La Mer Citation1949), in which supersaturated vapor was created by heating liquid in a flask, subsequently cooling to form ultrafine particles. For mixed organic and nitrate particles, atomization was performed using solutions with known organic to NH4NO3 mass concentration ratios ranging from 0.84 to 2.21. SOA particles were generated from O3 or OH radical oxidation of gas-phase precursors (α-pinene, dodecane, naphthalene) continuously injected into a Potential Aerosol Mass (PAM) oxidation flow reactor (Kang et al. Citation2007; Lambe et al. Citation2011a). Oxidized squalane particles were generated via heterogenous oxidation of squalane particles in the PAM reactor. Oxidation states for the SOA were obtained from HR-ToF-AMS spectra, which were simultaneously measured using an HR-ToF-AMS with standard vaporizer installed, and analyzed using the parameterization in Canagaratna et al. (Citation2015).
Calibration aerosols were mobility-selected by a differential mobility analyzer (DMA 3081, TSI) (usually 300 or 350 nm mobility diameter) and subsequently mass-selected by a centrifugal particle mass analyzer (CPMA, Cambustion) (Olfert and Collings Citation2005). Since a CPMA was utilized after the DMA, input particle number concentrations were lower than those used in typical calibrations. Thus, the particle size used was chosen so that we could ensure 100% transmission through lens while still maximizing particle number concentrations to reduce the impact of statistical noise in the results. The CPMA avoids the problems associated with multiply charged particles since it selects based on mass per particle. Aerosol number concentrations were measured with an ultrafine condensation particle counter (UCPC 3776, TSI). The combined use of size and mass selection removes multiply charged particles that exit the DMA and allows for direct measurements of the single particle mass (MSPS). The input aerosol mass concentration is obtained as follows:[5] where NCPC (m−3) is the particle number concentration measured by UCPC and MSPS (µg) is the single particle mass.
The CE measurements in this study were obtained with the AMS PToF mode which allows for counting of individual particles. The quadrupole AMS (Q-AMS) used during the measurements was equipped with a light scattering (LS) module (Cross et al. Citation2009). Since the light scattering module counts individual particles just before they impact on the AMS vaporizer, it is used to confirm that EL and CES are close to 1 for the calibrant particles and that the particle concentrations reaching the AMS vaporizer can be compared with those reaching the CPC (CPCS). The number of particles that fully vaporize to yield single particle ions signal is further measured by monitoring the number of events in which the ion signal measured in the particle time-of-flight operating mode exceeds a threshold signal value. The ratio between the number of particles measured with the AMS and the number of particles counted by the condensational particle counter (CPC) provide a direct measure of CE as follows:[6] where N(PToF) and NCPC are the particle number concentrations determined from the particle numbers counted by the AMS and by the CPC, respectively. It is useful to note that some particles that are not counted in PToF mode due to slow or partial vaporization may contribute to observed MS mode signal and to measurement uncertainty in CE.
As shown below, CEOA values measured for most species on the standard vaporizer (SV) are less than 1 and the uncertainty in CEOA measurements directly propagates into the uncertainty of the measured RIES. A capture vaporizer (CV) has been recently developed with the goal of CES ∼ 1, and it shows improved CE for laboratory particles (Hu et al. Citation2017b; Xu et al. Citation2017) and CE ∼ 1 for ambient particles (Hu et al. Citation2017a). We utilize a CV to examine how RIEOA values vary when CEOA variation is minimized. CV RIEOA values are calculated assuming a CEOA of 1. This assumption is based on the fact that the CV used in this study has a CE(NH4)2SO4 of 0.88 (Xu et al. Citation2017) and the organics studied here have higher SV CEOA values than laboratory ammonium sulfate particles. The standard AMS fragmentation table (Allan et al. Citation2004; Aiken et al. Citation2008) was utilized to calculate RIEOA for both vaporizers. It is useful to note that while the variability observed with the CV and SV may be qualitatively similar, differences in extent of thermal decomposition of vaporized species and in the extent of ion fragmentation (due to differences in thermal energy distributions) may lead to quantitative differences in the RIES measured with the two vaporizers.
2.2. Computational methods for theoretical estimation of RIES
Theoretical RIES values (shown in ) were obtained from calculated gas phase electron ionization (EI) cross-sections as follows:[7]
Table 1. Experimental and theoretical RIES values obtained for organic and inorganic species. BEB calculations of 70 eV EI cross-sections (energy-dependent EI cross-section is shown in Figure S1) are also shown. HNO3 (MW = 63 g mol−1) is chosen as reference with cross-section at 70 eV of 4.764 Å2. RIE1" and RIE2 are estimated with and without transit time effect according to Equations (Equation11a[11a] ) and (Equation11b
[11b] ), respectively. Experimentally determined RIEs were measured with a capture vaporizer (RIECV) and standard vaporizer (RIESV). RIESV from early unpublished experiments (P. Silva, Aerodyne Research and Boston College) are shown. Values in parenthesis are 1σ standard errors of the means of repeat measurement.
IE is the probability of a molecule being ionized when passing through the electron beam; σ is the EI ionization cross-section (m2), a molecular property of the analyte that varies with electron energy; lm is the width (m) of the electron beam; vm is the velocity of the molecule (m s−1); ve (ve >> vm) is the velocity of the electrons (m s−1); ne is the density of electrons in the electron beam (m−3); Je is the flux of electrons (m−2 s−1), and tm is the residence time of the molecule in the electron beam. For a given ionization source, Je is fixed, only σ and tm vary with the molecular properties. The value of tm varies with the molecular weight of the gas phase component that is undergoing ionization and σ is estimated theoretically using the Binary-Encounter-Bethe (BEB) model (Hwang et al. Citation1996) as briefly described below.
The total EI ionization cross-section of a molecule is the summation of the cross-section of each individual occupied molecular orbital. According to the BEB model, the cross-section of a molecular orbital can be estimated with Equation (Equation8[8] ) (Hwang et al. Citation1996),
[8] where t = T/B, u = U/B, S = 4πa02NR2/B2, a0 is the Bohr radius and equal to 0.5292 Å, R is the Rydberg constant and equal to 13.61 eV, T is the kinetic energy of the impacting electron (here, 70 eV), B is the binding energy of the electron in that molecular orbital, U is the kinetic energy of the electron in that molecular orbital, N is the occupancy number and can be either 2 or 1 for occupied or partially occupied molecular orbitals, respectively.
The values of U and B are calculated using an ab initio quantum chemistry software package. For the selected organic molecules, the geometries were optimized and energies were calculated at the Restricted Hartree Fock (RHF) level of theory with the 6–311G basis set using the GAMESS computational chemistry package (Schmidt et al. Citation1993; Gordon and Schmidt Citation2005). The B values were calculated via Koopmans’ theorem (1934) and U values were calculated using kinetic 1-electron integrals which were extracted from the GAMESS output using a python script (supporting info). From T, B, U, and N, the cross-section of individual molecular orbitals were obtained and used to calculate the total ionization cross-section.
The theoretical ratio of the IEs of two species X and S in a given ionization source is equal to the product of the ratio of their electron impact cross-sections as calculated from Equation (Equation8[8] ) and the ratio of their residence times (tX and tS) in the electron beam:
[9]
The residence time (tX or tS) of a molecule in the ionization region is inversely proportional to the thermal velocity (v) of the molecule, which is inversely proportional to the square root of the translational temperature and MW and can be expressed as (Murphy Citation2016a; Citation2016b):[10]
For comparison with AMS RIE values (Equation (Equation2[2] )), if the translational temperature of both species is assumed to be the same (which is questionable; Jimenez et al. Citation2016) and gas phase HNO3 is substituted for species S in Equation (Equation9
[9] ), a theoretical prediction of RIEX can be obtained considering the residence time effect (Equation (Equation11a
[11a] )) or ignoring it (Equation (Equation11b
[11b] )) as follows:
[11a]
[11b]
We note that in these calculations the parent MW is assumed for species X in order to obtain reference theoretical values for the extreme case where only gas phase velocity and ionization of parent molecules matter. Differences between measured values and theoretical values calculated in this way provide information on the importance of processes like thermal decomposition, different translational temperatures, or other effects to the AMS detection process.
3. Results and discussion
3.1. RIE calibrations with standard vaporizer
shows both data collected from this study during RIE calibrations of selected organic standards and data from previous laboratory work for a subset of the same organic standards (Jimenez et al. Citation2016). A list of the species measured during the laboratory experiments is shown in . The RIE × CE values are calculated according to Equation (Equation4[4] ) and CE is calculated according to Equation (Equation6
[6] ). The solid line shows a slope of 1.4 corresponding to the average RIEOA derived from the previous work (also shown in a different form by Jimenez et al. Citation2016). Many of the measured RIE values in this study fall within a ± 20% range of 1.4, but some, such as squalane (see Section 3.3 for more discussion), are significantly higher. The measured RIE values from this current study are also systematically higher than the earlier measurements. As discussed in Section 2.1, the calibration protocol in this work utilizes size and mass-selection of the input aerosol particles. The early laboratory measurements, however, were conducted with size-selection alone and the input aerosol mass was calculated with assumptions about particle density and shape. Moreover, the measured particle number and AMS mass concentrations may have had non-negligible contributions from multiply charged particles of larger sizes but equivalent electrical mobilities exiting the DMA. While the data were corrected to account for multiply-charged particles by estimating the fraction of mass in the AMS size distributions that was observed in the size region corresponding to the larger multiply charged particles, for many of the organic particles the peak in the size distributions of multiply charged particles coincided with measured mass from singly charged particles that had delayed vaporization due to particle bounce (Cross et al. Citation2007). Thus, this correction may have been overestimated and could have resulted in systematically lower RIE values and underestimated error bars for the earlier calibrations.
Figure 1. Standard vaporizer measurements of RIE × CE (measured AMS mass loading/input mass loading) vs. CE (particle counts with MS/particle counts from CPC) for the organic species in . Error bars are calculated as the variability (std. dev.) of independent measurements.
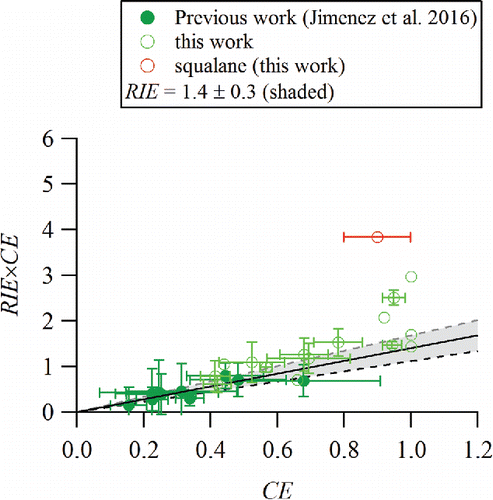
shows that the laboratory particles have a large range of CE values. The slight curvature of the plot in at higher CE values suggests that particles that bounce less may be vaporized and detected more efficiently than those that bounce more. This observation is consistent with recent AMS measurements which utilized light scattering to examine the RIEs of single α-pinene SOA particles that undergo prompt and delayed vaporization (Robinson et al. Citation2017). The Robinson et al. (Citation2017) measurements showed that while the average RIEs of all α-pinene SOA particles was approximately 1.4, the particles with prompt vaporization (i.e., the particles that do not bounce) had a higher effective RIEs than those that were delayed (i.e., particles that bounce).
3.2. RIE calibrations with mixed aerosols
Since RIE is defined as the IE of the species of interest relative to IE of NO3 (as measured by the sum of m/z 30 and m/z 46, see Equation (Equation2[2] ) above), it is desirable to perform the calibrations with NH4NO3 as an internal standard (i.e., with particles that contain internally mixed NH4NO3 and the species of interest). The feasibility of this calibration approach was tested by performing calibrations with binary aerosol particles, consisting of internal mixtures of NH4NO3 with other inorganic and organic species that were generated by atomizing solutions containing known fractions of each species. Since both the nitrate and calibrant species are internally mixed within the same particles (as expected by their generation from atomizing an mixed solution, and indicated by their identical size distributions from PToF mode measurements) and should be affected to the same degree by particle bounce, this method of RIE is not subject to uncertainties associated with CE or multiply charged particles.
3.2.1. Mixtures of inorganics
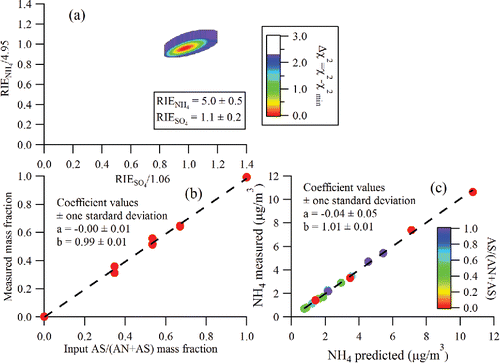
Previously, Xu et al. (Citation2017) showed that NH4 and SO4 RIE values measured from mixed AN and AS particles on a capture vaporizer agreed well with those obtained from pure particles. Here, we investigate whether the same behavior is observed for the standard vaporizer, where the mixed particles are known to have CE values ranging from 0.2 to 1.0 for AS/(AN+AS) mixture ratios in the range of 0 to 1.0 (Matthew et al. Citation2008). shows results from RIE calibrations with mixed AN and AS particles containing five different AS mass fractions, including 0, 0.35, 0.53, 0.67, and 1. A Δχ2 (see Xu et al. Citation2017, Equation (Equation7[7] )) least-square fitting procedure (Press et al. Citation1992) is used to find the combination of RIENH4 and RIESO4 values needed to best match the measured AS mass fraction and NH4 concentrations with their known values as shown in and , respectively (Xu et al. Citation2017). shows that the Δχ2 is minimized when RIE values of 1.1 ± 0.2 and 5.0 ± 0.5 are applied for SO4 and NH4, respectively. and confirm that the AS mass fractions and the NH4 mass concentrations determined using the fitted RIE values reproduce the known values in the input aerosol particles very well without any apparent matrix-dependent biases related to varying particle composition or varying CE. This is consistent with previous ambient aerosol observations of matrix-independent detection efficiencies (Jimenez et al. Citation2016) and further validates the use of matrix-independent RIE values for standard vaporizer measurements of NH4, NO3, and SO4 mass concentrations. The fact that the same RIENH4 value can be used to obtain accurate NH4 mass concentrations from both pure NH4NO3 as well as (NH4)2SO4, as well as mixtures of the two in variable proportions, is also consistent with the idea that both species thermally decompose to produce NH3 vapor which is then ionized and detected (Jimenez et al. Citation2016; Hu et al. Citation2017b; Xu et al. Citation2017).
Figure 2. Results from RIE calibrations performed on a standard vaporizer with a range of mixed NH4NO3 (AN)/(NH4)2SO4 (AS) particles of known compositions. (a) The best-fit values of RIENH4 and RIESO4 are obtained by minimizing the Δχ2 value. A Δχ2 value of 2.3 denotes the range of RIE values for 1σ uncertainties. (b) Measured AS / (AS + AN) mass fraction vs. input mass fraction in the atomizer solution. (c) Measured NH4 mass concentration vs. predicted NH4 mass concentration based on known particle composition.
3.2.2. Mixtures of organics and NH4NO3
Laboratory RIE measurements of particles containing binary mixtures of organic and inorganic species have not been previously reported to our knowledge. Here, we present studies of mixed particles where the organic component consisted of an organic acid (adipic acid, azelaic acid, citric acid, malonic acid, succinic acid, or tartaric acid) or an alcohol (levoglucosan, sucrose, or xylitol) measured on a standard vaporizer. In these experiments, the mass-selected mixed nitrate and organic particles are assumed to have the same mass ratios of organic and nitrate as the solution of known composition that was atomized. compares the RIEs derived from solution mixtures with those derived from pure compounds on the capture vaporizer (see Section 3.3). The binary nitrate and alcohol particles vs. nitrate and acid particles show different behavior. The nitrate and alcohol particles yield organic RIEs similar to the corresponding pure organic particles and NH4 RIEs (4.8 ± 0.8) that are consistent with those measured for NH4NO3 (5.0 ± 0.5). The nitrate and acid particles, on the other hand, yield RIE values for both the organic and NH4 moieties that are higher than those observed from the pure organic and pure NH4NO3 particles, respectively (). Since RIE values are defined relative to the ionization efficiency of nitrate, high apparent RIE values for both of these species could be observed if the nitrate content of the mixed organic acid and NH4NO3 particles is lower than expected based on the solution that was atomized, possibly due to a double displacement reaction in which HNO3 gas evolves from the particles as follows:[R1]
Figure 3. Results from RIE calibrations with pure organic particles (acids or alcohols) and internally mixed binary particles containing known amounts of organics and NH4NO3 (AN). Measurements were performed on a capture vaporizer (CV). (a) Comparison between the organic RIE values derived from the internally mixed binary particles and the pure organic particles. Data obtained from particles containing organic acids are colored red while those from alcohols are colored blue. (b) RIENH4 values derived from the mixed and pure particles are shown for the various organic species (species abbreviations are in ).
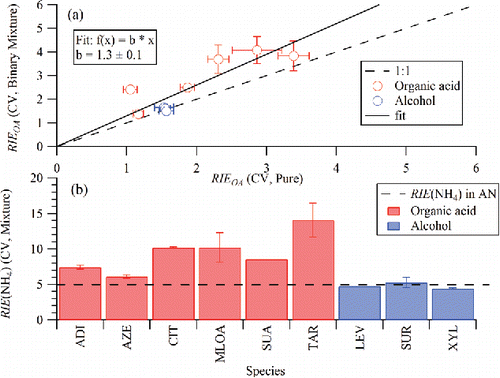
Indeed, a direct ratio of measured organic to NH4 mass loading, calculated using RIE values of organic and NH4 from pure organic and NH4NO3 aerosol, respectively, is not equal to the expected ratio for the input binary aerosol composition. These observations suggest that care must be taken when calibrating with new mixtures of organic and NH4NO3 particles to test that the measured RIEOA value determined from the mixture matches that of the organic on its own. However, mixtures of the alcohols examined here (levoglucosan, sucrose, or xylitol) and NH4NO3 could potentially provide a direct and simple method for routine calibration and monitoring of RIEOA.
3.3. Comparisons between RIE measurements and model predictions
AMS detection efficiency is affected by multiple processes including thermal decomposition of parent molecules, adsorption/desorption of vaporized species from vaporizer/ionizer surfaces with different materials and temperatures, electron ionization, molecular flight in the ionizer, and actual translational temperature of the evaporated molecules. If electron ionization and molecular flight were the dominant process and other contributing processes were negligible, theoretical calculations of ionization cross-sections could be utilized to examine expected trends for measured IE and RIE values. Within this context, it is useful to compare measured IE and RIE values with their theoretical predictions.
As shown in Equation (Equation7[7] ), the theoretical IE predictions used here account for contributions from EI ionization cross-sections and ionizer transit times of the vaporized molecules (Murphy Citation2016a). Jimenez et al. (Citation2003) previously showed that gas phase EI ionization cross-sections are linearly correlated with molecular weight (MW) of the parent molecule. shows new theoretical EI ionization cross-section predictions for the organic molecules examined during this study, along with the values reported by Jimenez et al. (Citation2003). To test the validity of the new calculations for the selected organics, we compared our calculated cross-sections for several organic species with those from the literature (Flaim and Ownby Citation1971; Bartmess and Georgiadis Citation1983; Jimenez et al. Citation2003; NIST Citation2017). The comparison shows () that our calculations are consistent with the measurements to within 25%, except chloroform (34%) which contains three heteroatoms. This is reasonable agreement, considering the uncertainties of ∼15% in the experimental results (NIST Citation2017). In , the organic data points are colored according to approximate carbon oxidation state (OSC = 2 × O:C – H:C; Kroll et al. Citation2011) while inorganic data points are shown as black markers. The lines in the figure show the distinct slopes identified by Jimenez et al. (Citation2003) for inorganic, oxidized organic, and hydrocarbon species. Inorganic data points, including HNO3, fall along the lowest slope. Oxidized organic species lie along the intermediate slope and hydrocarbon species fall along the highest slope. Since many of the small organic molecules examined in the Jimenez et al. (Citation2003) publication were hydrocarbons, they are found on the line with the highest slope while many of the oxidized organics examined in this study are clustered between the intermediate and lowest slopes. Taken together, the scatter in the organic molecule data points between the three slopes indicates the intrinsic variability in ionization cross-sections of organic molecules with oxidation state.
Figure 4. Theoretical predictions of electron ionization cross-sections for selected organics as a function of parent molecular weight. New values calculated for the organic species examined in this study are shown along with values originally compiled together in the work by Jimenez et al. (Citation2003). The lines in the graph are shown for reference and correspond to distinctive slopes identified in Jimenez et al. (Citation2003) for inorganics (H2O, CO, CO2, NH3, HNO3, and H2SO4), oxidized organics, and hydrocarbons. The value of X is 8.99 × 10⁻² (Å2/(g mol−1)). The organic data points are colored according to approximate carbon oxidation state (OSC = 2 × O:C – H:C; Kroll et al. Citation2011) while inorganic data points are shown as black markers.
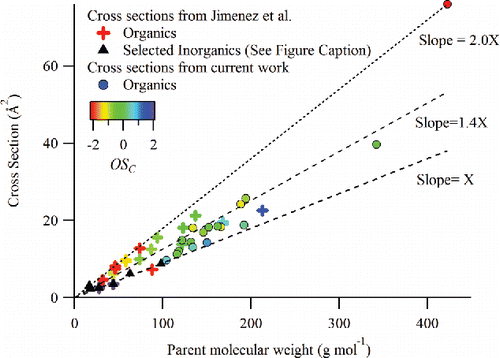
Table 2. Comparison of theoretically predicted electron impact ionization cross-sections for selected organic molecules from this work and experimental measurements of their ionization gauge relative response factors (Flaim and Ownby Citation1971; Jimenez et al. Citation2003).
compares measured RIEOA on capture vaporizer with theoretically estimated RIEOA (Equations (Equation11a[11a] ) and (Equation11b
[11b] ). In Equation (Equation11b
[11b] ), variations in RIES depend only on EI cross-sections while Equation (Equation11a
[11a] ) also accounts for an
dependence in RIES due to differences in molecular-weight dependent transit times through the ionizer region (Murphy Citation2016a). The transit time effect in AMS measurements is expected to be smaller than predicted for many organic species, however, because most parent molecules thermally decompose on the AMS vaporizer to form vapor species with smaller MW (Canagaratna et al. Citation2015). Neither of the two types of theoretically estimated RIES values correlate well with the experimental measurements in . This lack of correlation provides evidence that additional processes other than ionization and flight time have a significant impact on the measured RIES values and underscores the difficulty of accurately capturing the complexity of the AMS sampling, vaporization, and ionization processes within a theoretical modeling framework.
Figure 5. Comparison of RIEs measured on capture vaporizer and theoretical estimates of RIEs using Equations (Equation11a[11a] ) and (Equation11b
[11b] ). The theoretical estimates account for only the gas phase ionization process as opposed to the real physical phenomena which also includes thermal decomposition.
![Figure 5. Comparison of RIEs measured on capture vaporizer and theoretical estimates of RIEs using Equations (Equation11a[11a] ) and (Equation11b[11b] ). The theoretical estimates account for only the gas phase ionization process as opposed to the real physical phenomena which also includes thermal decomposition.](/cms/asset/557362c2-1a49-4068-9435-3247f9d13b5b/uast_a_1439570_f0005_oc.gif)
3.4. Variability in organic RIE with 
As discussed above, AMS RIEOA cannot be easily predicted from theory and it is not feasible to perform calibrations for all the individual species that make up multi-component OA mixtures. Thus, there is a need for empirical parameterization of RIEOA over a range of OA compositions. The average carbon oxidation state is a useful metric for describing the evolving chemical compositions of complex OA, and shows that ionization cross-sections show a dependence on . Thus, here we investigate the variability in experimentally measured RIEOA values with
. This variability is of interest for interpreting concentration trends in ambient data and laboratory experiments that involve oxidative aging of organic species and for developing composition-dependent RIEOA parameterizations for ambient measurements.
shows the experimentally measured RIEOA values as a function of for a range of organic particles including pure-component particles and SOA particles generated in the PAM reactor. Standard and capture vaporizer data are shown in the figure. CV measurements have the advantage of reduced uncertainty from variable CE and are utilized to verify the relationship between RIEOA and
that is observed with the SV. Oxidation states for the SOA were obtained from HR-ToF-AMS spectra, which were simultaneously measured using an HR-ToF-AMS with standard vaporizer installed, and analyzed using the parameterization in Canagaratna et al. (Citation2015). The standard AMS fragmentation table for organic species (Allan et al. Citation2004; Aiken et al. Citation2008) was utilized to calculate RIEs for both vaporizers. Quantitative differences in the RIEOA measured with the two vaporizers are likely due to enhanced fragmentation in the CV that is not accounted for in the standard fragmentation table (Hu et al. Citation2017a,Citationb,Citationc; Xu et al. Citation2017). Despite these differences and species to species variability in , both vaporizers show a similar overall relationship between RIEOA and
.
Figure 6. RIE of selected organic standards and SOAs measured during this work on both capture (CV) and standard (SV) vaporizers as a function of their average oxidation state of carbon (. A standard organic fragmentation table is used to analyze both sets of data. The figure also shows the range of
values that typically correspond to different ambient organic aerosol components (Canagaratna et al. Citation2015) including HOA (hydrocarbon-like organic aerosol), COA (cooking organic aerosol), BBOA (Biomass burning organic aerosol), OOA (oxidized organic aerosol). The
of PAM SOAs were obtained by simultaneously sampling with another HR-ToF-AMS installed with a standard vaporizer. Measurements made at the University of Colorado (CU measurement) for Squalane, Oleic Acid, and DOS are also shown. These measurements and the DOS measurements at Aerodyne Research utilized a DMA but did not utilize a CPMA, which was not available to the groups at that time. Since the examined particles were liquid, CE was assumed to be 1.
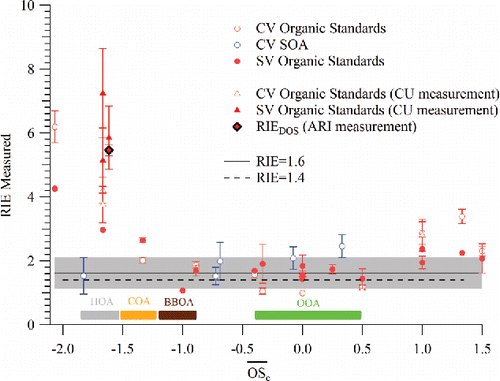
Overall, the data points in show significant species-to-species variability in RIEOA with . The highest RIEOA values are found for reduced hydrocarbons with
<−1.5 and a more constant average RIEOA is observed over the
range of −1.0<
< 0.5. The measured differences in RIEOA between reduced and oxidized species is much larger than expected based on theoretically predicted EI cross-section (). Larger RIEOA are also observed for organic molecules with
. Some, but not all, of the increase in RIEOA for species with higher
may be due to the fact that the default fragmentation table over-predicts the CO+/CO2+ ion ratio for these species (Canagaratna et al. Citation2015). Direct measurements of this ratio were not possible during this study due to experimental difficulties with generating size and mass-selected particles in Ar. The observed scatter for species of similar
, as well as the deviations at the extreme values of
, highlight the importance of performing RIEOA calibrations when calculating OA mass concentrations from laboratory measurements that utilize single or a small number of organic species. This variation in RIEOA with
will also need to be accounted for when deriving mass trends in laboratory OA oxidation experiments using the OA/SO4 ratio method (Jimenez et al. Citation2016). The species-to-species variability in RIEOA observed in is expected to be lower for ambient OA due to averaging over hundreds of individual species.
The laboratory observations in span the typical ranges observed for ambient primary organic aerosol (POA) and secondary organic aerosol (SOA) constituents. The laboratory observations indicate that for ambient species with average carbon oxidation states between −1 and 0.5 it is reasonable to use a single average RIEOA value to calculate ambient OA mass concentrations; most ambient OA species, including biomass burning organic aerosol and oxidized organic aerosol which dominate OA mass (especially outside of urban areas), fall within this
range. The average RIEOA value of 1.6 ± 0.5(2σ) determined in this experimental study for this
region is 14% higher than the typical RIEOA value of 1.4 ± 0.3 (Canagaratna et al. Citation2007; Bahreini et al. Citation2009) that is currently used for calculating ambient OA concentrations from AMS spectra, but both values agree within the estimated measurement uncertainties. suggests that the mass concentrations of POA components such as hydrocarbon-like organic aerosol (HOA,
< −1.5) may be overestimated by a factor of 3 to 5 if the default RIEOA value is used. However, deviations as large as those suggested by have not been observed in the field, with estimated positive biases being of the order of x1.2–1.5 for “pure HOA” (Docherty et al. Citation2011; Jimenez et al. Citation2016). It is possible that the RIE of real atmospheric HOA is not as high as suggested by . It is also possible that an overestimation arising from higher RIEHOA may be partially compensated by reduced collection efficiency for HOA particles, as (Equation1
[1] ) freshly emitted particles often fall into a size range (vacuum aerodynamic diameter <100 nm) where the aerodynamic lens has limited transmission efficiency (Liu et al. Citation2007); (Equation2
[2] ) HOA is often present on soot-containing particles that are non-spherical and are also collected less efficiently. POA components such as HOA and COA are typically a small fraction of ambient OA, especially in rural and remote regions (Jimenez et al. Citation2009). If their detection efficiency was higher than assumed, that would further reduce their concentration and importance.
For ambient OA, which is dominated by oxidized organic species, concentrations reported with either the laboratory average RIEOA value of 1.6 or the typical ambient RIEOA value of 1.4 will agree within the ±38% (2σ) total uncertainty that is quoted for OA mass concentrations (Bahreini et al. Citation2009). Thus, the large errors that had been suggested for total OA in ambient environments (which is dominated by more oxidized species, e.g., Jimenez et al., Citation2009; Canagaratna et al., Citation2015) from a theoretical model (Murphy Citation2016a) are not expected based on our results. This is consistent with a later clarification by the same author (Murphy Citation2016b). It is difficult, however, to obtain more definitive ambient RIEOA values from laboratory measurements due to the fact that laboratory particles do not perfectly mimic ambient OA composition, phase states, or CE. Thus, direct measurements of ambient OA are needed for obtaining further detailed constraints on how ambient RIEOA values vary with environment and composition. When detailed instrument intercomparisons of ambient measurements are possible, we recommend that individual users evaluate the evidence to determine the RIEOA value that is most appropriate for the sampled OA. For example, constraints on ambient RIEOA values can be obtained from hygroscopicity closure studies which utilize the relative mass fractions and hygroscopic parameters (κ) of inorganic and organic species to model measured aerosol growth factors under subsaturated conditions (Gysel et al. Citation2007; Petters and Kreidenweis Citation2007). As described in Jimenez et al. (Citation2016), hygroscopicity closure analyses have been previously performed on highly oxidized OA observed in rural and remote sites. In these closure analyses, OA mass fractions calculated using RIEOA of 1.4 yield κOA ∼ 0.11. Previous laboratory and field studies of oxidized OA indicate that κOA is between 0.05 and 0.3, with an expected value of κOA ∼ 0.11 for the sources and oxidation levels in the field studies cited in Jimenez et al. (Citation2016) (Gunthe et al. Citation2009; Lambe et al. Citation2011b; Cheung et al. Citation2015; Brock et al. Citation2016; Petters et al. Citation2016). While the κOA values obtained from the closure studies with the RIEOA of 1.4 agree well with this expected value, the closure studies would yield a κOA around 0.03 for the same ambient locations if an RIEOA of 1.6 was used. The uncertainty in the field determination of κOA for these studies is estimated as 0.018 (Mei et al. Citation2013), giving an upper limit of kOA ∼ 0.05 for RIEOA = 1.6, which is significantly lower than the expected value of kOA ∼ 0.11. This indicates that hygroscopicity measurements provide a useful constraint for this analysis. These results suggest that RIEOA is smaller than 1.6 in these rural/remote environments. Other ambient intercomparisons between AMS measurements and instruments are also recommended (Bahreini et al. Citation2009; Middlebrook et al. Citation2011; Jimenez et al. Citation2016). Field studies with variable HOA fractions that reach high levels (>50%) and have multiple collocated high-quality measurements (PM1 thermal/optical OC, SMPS, light scattering or extinction, hygroscopicity), for example, may be well suited to investigate the RIEOA of reduced ambient OA. Laboratory studies with realistic sources of HOA and COA may also be useful toward this goal. It is useful to note within this context that care must also be taken to evaluate the RIEOA of species such as amines that are significantly different from the calibrant species and may be important in selected ambient environments (Silva et al. Citation2008). We recommend that AMS users document all RIE values that are used to derive species-resolved AMS mass concentrations in order to facilitate comparison of results in the future.
4. Conclusions
This work examines the RIEOA values that are used to convert AMS mass spectral ion intensities to organic mass concentrations. RIEOA are obtained from laboratory calibrations, but these calibrations are often complicated by difficulties in generating and efficiently sampling well-controlled and accurate calibrant aerosol mass concentrations. For RIEOA calibrations with the standard AMS vaporizer, the need to simultaneously obtain accurate measurements of CE is also challenging. In this work, we present new data obtained with an improved RIE calibration protocol that utilizes size and mass selection of calibrant particles and a light scattering probe to directly measure CE. A newly developed capture vaporizer with CE closer to 1 was used to investigate RIE variability with reduced CE effects. RIE calibrations were performed for several commercially available organic species with different functionalities and for complex secondary organic aerosol (SOA) particles that are freshly generated in an oxidation flow reactor. The potential for simplifying the calibrations by utilizing particles with known amounts of an internal standard (NH4NO3) was also examined. Calibrations with mixed particles containing NH4NO3 and (NH4)2SO4 showed matrix-independent RIESO4 and RIENH4 despite differences in the chemical composition and CE of the particles. RIEOA measurements with mixed aerosol particles containing NH4NO3 and alcohols reproduced the measurements obtained with pure-component alcohol particles, indicating that this may be a simpler method for calibrating RIEOA for selected organics. Mixtures of NH4NO3 and organic acids did not provide accurate RIE measurements. The measured trends in RIEOA did not correlate with theoretically modeled estimates of RIEOA. This lack of correlation demonstrates that factors other than gas phase ionization and residence time of the parent molecule within the ion source, which were the only ones represented in the theoretical model, significantly influence RIEOA in the real instruments.
The laboratory measurements indicate that while the RIEOA of pure hydrocarbons can be high (RIE ∼ 3.8–7), even mild oxidation results in a drop of RIEOA to within 1.6 ± 0.5. This plateau in RIEOA is observed for laboratory species spanning the range from −1 to 0.5, which covers the most dominant ambient OA species such as secondary organic aerosol (SOA) species and biomass burning organic aerosol (BBOA). These results give support to the use of a single RIEOA for most ambient OA. OA concentrations reported using either the typical default RIEOA of 1.4 or the laboratory RIEOA results from this study of 1.6 will agree to within the stated ±38% uncertainty of AMS OA mass concentrations. As the organics utilized in the laboratory experiments are different from the complex OA species in ambient aerosol particles, we believe that additional research into this topic using ambient particles is needed before a more precise recommendation is possible for ambient RIEOA. While the laboratory results suggest that the mass of very reduced ambient OA such as HOA may be potentially overestimated, field comparisons so far do not suggest very large errors. It is possible, however, that larger errors are not observed because of compensating deviations in parameterized CE of ambient OA. Thus, we highlight the need for more instrument intercomparisons and sensitivity analyses similar to those performed by Jimenez et al. (Citation2016) on more ambient datasets to better characterize any remaining composition-dependent biases in RIEOA, particularly with respect to POA components. We recommend that AMS users document all RIE values used in the calculation of AMS species-resolved mass concentrations. Finally, we restate the need to calibrate RIE × CE with the particles under study in laboratory studies (for example, via SMPS comparisons), given the narrower range of compositions in those studies.
UAST_1439570_Supplemental_File.zip
Download Zip (226.3 KB)Acknowledgments
The authors thank Astrid Kiendler-Scharr, Sebastian Schmitt, Thorsten Hohaus, Pedro Campuzano-Jost, Douglas Day, and Benjamin Nault for useful discussions.
Additional information
Funding
Related Research Data
References
- Aiken, A. C., DeCarlo, P. F., Kroll, J. H., Worsnop, D. R., Huffman, J. A., Docherty, K. S., Ulbrich, I. M., Mohr, C., Kimmel, J. R., Sueper, D., Sun, Y., Zhang, Q., Trimborn, A., Northway, M., Ziemann, P. J., Canagaratna, M. R., Onasch, T. B., Alfarra, M. R., Prevot, A. S. H., Dommen, J., Duplissy, J., Metzger, A., Baltensperger, U., and Jimenez, J. L. (2008). O/C and OM/OC Ratios of Primary, Secondary, and Ambient Organic Aerosols with High-Resolution Time-of-Flight Aerosol Mass Spectrometry. Environ. Sci. Technol., 42:4478–4485.
- Allan, J. D., Delia, A. E., Coe, H., Bower, K. N., Alfarra, M. R., Jimenez, J. L., Middlebrook, A. M., Drewnick, F., Onasch, T. B., Canagaratna, M. R., Jayne, J. T., and Worsnopf, D. R. (2004). A Generalised Method for the Extraction of Chemically Resolved Mass Spectra from Aerodyne Aerosol Mass Spectrometer Data. J. Aerosol Sci., 35:909–922.
- Bahreini, R., Ervens, B., Middlebrook, A. M., Warneke, C., de Gouw, J. A., DeCarlo, P. F., Jimenez, J. L., Brock, C. A., Neuman, J. A., Ryerson, T. B., Stark, H., Atlas, E., Brioude, J., Fried, A., Holloway, J. S., Peischl, J., Richter, D., Walega, J., Weibring, P., Wollny, A. G., and Fehsenfeld, F. C. (2009). Organic Aerosol Formation in Urban and Industrial Plumes near Houston and Dallas, Texas. J. Geophys. Res., 114:D00F16.
- Bahreini, R., Keywood, M. D., Ng, N. L., Varutbangkul, V., Gao, S., Flagan, R. C., Seinfeld, J. H., Worsnop, D. R., and Jiminez, J. L. (2005). Measurements of Secondary Organic Aerosol from Oxidation of Cycloalkenes, Terpenes, and m-Xylene Using an Aerodyne Aerosol Mass Spectrometer. Environ. Sci. Technol., 39:5674–5688.
- Bartmess, J. E., and Georgiadis, R. M. (1983). Empirical Methods for Determination of Ionization Gauge Relative Sensitivities for Different Gases. Vacuum, 33:149–153.
- Brock, C. A., Wagner, N. L., Anderson, B. E., Attwood, A. R., Beyersdorf, A., Campuzano-Jost, P., Carlton, A. G., Day, D. A., Diskin, G. S., Gordon, T. D., Jimenez, J. L., Lack, D. A., Liao, J., Markovic, M. Z., Middlebrook, A. M., Ng, N. L., Perring, A. E., Richardson, M. S., Schwarz, J. P., Washenfelder, R. A., Welti, A., Xu, L., Ziemba, L. D., and Murphy, D. M. (2016). Aerosol Optical Properties in the Southeastern United States in Summer – Part 1: Hygroscopic Growth. Atmos. Chem. Phys., 16:4987–5007.
- Canagaratna, M. R., Jayne, J. T., Jimenez, J. L., Allan, J. D., Alfarra, M. R., Zhang, Q., Onasch, T. B., Drewnick, F., Coe, H., Middlebrook, A., Delia, A., Williams, L. R., Trimborn, A. M., Northway, M. J., DeCarlo, P. F., Kolb, C. E., Davidovits, P., and Worsnop, D. R. (2007). Chemical and Microphysical Characterization of Ambient Aerosols with the Aerodyne Aerosol Mass Spectrometer. Mass Spectrom. Rev., 26:185–222.
- Canagaratna, M. R., Jimenez, J. L., Kroll, J. H., Chen, Q., Kessler, S. H., Massoli, P., Hildebrandt Ruiz, L., Fortner, E., Williams, L. R., Wilson, K. R., Surratt, J. D., Donahue, N. M., Jayne, J. T., and Worsnop, D. R. (2015). Elemental Ratio Measurements of Organic Compounds Using Aerosol Mass Spectrometry: Characterization, Improved Calibration, and Implications. Atmos. Chem. Phys., 15:253–272.
- Cheung, H. H. Y., Yeung, M. C., Li, Y. J., Lee, B. P., and Chan, C. K. (2015). Relative Humidity-Dependent HTDMA Measurements of Ambient Aerosols at the HKUST Supersite in Hong Kong, China. Aerosol Sci. Technol., 49:643–654.
- Cross, E. S., Onasch, T. B., Canagaratna, M., Jayne, J. T., Kimmel, J., Yu, X.-Y., Alexander, M. L., Worsnop, D. R., and Davidovits, P. (2009). Single Particle Characterization Using a Light Scattering Module Coupled to a Time-Of-Flight Aerosol Mass Spectrometer. Atmos. Chem. Phys., 9:7769–7793.
- Cross, E. S., Slowik, J. G., Davidovits, P., Allan, J. D., Worsnop, D. R., Jayne, J. T., Lewis, D. K., Canagaratna, M., and Onasch, T. B. (2007). Laboratory and Ambient Particle Density Determinations using Light Scattering in Conjunction with Aerosol Mass Spectrometry. Aerosol Sci. Technol., 41:343–359.
- Docherty, K. S., Aiken, A. C., Huffman, J. A., Ulbrich, I. M., DeCarlo, P. F., Sueper, D., Worsnop, D. R., Snyder, D. C., Peltier, R. E., Weber, R. J., Grover, B. D., Eatough, D. J., Williams, B. J., Goldstein, A. H., Ziemann, P. J., and Jimenez, J. L. (2011). The 2005 Study of Organic Aerosols at Riverside (SOAR-1): Instrumental Intercomparisons and Fine Particle Composition. Atmos. Chem. Phys, 11:12387–12420.
- Docherty, K. S., Jaoui, M., Corse, E., Jimenez, J. L., Offenberg, J. H., Lewandowski, M., and Kleindienst, T. E. (2012). Collection Efficiency of the Aerosol Mass Spectrometer for Chamber-Generated Secondary Organic Aerosols. Aerosol Sci. Technol., 47:294–309.
- Drewnick, F., Diesch, J. M., Faber, P., and Borrmann, S. (2015). Aerosol Mass Spectrometry: Particle–Vaporizer Interactions and Their Consequences for the Measurements. Atmos. Meas. Tech., 8:3811–3830.
- Dzepina, K., Arey, J., Marr, L. C., Worsnop, D. R., Salcedo, D., Zhang, Q., Onasch, T. B., Molina, L. T., Molina, M. J., and Jimenez, J. L. (2007). Detection of Particle-Phase Polycyclic Aromatic Hydrocarbons in Mexico City Using an Aerosol Mass Spectrometer. Int. J. Mass Spectrom., 263:152–170.
- Dzepina, K., Mazzoleni, C., Fialho, P., China, S., Zhang, B., Owen, R. C., Helmig, D., Hueber, J., Kumar, S., Perlinger, J. A., Kramer, L. J., Dziobak, M. P., Ampadu, M. T., Olsen, S., Wuebbles, D. J., and Mazzoleni, L. R. (2015). Molecular Characterization of Free Tropospheric Aerosol Collected at the Pico Mountain Observatory: A Case Study With a Long-Range Transported Biomass Burning Plume. Atmos. Chem. Phys., 15:5047–5068.
- Flaim, T. A., and Ownby, P. D. (1971). Observations on Bayard–Alpert Ion Gauge Sensitivities to Various Gases. J. Vacuum Sci. Technol., 8:661–662.
- Gkatzelis, G. I., Tillmann, R., Hohaus, T., Müller, M., Eichler, P., Xu, K. M., Schlag, P., Schmitt, S. H., Wegener, R., Kaminski, M., Holzinger, R., Wisthaler, A., and Kiendler-Scharr, A. (2017). Comparison of Three Aerosol Chemical Characterization Techniques Utilizing PTR-ToF-MS: A Study on Freshly Formed and Aged Biogenic SOA. Atmos. Meas. Tech. Discuss., 2017:1–31.
- Gordon, M. S., and Schmidt, M. W. (2005). Advances in Electronic Structure Theory: GAMESS a Decade Later, in Theory and Applications of Computational Chemistry: The First Forty Years, C. E. Dykstra, G. Frenking, K. S. Kim, G. E. Scuseria, eds., Elsevier, Amsterdam, Netherlands, pp. 1167–1189.
- Gunthe, S. S., King, S. M., Rose, D., Chen, Q., Roldin, P., Farmer, D. K., Jimenez, J. L., Artaxo, P., Andreae, M. O., Martin, S. T., and Pöschl, U. (2009). Cloud Condensation Nuclei in Pristine Tropical Rainforest Air of Amazonia: Size-Resolved Measurements and Modeling of Atmospheric Aerosol Composition and CCN Activity. Atmos. Chem. Phys., 9:7551–7575.
- Gysel, M., Crosier, J., Topping, D., Whitehead, J. D., Bower, K., Cubison, M., Williams, P., Flynn, M. J., McFiggans, G., and Coe, H. (2007). Closure Study Between Chemical Composition and Hygroscopic Growth of Aerosol Particles During TORCH2. Atmos. Chem. Phys., 7:6131–6144.
- Hallquist, M., Wenger, J. C., Baltensperger, U., Rudich, Y., Simpson, D., Claeys, M., Dommen, J., Donahue, N. M., George, C., Goldstein, A. H., Hamilton, J. F., Herrmann, H., Hoffmann, T., Iinuma, Y., Jang, M., Jenkin, M. E., Jimenez, J. L., Kiendler-Scharr, A., Maenhaut, W., McFiggans, G., Mentel, T. F., Monod, A., Prévôt, A. S. H., Seinfeld, J. H., Surratt, J. D., Szmigielski, R., and Wildt, J. (2009). The Formation, Properties and Impact of Secondary Organic Aerosol: Current and Emerging Issues. Atmos. Chem. Phys., 9:5155–5235.
- Hogrefe, O., Drewnick, F., Garland Lala, G., Schwab, J. J., and Demerjian, K. L. (2004). Development, Operation and Applications of an Aerosol Generation, Calibration and Research Facility. Aerosol Sci. Technol., 38:196–214.
- Hohaus, T., Trimborn, D., Kiendler-Scharr, A., Gensch, I., Laumer, W., Kammer, B., Andres, S., Boudries, H., Smith, K. A., Worsnop, D. R., and Jayne, J. T. (2010). A New Aerosol Collector for Quasi On-Line Analysis of Particulate Organic Matter: The Aerosol Collection Module (ACM) and First Applications With a GC/MS-FID. Atmos. Meas. Tech., 3:1423–1436.
- Hu, W., Campuzano-Jost, P., Day, D. A., Croteau, P., Canagaratna, M. R., Jayne, J. T., Worsnop, D. R., and Jimenez, J. L. (2017a). Evaluation of the New Capture Vaporizer for Aerosol Mass Spectrometers (AMS) through Field Studies of Inorganic Species. Aerosol Sci. Technol., 51:735–754.
- Hu, W., Campuzano-Jost, P., Day, D. A., Croteau, P., Canagaratna, M. R., Jayne, J. T., Worsnop, D. R., and Jimenez, J. L. (2017b). Evaluation of the New Capture Vapourizer for Aerosol Mass Spectrometers (AMS) through Laboratory Studies of Inorganic Species. Atmos. Meas. Tech., 10:2897–2921.
- Hu, W., Day, D. A., Campuzano-Jost, P., Nault, B. A., Park, T., Lee, T., Croteau, P., Canagaratna, M. R., Jayne, J. T., Worsnop, D. R., and Jimenez, J. L. (2018). Evaluation of the New Capture Vaporizer for Aerosol Mass Spectrometers: Characterization of Organic Aerosol Mass Spectra. Aerosol Sci. Technol. (submitted).
- Huffman, J. A., Jayne, J., Drewnick, F., Aiken, A. C., Onasch, T., Worsnop, D., and Jimenez, J. (2005). Design, Modeling, Optimization, and Experimental Tests of a Particle Beam Width Probe for the Aerodyne Aerosol Mass Spectrometer. Aerosol Sci. Technol., 39:1143–1163.
- Hwang, W., Kim, Y. K., and Rudd, M. E. (1996). New Model for Electron‐Impact Ionization Cross Sections Of Molecules. J. Chem. Phys., 104:2956–2966.
- IPCC. (2013). Climate Change 2013: The Physical Science Basis. Contribution of Working Group I to the Fifth Assessment Report of the Intergovernmental Panel on Climate Change. Cambridge University Press, Cambridge, United Kingdom, New York, NY, USA.
- Jayne, J. T., Leard, D. C., Zhang, X. F., Davidovits, P., Smith, K. A., Kolb, C. E., and Worsnop, D. R. (2000). Development of An Aerosol Mass Spectrometer for Size and Composition Analysis of Submicron Particles. Aerosol Sci. Technol., 33:49–70.
- Jimenez, J. L., Canagaratna, M. R., Donahue, N. M., Prevot, A. S. H., Zhang, Q., Kroll, J. H., DeCarlo, P. F., Allan, J. D., Coe, H., Ng, N. L., Aiken, A. C., Docherty, K. S., Ulbrich, I. M., Grieshop, A. P., Robinson, A. L., Duplissy, J., Smith, J. D., Wilson, K. R., Lanz, V. A., Hueglin, C., Sun, Y. L., Tian, J., Laaksonen, A., Raatikainen, T., Rautiainen, J., Vaattovaara, P., Ehn, M., Kulmala, M., Tomlinson, J. M., Collins, D. R., Cubison, M. J. E., Dunlea, J., Huffman, J. A., Onasch, T. B., Alfarra, M. R., Williams, P. I., Bower, K., Kondo, Y., Schneider, J., Drewnick, F., Borrmann, S., Weimer, S., Demerjian, K., Salcedo, D., Cottrell, L., Griffin, R., Takami, A., Miyoshi, T., Hatakeyama, S., Shimono, A., Sun, J. Y., Zhang, Y. M., Dzepina, K., Kimmel, J. R., Sueper, D., Jayne, J. T., Herndon, S. C., Trimborn, A. M., Williams, L. R., Wood, E. C., Middlebrook, A. M., Kolb, C. E., Baltensperger, U., and Worsnop, D. R. (2009). Evolution of Organic Aerosols in the Atmosphere. Science, 326:1525–1529.
- Jimenez, J. L., Canagaratna, M. R., Drewnick, F., Allan, J. D., Alfarra, M. R., Middlebrook, A. M., Slowik, J. G., Zhang, Q., Coe, H., Jayne, J. T., and Worsnop, D. R. (2016). Comment on “The Effects of Molecular Weight and Thermal Decomposition on the Sensitivity of a Thermal Desorption Aerosol Mass Spectrometer.” Aerosol Sci. Technol., 50:i–xv.
- Jimenez, J. L., Jayne, J. T., Shi, Q., Kolb, C. E., Worsnop, D. R., Yourshaw, I., Seinfeld, J. H., Flagan, R. C., Zhang, X. F., Smith, K. A., Morris, J. W., and Davidovits, P. (2003). Ambient Aerosol Sampling Using the Aerodyne Aerosol Mass Spectrometer. J. Geophys. Res.-Atmos., 18:8425–8437.
- Kang, E., Root, M. J., Toohey, D. W., and Brune, W. (2007). Introducing the Concept of Potential Aerosol Mass (PAM). Atmos. Chem. Phys., 7:5727–5744.
- Koopmans, T. (1934). Über die Zuordnung von Wellenfunktionen und Eigenwerten zu den Einzelnen Elektronen Eines Atoms. Physica, 1:104–113.
- Kroll, J. H., Donahue, N. M., Jimenez, J. L., Kessler, S. H., Canagaratna, M. R., Wilson, K. R., Altieri, K. E., Mazzoleni, L. R., Wozniak, A. S., Bluhm, H., Mysak, E. R., Smith, J. D., Kolb, C. E., and Worsnop, D. R. (2011). Carbon Oxidation State as A Metric for Describing the Chemistry of Atmospheric Organic Aerosol. Nature Chem., 3:133–139.
- Lambe, A. T., Ahern, A. T., Williams, L. R., Slowik, J. G., Wong, J. P. S., Abbatt, J. P. D., Brune, W. H., Ng, N. L., Wright, J. P., Croasdale, D. R., Worsnop, D. R., Davidovits, P., and Onasch, T. B. (2011a). Characterization of Aerosol Photooxidation Flow Reactors: Heterogeneous Oxidation, Secondary Organic Aerosol Formation and Cloud Condensation Nuclei Activity Measurements. Atmos. Meas. Tech, 4:445–461.
- Lambe, A. T., Onasch, T. B., Massoli, P., Croasdale, D. R., Wright, J. P., Ahern, A. T., Williams, L. R., Worsnop, D. R., Brune, W. H., and Davidovits, P. (2011b). Laboratory Studies of the Chemical Composition and Cloud Condensation Nuclei (CCN) Activity of Secondary Organic Aerosol (SOA) and Oxidized Primary Organic Aerosol (OPOA). Atmos. Chem. Phys., 11:8913–8928.
- Liu, P. S. K., Deng, R., Smith, K. A., Williams, L. R., Jayne, J. T., Canagaratna, M. R., Moore, K., Onasch, T. B., Worsnop, D. R., and Deshler, T. (2007). Transmission Efficiency of an Aerodynamic Focusing Lens System: Comparison of Model Calculations and Laboratory Measurements for the Aerodyne Aerosol Mass Spectrometer. Aerosol Sci. Technol., 41:721–733.
- Lopez-Hilfiker, F. D., Mohr, C., Ehn, M., Rubach, F., Kleist, E., Wildt, J., Mentel, T. F., Lutz, A., Hallquist, M., Worsnop, D., and Thornton, J. A. (2014). A Novel Method for Online Analysis of Gas and Particle Composition: Description and Evaluation of a Filter Inlet for Gases and AEROsols (FIGAERO). Atmos. Meas. Tech., 7:983–1001.
- Matthew, B. M., Middlebrook, A. M., and Onasch, T. B. (2008). Collection Efficiencies in an Aerodyne Aerosol Mass Spectrometer as a Function of Particle Phase for Laboratory Generated Aerosols. Aerosol Sci. Technol., 42:884–898.
- Mei, F., Hayes, P. L., Ortega, A., Taylor, J. W., Allan, J. D., Gilman, J., Kuster, W., de Gouw, J., Jimenez, J. L., and Wang, J. (2013). Droplet Activation Properties of Organic Aerosols Observed at an Urban Site During CalNex-LA. J. Geophys. Res., Atmos., 118:2903–2917.
- Middlebrook, A. M., Bahreini, R., Jimenez, J. L., and Canagaratna, M. R. (2011). Evaluation of Composition-Dependent Collection Efficiencies for the Aerodyne Aerosol Mass Spectrometer using Field Data. Aerosol Sci. Technol., 46:258–271.
- Murphy, D. M. (2016a). The Effects of Molecular Weight and Thermal Decomposition on the Sensitivity of a Thermal Desorption Aerosol Mass Spectrometer. Aerosol Sci. Technol., 50:118–125.
- Murphy, D. M. (2016b). Reply to “Comment on the Effects of Molecular Weight and Thermal Decomposition on the Sensitivity of a Thermal Desorption Aerosol Mass Spectrometer” by Jimenez et al. Aerosol Sci. Technol., 50:1277–1283.
- Ng, N. L., Herndon, S. C., Trimborn, A., Canagaratna, M. R., Croteau, P. L., Onasch, T. B., Sueper, D., Worsnop, D. R., Zhang, Q., Sun, Y. L., and Jayne, J. T. (2011). An Aerosol Chemical Speciation Monitor (ACSM) for Routine Monitoring of the Composition and Mass Concentrations of Ambient Aerosol. Aerosol Sci. Technol., 45:780–794.
- NIST. (2017). Electron-impact cross sections for ionization and excitation. https://physics.nist.gov/PhysRefData/Ionization/molTable.html (accessed 10 September 2017).
- Nozière, B., Kalberer, M., Claeys, M., Allan, J., D'Anna, B., Decesari, S., Finessi, E., Glasius, M., Grgić, I., Hamilton, J. F., Hoffmann, T., Iinuma, Y., Jaoui, M., Kahnt, A., Kampf, C. J., Kourtchev, I., Maenhaut, W., Marsden, N., Saarikoski, S., Schnelle-Kreis, J., Surratt, J. D., Szidat, S., Szmigielski, R., and Wisthaler, A. (2015). The Molecular Identification of Organic Compounds in the Atmosphere: State of the Art and Challenges. Chem. Rev., 115:3919–3983.
- Olfert, J. S., and Collings, N. (2005). New Method for Particle Mass Classification—The Couette Centrifugal Particle Mass Analyzer. J. Aerosol Sci., 36:1338–1352.
- Onasch, T., Trimborn, A., Fortner, E., Jayne, J., Kok, G., Williams, L., Davidovits, P., and Worsnop, D. (2012). Soot Particle Aerosol Mass Spectrometer: Development, Validation, and Initial Application. Aerosol Sci. Technol., 46:804–817.
- Peck, J., Gonzalez, L. A., Williams, L. R., Xu, W., Croteau, P., Timko, M. T., Jayne, J. T., Worsnop, D., Miake-Lye, R., and Smith, K. A. (2016). Development of an Aerosol Mass Spectrometer Lens System for PM2.5. Aerosol Sci. Technol, 50:781–789.
- Petters, M. D., and Kreidenweis, S. M. (2007). A Single Parameter Representation of Hygroscopic Growth and Cloud Condensation Nucleus Activity. Atmos. Chem. Phys., 7:1961–1971.
- Petters, M. D., Kreidenweis, S. M., and Ziemann, P. J. (2016). Prediction of Cloud Condensation Nuclei Activity for Organic Compounds Using Functional Group Contribution Methods. Geosci. Model Dev., 9:111–124.
- Pope, C. A., Ezzati, M., and Dockery, D. W. (2013). Fine Particulate Air Pollution and Life Expectancies in the United States: The Role of Influential Observations. J. Air Waste Manag. Assoc., 63:129–132.
- Press, W. H., Teukolsky, S. A., Vetterling, W. T., and Flannery, B. P. (1992). Numerical Recipes in C: The Art of Scientific Computing, 2nd ed. Cambridge University Press, New York, NY, USA.
- Robinson, E. S., Onasch, T. B., Worsnop, D., and Donahue, N. M. (2017). Collection Efficiency of α-Pinene Secondary Organic Aerosol Particles Explored via Light-Scattering Single-Particle Aerosol Mass Spectrometry. Atmos. Meas. Tech., 10:1139–1154.
- Salcedo, D., Onasch, T. B., Canagaratna, M. R., Dzepina, K., Huffman, J. A., Jayne, J. T., Worsnop, D. R., Kolb, C. E., Weimer, S., Drewnick, F., Allan, J. D., Delia, A. E., and Jimenez, J. L. (2007). Technical Note: Use of a Beam Width Probe in an Aerosol Mass Spectrometer to Monitor Particle Collection Efficiency in the Field. Atmos. Chem. Phys., 7:549–556.
- Schmidt, M. W., Baldridge, K. K., Boatz, J. A., Elbert, S. T., Gordon, M. S., Jensen, J. H., Koseki, S., Matsunaga, N., Nguyen, K. A., Su, S., Windus, T. L., Dupuis, M., and Montgomery, J. A. (1993). General Atomic and Molecular Electronic Structure System. J. Comput. Chem., 14:1347–1363.
- Silva, P. J., Erupe, M. E., Price, D., Elias, J., Malloy, Q. G. J., Li, B., Warren, B., and Cocker, III, D. R. (2008). Trimethylamine as Precursor to Secondary Organic Aerosol Formation via Nitrate Radical Reaction in the Atmosphere. Environ. Sci. Technol., 42:4689–4696.
- Sinclair, D., and La Mer, V. K. (1949). Light Scattering as a Measure of Particle Size in Aerosols. The Production of Monodisperse Aerosols. Chem. Rev., 44:245–267.
- Slowik, J. G., Stainken, K., Davidovits, P., Williams, L. R., Jayne, J., Kolb, C. E., Worsnop, D., Rudich, Y., DeCarlo, P., and Jimenez, J. (2004). Particle Morphology and Density Characterization by Combined Mobility and Aerodynamic Diameter Measurements. Part 2: Application to Combustion-Generated Soot Aerosols as a Function of Fuel Equivalence Ratio. Aerosol Sci. Technol., 38:1206–1222.
- Williams, B. J., Goldstein, A. H., Kreisberg, N. M., and Hering, S. V. (2006). An In-Situ Instrument for Speciated Organic Composition of Atmospheric Aerosols: Thermal Desorption Aerosol GC/MS-FID (TAG). Aerosol Sci. Technol., 40:627–638.
- Williams, L. R., Gonzalez, L. A., Peck, J., Trimborn, D., McInnis, J., Farrar, M. R., Moore, K. D., Jayne, J. T., Robinson, W. A., Lewis, D. K., Onasch, T. B., Canagaratna, M. R., Trimborn, A., Timko, M. T., Magoon, G., Deng, R., Tang, D., de la Rosa Blanco, E., Prévôt, A. S. H., Smith, K. A., and Worsnop, D. R. (2013). Characterization of An Aerodynamic Lens for Transmitting Particles Greater Than 1 micrometer in Diameter into the Aerodyne Aerosol Mass Spectrometer. Atmos. Meas. Tech., 6:3271–3280.
- Xu, W., Croteau, P., Williams, L., Canagaratna, M., Onasch, T., Cross, E., Zhang, X., Robinson, W., Worsnop, D., and Jayne, J. (2017). Laboratory Characterization of An Aerosol Chemical Speciation Monitor with PM2.5 Measurement Capability. Aerosol Sci. Technol., 51:69–83.
- Yatavelli, R. L. N., and Thornton, J. A. (2010). Particulate Organic Matter Detection Using a Micro-Orifice Volatilization Impactor Coupled to a Chemical Ionization Mass Spectrometer (MOVI-CIMS). Aerosol Sci. Technol., 44:61–74.
- Zhang, R., Wang, G., Guo, S., Zamora, M. L., Ying, Q., Lin, Y., Wang, W., Hu, M., and Wang, Y. (2015). Formation of Urban Fine Particulate Matter. Chem. Rev., 115:3803–3855.