
Abstract
Due to the exponential increase in aircraft traffic in recent decades, the role of soot particles emitted by aircraft engines on the radiative forcing needs to be addressed, and especially their interaction with clouds has to be better understood and quantified. In this work, we investigate the hygroscopic properties of fresh and aged soot sampled on line in a kerosene flame. The activated fraction (Fa) of size selected soot is measured by means of a variable supersaturation condensation nucleus counter at several heights above the burner (HAB), thereby probing soot particles with different residence times in the flame, i.e., different degrees of maturity. In order to simulate atmospheric aging, the activity of soot as cloud condensation nuclei is measured as a function of ozone exposure. We show that fresh soot is hydrophobic (Fa∼0), while Fa increases when soot is exposed to ozone. The measurements depend on the HAB at which soot particles are sampled showing that activation of soot particles is related to their chemical composition. This study brings new results on the link between atmospheric aging of soot and its hygroscopic properties, which is of great interest for understanding the role of soot in the cloud formation.
Copyright © 2018 American Association for Aerosol Research
EDITOR:
1. Introduction
In 2015, more than 85.5 million worldwide aircraft movements have been counted between 1940 airports located in 176 countries corresponding to 7.2 billion passengers and up to 14 billion are expected by 2029 (ACI Citation2016). It is assumed that the related emissions from aircraft engines have doubled between 2005 and 2015 (Eyers et al. Citation2004), and therefore their impact on the air quality and on the climate forcing has become a priority research topic (Penner Citation1999; Lee et al. Citation2009, 2010; Mahashabde et al. Citation2011).
Jet A and Jet A1 are the kerosene-type fuels, most commonly employed by the civil aviation. Aircraft emissions contain several compounds considered as pollutants or contributing to global warming: NOx, CO, SOx, unburned hydrocarbons (HCs), soot particles, H2O and CO2. In addition, other species are emitted in trace concentration from engine lubricant oil (Dakhel et al. Citation2005), from the engine erosion (Petzold et al. Citation1997; Demirdjian et al. Citation2007) and from trace amounts of metals (Fe, Cu, Zn) in the fuel (Lewis et al. Citation1999). Among these pollutants, soot particles are believed to be one of the major sources of uncertainties in assessing the aircraft impact on the upper troposphere and lower stratosphere (Lee et al. Citation2010, Citation2009).
The analysis of main air traffic routes shows that more than 90% of the aircraft emissions occur at cruise altitude (typically between 9 and 12 km), whereas only 5–10% of emissions occur below 1 km (Kim et al. Citation2007; Olsen et al. Citation2013; Simone et al. Citation2013). All aircraft operations carried out below the 1 km altitude limit are conventionally defined as part of the landing and take-off (LTO) cycle. Since this altitude roughly corresponds to the planetary boundary layer below which air masses are rapidly mixed, emissions corresponding to LTO cycles have probably the largest impact on human health and activities. Global emissions and emission indices of aircraft have been reported by several studies and field campaigns performed during real aircraft operations (Masiol and Harrison Citation2014).
When ice or water supersaturation conditions exist within the aircraft exhaust plume, soot can trigger the formation of condensation trails (contrails) that may persist for hours and eventually evolve in cirrus-like artificial clouds (Albrecht Citation1989; Pincus and Baker Citation1994; Stocker et al. Citation2013; Masiol and Harrison Citation2014). The contribution to the radiative forcing of these persistent contrails was estimated in the range [+0.005, +0.03] W·m−2 in 2011 (Stocker et al. Citation2013). The large uncertainty arises from the lack of global observational data.
When emitted at high altitude, soot particles can be transported over large distances in the free troposphere (Kim et al. Citation2005; Stocker et al. Citation2013). Moreover, soot particles may act as cloud condensation nuclei (CCN) and may therefore influence the formation of clouds and their microphysical properties. Recent work has shown the relationship between the CCN concentration and the optical properties (albedo, optical thickness) and lifetime of liquid clouds (Petzold et al. Citation1997; Kim et al. Citation2005; Demirdjian et al. Citation2007; Kim et al. Citation2007). In total, soot-induced clouds and contrails can represent up to 5% of all favorable situations for cirrus formation (Stubenrauch and Schumann Citation2005). These clouds reflect the incoming solar radiation and interact with the terrestrial long wave radiation affecting the global earth’s radiation balance. The total direct effect of black carbon on atmospheric forcing, without subtracting the preindustrial background, is estimated as positive and as high as +0.88 (+0.17, +1.48) W·m−2 (Bond et al. Citation2013).
Freshly emitted soot particles are hydrophobic and unlikely to contribute to the CCN population in the atmosphere (Twomey Citation1959; Stubenrauch and Schumann Citation2005; Andreae and Gelencsér Citation2006). Many studies have shown that soot has low affinity with water vapor, no matter its generation process (Köhler et al. Citation2009). In the case of flame combustion, similar results are found regardless of the fuel: diesel, kerosene, methane, propane, hexane, and ethylene (Petzold et al. Citation2003; Zuberi et al. Citation2005; Zhang et al. Citation2008; Khalizov et al. Citation2009; Tritscher et al. Citation2011; Henning et al. Citation2012; Wittbom et al. Citation2014; Lambe et al. Citation2015). Therefore, the ability of fresh soot particles in the combustion exhausts to act as CCNs and trigger the formation of water droplets might not depend on the chemical nature of soot. Studies have also investigated the role of the surface composition when soot particles are artificially coated. Little influence on hygroscopic properties has been observed when black carbon particles are covered by polycyclic aromatic hydrocarbons (PAHs), such as benzo[a]pyrene (Kotzick and Niessner Citation1999) or by volatile organic compounds (VOC) such as succinic acid (Henning et al. Citation2012). By controlling the combustion conditions of n-hexane and decane flames, Han et al. (Citation2012) observed that the surface tension of soot increases linearly with the ratio of hydrophilic/hydrophobic functional groups (C=O/C–H).
However, after emission in the troposphere, soot particles undergo physical and chemical changes, commonly referred to as “aging,” like surface oxidation, photochemical reactions, coating by low volatile organic compounds. After atmospheric aging processes, freshly emitted soot particles may become active as CCNs as shown by a large number of laboratory experiments. Thus, Lambe et al. (Citation2015) investigated CCN activation of soot produced by an ethylene flame. They noticed that soot particles become active after being exposed to O3, OH, α-pinene and m-xylene or SO2. Wittbom et al. (Citation2014) showed a similar effect after exposing soot particles to UV light. Measurements were done by injecting in a simulation chamber the exhausts of a Diesel engine or a diffusion propane flame. Despite these experimental evidences of the role of oxidation or UV irradiation on the hygroscopic properties of soot, the chemical–physical processes involved are not yet fully understood. In particular, is ageing the result of condensation of oxidized VOCs on soot particles, or is it rather due to chemical changes of the surface possibly mediated by heterogeneous processes?
Experiments on soot particles generated by aircraft are very scarce because of their high cost and the complexity of the sampling in gas turbine exhaust (Liati et al. Citation2014). Recently, a detailed morphological and chemical characterization of soot particles emitted by a SAM 146 turbofan has been performed (Delhaye et al. Citation2017). It was found that their main characteristics could be reproduced using a mini CAST burner (Bescond et al. Citation2014). Maricq (Citation2014) shows that, depending on the adjustment of setting parameters of the combustion reactors, morphological similarities between soot emitted by engines, a mini CAST burner and an ethylene flame could be obtained. However, due to the large variability of combustion conditions encountered at the different thrust setting of aircraft engines or regimes of gasoline/diesel engines (Karjalainen et al. Citation2014), soot characteristics may strongly vary in size distribution, morphology and chemical composition. Flames appears to be a convenient source of soot particles to produce either soot with physical chemical properties similar to aeronautics soot particles, or soot of various characteristics as encountered in the different engine regimes. In this work, we have selected, as a support, a turbulent spray flame, extensively studied in our laboratory (in order to study the impact of soot characteristics on their hygroscopic properties. The selected fuel is the common aeronautic fuel kerosene JetA1 (Lemaire et al. Citation2009b). This aviation fuel was selected to produce soot with chemical composition close to the aeronautics one (Parent et al. Citation2016). The role of O3 exposure and of the size of the particles on CCN activation was studied. For the first time, the effect of soot particles maturity, linked to their residence time into the flame is also investigated.
2. Experimental set-up and procedures
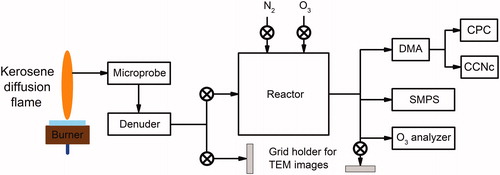
shows a scheme of the experimental setup. Soot particles are produced by a kerosene turbulent jet diffusion flame and extracted using a sampling probe featuring high dilution ratio to quench post sampling reaction and to avoid post sampling coagulation. Nitrogen is used as diluting gas. Particles are sampled on the burner axis at different heights above the burner (HAB) by translating the burner relatively to the probe. The sampled flow passes through a denuder to remove the condensable gas. Then, soot particles can either be sent directly to the cloud condensation nuclei counter (CCNc), or alternatively to a 50 L reactor in which they undergo prior oxidation with ozone. The activated fraction (Fa) and the critical supersaturation (Sc) of soot particles are measured in supersaturation conditions depending on the following parameters: particle electrical mobility diameter, sampling HAB, ozone exposure. The details of the set-up are described below.
Figure 1. Schematic of the experimental setup.
2.1. Soot particles generation
2.1.1. The fuel
All experiments are performed using kerosene fuel Jet A-1. Gas chromatographic (GC) analyses found more than 900 peaks whose main components in mass are linear (18%), branched chained (18%), and cyclic aliphatic HCs (16%), and light aromatic HCs mostly benzene derivatives (38%) (Lemaire et al. Citation2009b). Although sulfur-containing compounds in kerosene are considered as being the main actors responsible for the soot affinity with water vapor, only traces could be detected in the fuel (2,3-dihydrothiophene, thioglycolic acid, 2-pentylthiophene, 2-hexylthiophene).
2.1.2. Size and morphology of soot particles
Soot is composed of fractal-like aggregates of 10s to 1000s of primary particles. The morphology of soot agglomerates is described by a power-law relationship (Samson et al. Citation1987; Bonczyk and Hall Citation1991):
(1)
where Np is the number of primary particles, kf is the dimensional prefactor, Rg is the radius of gyration of the agglomerate that is the root mean square distances of the primary particles from the aggregate center of mass, Dp is the diameter of the primary particles, and Df is the fractal dimension. The fractal dimension varies from 3 for spherical aggregate to 1 for a linear chain.
The observation of the primary particles by high-resolution transmission electron microscopy (HRTEM) has revealed that primary particles have two distinct parts (Ishiguro et al. Citation1997; Hurt et al. Citation2000; Wang Citation2011): an outer shell and an inner core. The outer shell is composed of microcrystallites with turbostratic structure of carbon layers. The crystallites are planar in shape and are oriented roughly orthogonal to the radius of the primary particle. The inner core (∼3–4 nm) consists of disordered structures (∼1–2 nm) that possibly originate from PAHs clustering.
In this work, soot particles morphology and size distribution are characterized using transmission electron microscopy (TEM) and scanning mobility particle sizing (SMPS), respectively. TEM is used to measure the mean diameter of the primary particles Dp, the number of primary particles per aggregate Np, and their fractal dimension Df (Ouf et al. Citation2010). TEM measurements were performed on the FEI Tecnai G2 20 microscope (200 kV acceleration voltage). SMPS is used to measure the distribution density function of the electrical mobility diameter Dm. SMPS measurements were performed using a TSI 3091 SMPS that consists of TSI 3080 DMA upstream a TSI 3776 CPC operated with an aerosol flow rate of 0.3 L·min−1. The CPC is also used to measure the concentration of the soot particles NCN (cm−3) analyzed by the CCNc (CCNc-100, Droplet Measurement Technologies, Longmont, CO, USA).
2.1.3. Burner and sooting flame description
The complexity of the soot formation process leads to the generation of a large variety of soot particles in terms of size distribution, soot morphology, and composition. In this work, we take advantage of long-term studies performed in a spray turbulent diffusion flame (Lemaire et al. Citation2009a) to generate controlled soot particles of varying characteristics.
An atmospheric hybrid Holthuis (previously McKenna) burner composed of a 60 mm diameter bronze porous with a central 6.35 mm diameter tube allowing the introduction of an injector has been used in all experiments. A premixed methane-air flat flame (ϕ = 0.8, cold gas velocity = 13 cm·s−1) stabilized on the porous plug allows the ignition of the atomized fuel jet. A turbulent kerosene jet flame is stabilized by developing an original set-up based on the use of a Direct Injection High Efficiency Nebulizer (DIHEN) (Lemaire et al. Citation2009). A high speed spray of small liquid fuel droplets is formed at the exit of the nebulizer and is ignited by the methane flat flame, resulting in a turbulent diffusion flame around 21 cm height and 2 cm width. The nebulization gas is nitrogen. The gas flow rate is fixed to 0.22 L·min−1 and controlled using an external mass flow controller. The various liquid HCs were introduced in the nebulizer capillary with a mass flow rate of 50 g·h−1 controlled with a liquid mass flow controller (Bronkhorst High-Tech L2C2I). This burner has been extensively used to study the formation of soot and soot precursors along the flames by using in situ laser diagnostics such as laser-induced incandescence (LII) for soot particles and laser-induced fluorescence (LIF) for gaseous PAHs. From these measurements, a classification of several liquid fuels in terms of threshold soot index (TSI) could be established (Lemaire et al. Citation2010). The soot characteristics, in terms of morphology and chemical composition, depend on their reaction time, i.e., their location into the flame. Taking advantage of our previous knowledge of PAHs mapping with respect to the soot one (Lemaire et al. Citation2009a, Citation2009b, Citation2010), we have selected four sampling HABs that corresponds to different soot characteristics and gaseous environments in this 210 mm length flame as shown in .
Figure 2. Picture of the turbulent kerosene diffusion flame and sampling locations along the vertical flame axis. The right panel schematically represents the locations of soot precursors (PAHs) and soot volume fraction along the flame axis.
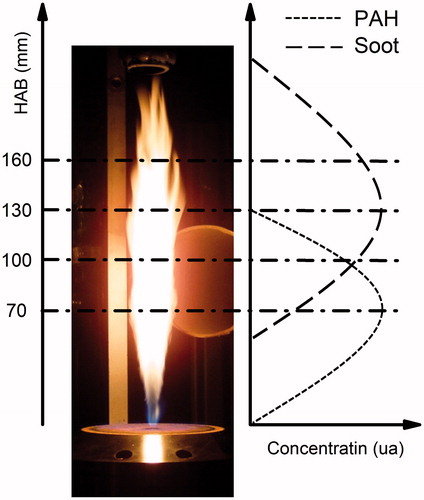
The different steps of soot formation in diffusion flames, and in particular the role of acetylene and PAHs, are well known (Santoro and Semerjian Citation1985; Smooke et al. Citation2005). In our flame, soot inception on the flame axis corresponds to the beginning of PAHs consumption. Around HAB = 70 mm the particle concentration and the corresponding soot volume fraction are small and the gas phase is rich in PAHs. At higher HAB, the particle concentration increases and the particle size grows due to surface reaction and coagulation resulting in an increase of the soot volume fraction up to a peak at around 130 mm. Above 210 mm all the particles are oxidized resulting in a non-smoking flame. During their formation and oxidation, soot particles undergo important modifications of their morphology and chemical composition. Soot particles form complex aggregates composed of primary particles whose diameter increases with the reaction time. The surface chemical composition of extracted soot mainly consists of PAHs and their derivatives, whose nature and relative concentration depends on the soot maturity i.e., its HAB (Dobbins et al. Citation2006, 1998; Lemaire et al. Citation2009a; Maricq Citation2011). Globally, the main processes involved in soot formation remain unchanged regardless of the nature of the fuel, unlike the size, the concentration of soot particles, and their chemical composition. Only a few studies have focused on soot particles formed from kerosene combustion (Jones et al. Citation2004; Lemaire et al. Citation2009b; Saffaripour et al. Citation2013).
2.1.4. The sampling system
Soot particles are sampled with a diluting quartz microprobe, specifically developed for SMPS measurements. The microprobe is made of two co-annular quartz tubes, the outer one ending with a thin tip on which an aperture (100 µm) is obtained by abrasion. An automatic pressure regulation system is located downstream and enables a stable control of the pressure inside the probe, typically set to 5–20 mbar lower than the flame pressure. Nitrogen (5 L·min−1) flows between the quartz tubes up to the probe tip. Here, it mixes with the sample flow from the flame (1–10·mL min−1) that enters the probe tip orifice drawn in by the flame-probe pressure difference. The soot aerosol laden flow exiting the probe is then sampled before the automatic valve for further analysis and manipulations (online SMPS, injection into the reactor for aging experiments, soot deposition on TEM grids). The main advantage of this configuration consists the fast dilution of the sampled gas that quenches most chemical reactions and limits post-sampling particle coagulation phenomena. The low flame-probe pressure difference allows at the same time high-dilution ratio (around 1000) while minimizing flame perturbations. The particle concentration in the sampling line has to be higher than the counter’s detection limit but at the same time not as large as to trigger post-sampling aggregation.
A homemade, parallel plate, activated carbon, room temperature diffusion denuder is inserted between the microprobe and the reactor to remove volatile and condensable compounds (particularly the PAHs) from the gas phase of the sampled aerosol. This proved to be critical in order to avoid the formation of secondary organic aerosol in the reactor and to prevent contamination of the CCNc with condensable species. By using gas chromatography, the absorption efficiency of the denuder was tested by measuring the capture coefficient of a calibrated mixture of gas for two different flow rates (2.5 and 5 L·min−1). The results, available on online Supplemental Information, show that the absorption efficiency is higher than 94% for HC species containing three carbon atoms (propadiene) up to seven carbon atoms (toluene).
2.1.5. Aging of soot particles
In order to simulate the aging of soot particles due to oxidation reactions in the atmosphere, soot particles were exposed to variable ozone exposure. The ozone exposure (in molecule cm−3·s) is defined as the product of the ozone concentration and the residence time in the reactor. This creates a common variable that allows comparing the different experiments in the literature. Soot activation experiments were carried out in a laboratory reactor that consists of a 50 L Pyrex glass spherical balloon. During typical experiments, the reactor is first pumped until the number concentration of residual particles measured by the CPC is below the lower detection limit of the instrument. The reactor is then filled with nitrogen and ozone up to the maximum mixing ratio of 1.2 ppm. The ozone is generated by photolysis of O2 with a pen UV lamp (UVP SOG-2). A differential pressure preactor−patm= −20 mbar is then achieved in order to start the injection of soot in the reactor. Once the concentration of soot particles in the reactor reaches ∼106 cm−3, the probe is disconnected from the flame. Time origin of ozone exposure starts 10 s after the end of the soot injection. Their size distribution and activated fraction are measured by means of the SMPS and CCNc, respectively.
The activated fraction of soot particles is determined at different HABs (70, 100, 130, and 160 mm) and for ozone exposure times ranging from a few minutes to a few hours. The total flow (1.5 L·min−1) sampled by the CPC and the CCN is balanced by the introduction of pure nitrogen in the reactor. The concentration of ozone is therefore corrected for dilution during measurements.
2.2. Generation of CCN
In this work, the capability of soot particles to act as CCN, i.e., to trigger the formation of water droplets by heterogeneous nucleation at T > 0 °C is investigated in supersaturation (S) conditions (Popovicheva et al. Citation2008; Köhler et al. Citation2009; Tritscher et al. Citation2011; Wittbom et al. Citation2014; Lambe et al. Citation2015) by means of a commercial continuous-flow thermal-gradient CCNc (CCNc-100, Droplet Measurement Technologies). The principle of this instrument is described by (Roberts and Nenes Citation2005; Lance et al. Citation2006). Briefly, the CCNc consists of a column in which supersaturation conditions are maintained and an optical particle counter (OPC) measuring the droplet concentrations (NCCN in cm−3) in the size range (0.75–10 µm). Supersaturation is generated in the instrument using a vertical thermal gradient and continuous humidification through the column. By changing the temperature gradient, water supersaturation in the range between S = 0.07% and S = 1.8% can be obtained. Calibration of the instrument is achieved by measuring hygroscopic properties of a reference salt, typically ammonium sulfate.
Particles were size selected by using a differential mobility analyzer (DMA TSI 3080) upstream the CCNc and the condensation particles counter (CPC). At the exit of the DMA, the aerosol flow is split and concurrently introduced into the CPC and the CCNc, measuring simultaneously NCN and NCCN. The activated fraction (Fa) is then calculated for each supersaturation (S) between 0.2% and 1.8% as:
(2)
The Fa against S plot is shown in for ammonium sulfate particles (Dm = 65 nm). The critical supersaturation (Sc) corresponds to the supersaturation for which 50% of the particles are activated, so Fa (Sc)=0.5. The critical supersaturation can be determined by fitting the experimental data with a Boltzmann sigmoid curve (Sullivan et al. Citation2009):
(3)
where dS is a parameter related to the shape (steepness) of the sigmoid curve,
and
are the minimum and the maximum values, respectively of the activated fraction.
Figure 3. CCN activation curve of ammonium sulfate particles (Dm = 65 nm). The solid line represents the fitting model (see EquationEquation (2)(2) ) used to determine Sc (
= 0,
= 1, dS = 0.03% and Sc = 0.29%).
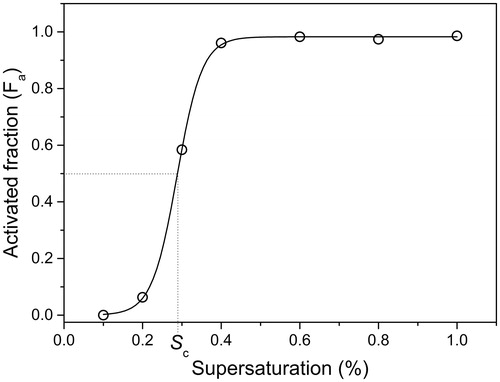
Calibration of the CCNc has been checked with an aerosol of ammonium sulfate particles (Dm = 65 nm). From the activation curve shown in , we determined Sc = 0.29% in very good agreement with the value found in the literature (Sc = 0.31%) (Petters and Kreidenweis Citation2007)
3. Results and discussion
3.1. Morphology of soot particles
Soot particles were sampled just before the reactor for ex-situ investigation of their morphology by TEM or on-line investigation of their mobility diameter distribution by SMPS. The flow rates have not been optimized to prevent aggregation and coagulation in the sampling line but rather to assure the correct operation of the measurement instruments, thus the measured distribution is representative of the sampling line and not of the flame.
3.1.1. Soot primary particle diameter
Soot samples were collected at HAB = 70 and 130 mm by impaction on copper TEM microscopy grids (Holey Carbon Filter 200 Mesh). shows an example of TEM images at the two HABs.
Figure 4. TEM images of kerosene soot particles sampled at 70 mm HAB (left) and 130 mm HAB (right).
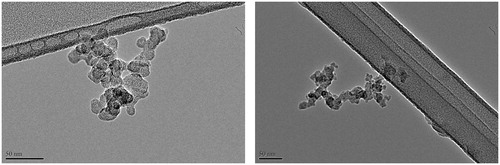
The primary soot particle diameter distribution at the two HABs is obtained manually by identifying individual primary particles into the aggregates in TEM images (Yon et al. Citation2011; Bejaoui et al. Citation2015). Measures 1078 and 1638, respectively are taken to ensure a correct and representative statistics of the measured samples. The results are shown in .
Figure 5. Primary soot particle diameter distributions: HAB = 70 mm (left) and HAB = 130 mm (right).
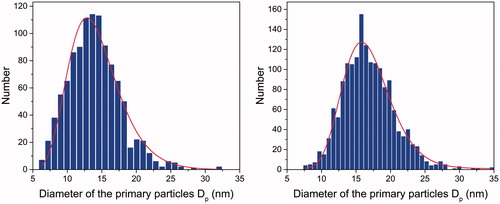
The mean diameter of the primary soot particles is estimated by fitting the distributions with a lognormal function. The fitting parameters are shown in .
Table 1. Mean diameter of soot primary particles at different height of sampling in the kerosene flame.
The obtained primary particle mean diameter is close to dp = 16.4 nm measured in the same diffusion flame, but using diesel fuel (Yon et al. Citation2011). The diameter slightly increases from 13.8 nm at 70 mm HAB up to 16.5 nm at 130 mm HAB indicating the growth of the soot particles along HAB in this flame region.
3.1.2. Soot mobility diameter distribution
The distributions of the electrical mobility diameter of the soot aggregates have been measured by SMPS. Soot was sampled at HAB = 70, 100, 130, and 160 mm as detailed in Section 2.1.2 and injected in the reactor. shows the normalized soot size distributions for the different HAB.
Figure 6. Evolution of the normalized electrical mobility diameters of soot as function of the HAB. Experimental data have been fitted using a lognormal law.
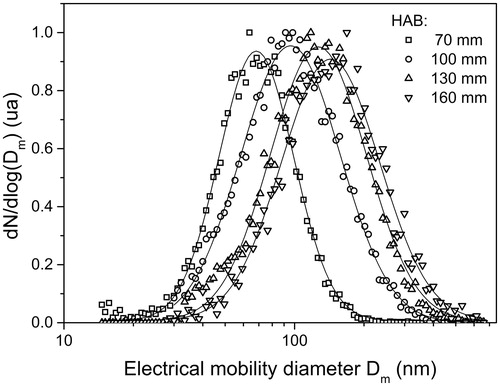
The mode of the soot size distribution increases from Dm = 66 nm at 70 mm HAB to Dm = 143 nm at 160 mm HAB. The increase of the mobility diameter is qualitatively consistent with the growth of the primary particles and to the increase of the number of primary particles per aggregate found in diffusion flames (Chowdhury et al. Citation2017). It is likely that coagulation and aggregation in the line have occurred, explaining the large mode of the distribution.
3.2. Soot as CCN
3.2.1. Fresh soot particles as CCN
Before studying CCN activity of oxidized soot, some experiments were conducted for soot freshly sampled at HAB = 130 mm. shows the activated fraction as a function of water vapor supersaturation in the range 0.2–1.8% for three selected electrical mobility diameters (Dm = 150, 300, and 400 nm).
Figure 7. Measured activated fraction for kerosene soot as a function of the supersaturation for the electrical mobility diameters 150 nm (◊), 300 nm (^), 400 nm (□).
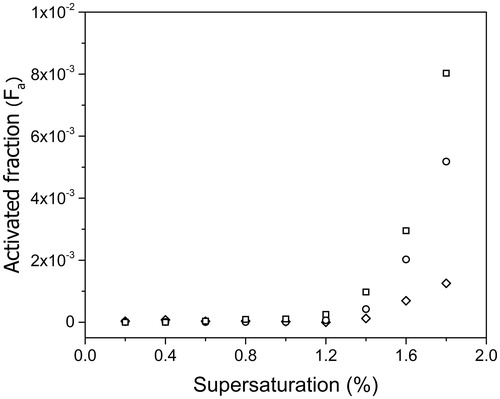
Regardless, the particle size, Fa<10−2 for S < 1.8%. Activation of soot is slightly greater for larger particles as predicted by the Kelvin effect (Seinfeld et al. Citation1998) for spherical particles. As mentioned in Section 2.1.2, soot is made of aggregates with fractal-like structure and their morphology description using classical geometry parameters is non-trivial. However, relationships between Dm and Rg may be established that show that measurements performed by DMA can be used to compare size effects on the activated fraction measurements.
These preliminary experiments confirm that fresh soot is an extremely hydrophobic material as shown previously for soot issued from the combustion of different fuels: diesel, kerosene, propane, hexane, and ethylene (Petzold et al. Citation1997; Zuberi et al. Citation2005; Köhler et al. Citation2009; Tritscher et al. Citation2011; Henning et al. Citation2012; Wittbom et al. Citation2014; Lambe et al. Citation2015).
It is known that most of the chemical species found on soot surface are PAHs (Dobbins et al. Citation2006), species for which affinity with water molecule is very weak (Kotzick and Niessner Citation1999; Köhler et al. Citation2009). Although the presence of surface carbonyl or other oxygenated functional groups locally enhance the polarity of the surface promoting the physisorption of water molecule (Oubal et al. Citation2010), the surface density of such sites is so low that the surface as a whole is hydrophobic. These preliminary experiments confirm that fresh soot alone cannot act as CCN in the range of atmospheric supersaturation conditions (Weingartner et al. Citation1997; Meyer and Ristovski Citation2007; Zhang et al. Citation2008; Popovicheva et al. Citation2011; Tritscher et al. Citation2011; Wittbom et al. Citation2014).
3.2.2. Aged soot particles as CCN
The activated fraction of kerosene soot against the supersaturation for a set of experiments with increasing ozone exposure (Section 2.1.4) has been measured at four HAB: 70, 100, 130, and 160 mm. In , CCN activation curves are plotted for exposure time between 18 and 105 min, leading to O3 exposure ranging between 3.2 × 10¹⁶ and 1.8 × 10¹⁷ molecule cm−3·s. These measurements have been performed for size-selected soot (Dm = 150 nm) at HAB = 70 mm and HAB = 130 mm ().
Figure 8. Measured activated fraction of kerosene soot against supersaturation at different ozone exposures for 2 HAB: 130 mm (left panel) and 70 mm (right panel). At HAB = 70 mm, Fa is sufficiently large to allow fitting using EquationEquation (2)(2) (solid lines). At HAB =130 mm (left panel), Fa is too low to allow a reliable fit and therefore the dashed lines are only guidelines.
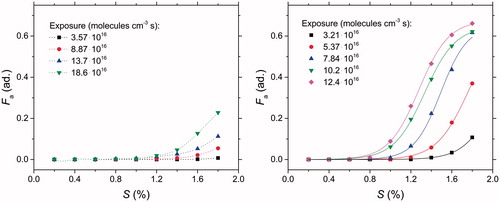
For all HAB, Fa increases as a function of the ozone exposure. Regardless of the HAB, Fa never exceeds 0.1 for S < 1% and increases up to Fa = 0.68 in the most favorable case for HAB = 70 mm at high supersaturation and high-ozone exposure. Due to the significant activated fraction observed at HAB = 70 mm, it has been possible to estimate the critical supersaturation by fitting the activation curves using EquationEquation (3)(3) . The fits are shown in (right panel), and the fit parameters are listed in . The critical supersaturation is plotted as a function of the ozone exposure in . Sc decreases from 2.1% to 1.3% as the ozone exposure increases up to 12.4 × 10¹⁶ molecules per cm−3·s. The steepness of the curve is almost the same dS = 0.15 ± 0.01.
Figure 9. Measured CCN critical supersaturation (Sc) against ozone exposure for oxidized kerosene soot particles (Dm = 150 nm) and sampling at HAB = 70 mm. Equivalent photochemical age is shown on the top axis assuming an average atmospheric ozone concentration of 8.8.1011 × molecules per cm−3.

Table 2. Fit parameters at HAB = 70 mm using EquationEquation (3)(3) .
highlights the increasing of soot activation with ozone exposure. To the best of our knowledge, this is the first study of the change of the hygroscopic properties of soot samples from a kerosene flame and exposed to ozone. Kotzick et al. (Citation1997) measured a decrease of the critical supersaturation from Sc ∼ 25% to Sc ∼ 10% for ultrafine carbon particles in the size range 50–80 nm obtained by spark discharge when such particles were exposed to 1 ppm of ozone during 120 s. Using FTIR spectroscopy before and after O3 exposure, the authors were able to measure the increase of the intensities of the IR absorption bands corresponding to oxygen-related functional groups. They concluded that the increased hydrophilic behavior of the particles was due to significant change of the surface properties. Kotzick and Niessner (Citation1999) have also extended their study using the same carbon particles coated with benzo[a]pyrene. The coating of the particles did not change the hydrophobic nature of the carbon particles but a significant decrease of Sc is observed after reaction with ozone. More recently, Lambe et al. (Citation2015) performed aging experiments with soot particles sampled from an ethylene flame and exposed to ozone into a flow reactor. The authors found Sc = 0.6% when soot particles are exposed to high concentration of ozone up to 20 ppm, but with a shorter duration compared to our experiments, leading to an ozone exposure of 5.0 × 10¹⁶ molecules per cm−3·s. In comparison with the present study, the lower value of the critical supersaturation found by Lambe et al. can be due to the different soot characteristics, the larger diameter (Dm = 222 nm) and in the absence of denuder to the presence of low-volatile organic compounds in the reactor that can be rapidly oxidized by O3 and condense on the particles.
3.2.3. Maturity of soot
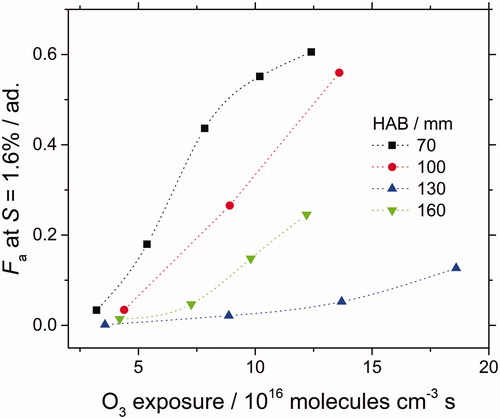
Soot maturity is a generic term referring to the stage of soot growth in the flame that accounts for the coagulation and oxidation of the particle, and it is loosely related to the residence time and the chemical environment. As detailed in Section 2.1.3, soot particles undergo surface growth up to 130 mm HAB, above which they are gradually oxidized. The most mature soot particles are therefore obtained at 130 mm HAB. To evaluate the influence of the soot maturity on their hygroscopic activity, the kerosene flame was sampled at several HABs (70, 100, 130, and 160 mm) as explained in Section 2.1.3. For these four HABs, Fa was measured for size-selected particles (Dm = 150 nm) as a function of supersaturation and for ozone exposure ranging between 3.2 × 10¹⁶ and 18 × 1016 molecules per cm−3·s.
shows the activated fraction (Fa) at fixed supersaturation (S = 1.6%) as function of ozone exposure. The activated fraction increases against ozone exposure, with similar trends for the four sampled HABs. For all ozone exposures, reveals that Fa is lowest at 130 mm (most mature soot) whereas it is highest at 70 mm (young soot). It has been shown in previous studies (Dobbins et al. Citation1998; Apicella et al. Citation2007; Faccinetto et al. Citation2011), that soot growth along HAB can be related to the decrease of the H/C ratio of the HCs found at the soot surface (mainly PAHs). Thus, the increase of Fa with HAB may originate from the oxidation of those HCs with ozone. In particular, the H/C ratio would play an important role in assessing the reactivity of PAHs since it is linked to the available number of hydrogen atoms as further discussed below.
Figure 10. Fa measured at fixed supersaturation (S = 1.6%) against ozone exposure for oxidized kerosene size-selected soot particles (Dm = 150 nm). Soot is sampled at 70, 100, 130, and 160 mm HAB. Dotted lines are guidelines.
A large number of experimental (Perraudin et al. Citation2007; McCabe and Abbatt Citation2008; Bedjanian and Nguyen Citation2010; Shiraiwa et al. Citation2011) and theoretical chemistry studies (Maranzana et al. Citation2005; Giordana et al. Citation2008) investigated the reactivity of ozone with soot particles and with PAHs deposited on different substrates. From these studies, the reactivity of O3 with soot can be explained by a multi-step mechanism starting with (1) the physisorption of O3 on the surface, which then undergoes dissociation to form a chemisorbed oxygen atom bound to the aromatic ring, and (2) the release of O2 in the gas phase. Ketones and aldehydes have been identified as the main final products of the reaction leading to a local increase of the polarity of the surface, which enhances the uptake of water molecules. In particular, Maranzana et al., (Maranzana et al. Citation2005; Giordana et al. Citation2008) concluded from density function theory calculations that the energy barrier controlling the ozonization of internal positions is too high to be a viable option in atmospheric processes, and that it would be only possible for large graphene-like structures or very large concentration of O3 and only after the reaction of the border positions. Therefore, the assumption that reactions with ozone takes place more favorably where the C–H bonds are abundant seems to be reasonable. As mentioned above, the chemical composition at soot surface evolves with the soot growth in the flame between 70 and 130 mm HAB. It is expected that young soot particles found at 70 mm are more prone to be oxidized than the mature ones found at 130 mm. This is consistent with the recent findings of Camacho et al. (Citation2015) showing that the surface of nascent soot is considerably more reactive towards oxidation than that of mature soot. All the above considerations lead to explain that ozone reaction with soot sampled at low HAB (70 mm) is enhanced if compared to the reactivity of mature soot (130 mm). This may reasonably explain why CCN activation of soot sampled at 130 mm is lower compared to soot sampled at 70 mm. The investigated flame is non-smoking, meaning that the soot particles formed in the flame are fully oxidized. This oxidation takes place from the peak soot volume location around 130 mm. Thus, soot particles collected at 160 mm are partly oxidized. It is likely that this in-flame oxidation combined with ex-situ ozone exposure increases the activation of the soot particles resulting in a higher activated fraction at 160 mm in comparison with that of mature soot particles at 130 mm.
4. Conclusion and atmospheric implications
In this work, we investigated the activation of soot particles aged under various ozone exposures, to form CCNs. To the best of our knowledge, this is the first time that such investigation is performed with soot particles sampled from a kerosene spray flame as a function of the sampling HAB.
The activated fraction of freshly emitted soot particles of any tested mobility diameter in the range 150–400 nm is always very low, and as such they can be classified as highly hydrophobic materials. However, reaction with ozone at exposure larger than 3.6 × 10¹⁶ molecules per cm−3·s results in particle activation and formation of CCNs. In particular, young soot particles sampled as low in the flame as 70 mm HAB feature the largest activated fraction. This behavior is consistent with the higher H/C ratio found on the compounds adsorbed on young soot particle surface in comparison with mature soot particles. This behavior might represent an indirect evidence of the prevalent ozonization of the border positions of aromatic HCs. The presence of a denuder and the high-dilution ratio employed during sampling ensure that the flame gas phase is efficiently separated from the reaction environment. Therefore, the observed activation should result from heterogeneous reactions between ozone and the surface of the soot.
Ozone concentration used in this study (1.20 ppm) is much higher than in the free troposphere (0.07 ppm, Lin et al. Citation2015). Unfortunately, the analytical function Sc = f (ozone exposure) is not known, and therefore estimations of Sc at high-ozone exposure necessarily rely on data extrapolation. The analysis of two extreme cases (linear and exponential extrapolations of the data in ) could be used to give a rough estimation of Sc at exposure as high as 2.0 × 10¹⁷ molecules per cm−3·s that corresponds to 0.07 ppm of ozone in the free troposphere during roughly 64 h (2.7 d). The global mean atmospheric lifetime of soot is estimated to be ∼4 d (Wang et al. Citation2014) and is mainly governed by wet deposition rate. Noticeably, the resulting range of values of Sc (0.6–1.2%) is well consistent with typical values found during cloud formation (0.2–1.0%) as shown by Pruppacher et al. (Citation1997). So, if only ozone oxidation is considered, our observations confirm that soot particles may act as CCN in atmospheric conditions.
Besides ozone oxidation, other atmospheric aging processes may transform soot into CCN. Hydroxyl radical (OH) is ubiquitous as atmospheric oxidant, however, when compared to ozone, its atmospheric lifetime is very short (ms to s) and it will react first with species in the gas phase. Heterogeneous reactivity with OH has to be considered for highly polluted air masses, near intense emission sources where OH concentration may be as large as a few ppm, e.g., the exit of aircraft engine (Kärcher et al. Citation1996). Finally, condensation of species such as sulfates or volatile organic compounds on soot can make the particle more hygroscopic. In the current state of knowledge, it is difficult to describe with a detailed mechanism the aging of soot, in real atmospheric conditions including all the physical and chemical atmospheric processes (Browne et al. Citation2015). For this reason, laboratory measurements are still needed in order to describe and to quantify each process individually.
UAST_1472367_Supplemental_File.zip
Download Zip (60.6 KB)Acknowledgments
The authors thank Sylvie Gosselin for GC/MS analysis of the kerosene fuel and Christopher Betrancourt for the determination of denuder efficiency by GC analysis.
Additional information
Funding
References
- ACI 2016, “Releases Its 2016 World Airport Traffic Report”. Media Release, Airports Council International, Montreal, www.aci.aero
- Albrecht, B. A. (1989). Aerosols, Cloud Microphysics, and Fractional Cloudiness. Science, 245:1227–1231.
- Andreae, M. O. and Gelencsér, A. (2006). Black Carbon or Brown Carbon? The Nature of Light-Absorbing Carbonaceous Aerosols. Atmospheric Chem. Phys., 6:3131–3148.
- Apicella, B., Carpentieri, A., Alfè, M., Barbella, R., Tregrossi, A., Pucci, P., and Ciajolo, A. (2007). Mass Spectrometric Analysis of Large PAH in a Fuel-Rich Ethylene Flame. Proc. Combust. Inst., 31:547–553.
- Bedjanian, Y. and Nguyen, M. L. (2010). Kinetics of the Reactions of Soot Surface-Bound Polycyclic Aromatic Hydrocarbons with O3. Chemosphere, 79:387–393.
- Bejaoui, S., Batut, S., Therssen, E., Lamoureux, N., Desgroux, P., and Liu, F. (2015). Measurements and Modeling of Laser-Induced Incandescence of Soot at Different Heights in a Flat Premixed Flame. Appl. Phys. B, 118:449–469.
- Bescond, A., Yon, J., Ouf, F. X., Ferry, D., Delhaye, D., Gaffié, D., Coppalle, A., and Rozé, C. (2014). Automated Determination of Aggregate Primary Particle Size Distribution by TEM Image Analysis: Application to Soot. Aerosol Sci. Technol., 48:831–841.
- Bonczyk, P. A. and Hall, R. J. (1991). Fractal Properties of Soot Agglomerates. Langmuir, 7:1274–1280.
- Bond, T. C., Doherty, S. J., Fahey, D. W., Forster, P. M., Berntsen, T., DeAngelo, B. J., Flanner, M. G., Ghan, S., Kärcher, B., Koch, D., Kinne, S., Kondo, Y., Quinn, P. K., Sarofim, M. C., Schultz, M. G., Schulz, M., Venkataraman, C., Zhang, H., Zhang, S., Bellouin, N., Guttikunda, S. K., Hopke, P. K., Jacobson, M. Z., Kaiser, J. W., Klimont, Z., Lohmann, U., Schwarz, J. P., Shindell, D., Storelvmo, T., Warren, S. G., and Zender, C. S. (2013). Bounding the Role of Black Carbon in the Climate System: A Scientific Assessment. J. Geophys. Res. Atmos., 118:5380–5552.
- Browne, E. C., Franklin, J. P., Canagaratna, M. R., Massoli, P., Kirchstetter, T. W., Worsnop, D. R., Wilson, K. R., and Kroll, J. H. (2015). Changes to the Chemical Composition of Soot From Heterogeneous Oxidation Reactions. J. Phys. Chem. A, 119:1154–1163.
- Camacho, J., Tao, Y., and Wang, H. (2015). Kinetics of Nascent Soot Oxidation by Molecular Oxygen in a Flow Reactor. Proc. Combust. Inst., 35:1887–1894.
- Chowdhury, S., Boyette, W. R., and Roberts, W. L. (2017). Time-Averaged Probability Density Functions of Soot Nanoparticles Along the Centerline of a Piloted Turbulent Diffusion Flame Using a Scanning Mobility Particle Sizer. J. Aerosol Sci., 106(Supplement C):56–67.
- Dakhel, P. M., Lukachko, S. P., Waitz, I. A., Miake-Lye, R. C., and Brown, R. C. (2005). Post-combustion Evolution of Soot Properties in an Aircraft Engine., in ASME Turbo Expo 2005: Power for Land, Sea, and Air, Reno, Nevada, USA, 6–9 June.
- Delhaye, D., Ouf, F.-X., Ferry, D., Ortega, I. K., Penanhoat, O., Peillon, S., Salm, F., Vancassel, X., Focsa, C., Irimiea, C., Harivel, N., Perez, B., Quinton, E., Yon, J., and Gaffie, D. (2017). The MERMOSE Project: Characterization of Particulate Matter Emissions of a Commercial Aircraft Engine. J. Aerosol Sci., 105(Supplement C):48–63.
- Demirdjian, B., Ferry, D., Suzanne, J., Popovicheva, O., Persiantseva, N., and Shonija, N. (2007). Heterogeneities in the Microstructure and Composition of Aircraft Engine Combustor Soot: Impact on the Water Uptake. J. Atmospheric Chem., 56:83–103.
- Dobbins, R. A., Fletcher, R. A., Benner, B. A., and Hoeft, S. (2006). Polycyclic Aromatic Hydrocarbons in Flames, in Diesel Fuels, and in Diesel Emissions. Combust. Flame, 144:773–781.
- Dobbins, R. A., Fletcher, R. A., and Chang, H.-C. (1998). The Evolution of Soot Precursor Particles in a Diffusion Flame. Combust. Flame, 115:285–298.
- Eyers, C. J., Norman, P., Middel, J., Plohr, M., Michot, S., Atkinson, K., and Christou, R. A. (2004). AERO2K global aviation emissions inventories for 2002 and 2025, Project Report 04/01113, 144 S. Köln-Porz, Germany.
- Faccinetto, A., Desgroux, P., Ziskind, M., Therssen, E., and Focsa, C. (2011). High-Sensitivity Detection of Polycyclic Aromatic Hydrocarbons Adsorbed Onto Soot Particles Using Laser Desorption/Laser Ionization/Time-of-Flight Mass Spectrometry: An Approach to Studying the Soot Inception Process in Low-Pressure Flames. Combust. Flame, 158:227–239.
- Giordana, A., Maranzana, A., Ghigo, G., Causa, M., and Tonachini, G. (2008). Soot platelets and PAHs with an odd number of unsaturated carbon atoms and π electrons: theoretical study of their spin properties and interaction with ozone. J. Phys. Chem. A, 112:973–982
- Han, C., Liu, Y., Liu, C., Ma, J., and He, H. (2012). Influence of Combustion Conditions on Hydrophilic Properties and Microstructure of Flame Soot. J. Phys. Chem. A, 116:4129–4136.
- Henning, S., Ziese, M., Kiselev, A., Saathoff, H., Möhler, O., Mentel, T., Buchholz, A., Spindler, C., Michaud, V., and Monier, M. (2012). Hygroscopic Growth and Droplet Activation of Soot Particles: Uncoated, Succinic or Sulfuric Acid Coated. Atmospheric Chem. Phys., 12:4525–4537.
- Hurt, R. H., Crawford, G. P., and Shim, H.-S. (2000). Equilibrium Nanostructure of Primary Soot Particles. Proc. Combust. Inst., 28:2539–2546.
- Ishiguro, T., Takatori, Y., and Akihama, K. (1997). Microstructure of Diesel Soot Particles Probed by Electron Microscopy: First Observation of Inner Core and Outer Shell. Combust. Flame, 108:231–234.
- Jones, C. C., Chughtai, A. R., Murugaverl, B., and Smith, D. M. (2004). Effects of Air/Fuel Combustion Ratio on the Polycyclic Aromatic Hydrocarbon Content of Carbonaceous Soots From Selected Fuels. Carbon, 42:2471–2484.
- Kärcher, B., Hirschberg, M. M., and Fabian, P. (1996). Small-Scale Chemical Evolution of Aircraft Exhaust Species at Cruising Altitudes. J. Geophys. Res. Atmospheres, 101:15169–15190.
- Karjalainen, P., Pirjola, L., Heikkilä, J., Lähde, T., Tzamkiozis, T., Ntziachristos, L., Keskinen, J., and Rönkkö, T. (2014). Exhaust Particles of Modern Gasoline Vehicles: A Laboratory and an On-Road Study. Atmos. Environ., 97(Supplement C):262–270.
- Khalizov, A. F., Zhang, R., Zhang, D., Xue, H., Pagels, J., and McMurry, P. H. (2009). Formation of Highly Hygroscopic Soot Aerosols Upon Internal Mixing With Sulfuric Acid Vapor. J. Geophys. Res. Atmospheres 1984–2012, 114.
- Kim, B., Fleming, G., Balasubramanian, S., Malwitz, A., Lee, J., Ruggiero, J., Waitz, I., Klima, K., Stouffer, V., Long, L., and others. (2005). System for Assessing Aviation’s Global Emissions (SAGE). Version 1.5, Technical Manual, Federal Aviation Administration, Office of Environment and Energy. FAA-EE-2005-01.
- Kim, B. Y., Fleming, G. G., Lee, J. J., Waitz, I. A., Clarke, J.-P., Balasubramanian, S., Malwitz, A., Klima, K., Locke, M., Holsclaw, C. A., Maurice, L. Q., and Gupta, M. L. (2007). System for Assessing Aviation’s Global Emissions (SAGE), Part 1: Model Description and Inventory Results. Transp. Res. Part Transp. Environ., 12:325–346.
- Köhler, K. A., DeMott, P. J., Kreidenweis, S. M., Popovicheva, O. B., Petters, M. D., Carrico, C. M., Kireeva, E. D., Khokhlova, T. D., and Shonija, N. K. (2009). Cloud Condensation Nuclei and Ice Nucleation Activity of Hydrophobic and Hydrophilic Soot Particles. Phys. Chem. Chem. Phys., 11:7906–7920.
- Kotzick, R. and Niessner, R. (1999). The Effects of Aging Processes on Critical Supersaturation Ratios of Ultrafine Carbon Aerosols. Atmos. Environ., 33:2669–2677.
- Kotzick, R., Panne, U., and Niessner, R. (1997). Changes in Condensation Properties of Ultrafine Carbon Particles Subjected to Oxidation by Ozone. J. Aerosol Sci., 28:725–735.
- Lambe, A., Ahern, A., Wright, J., Croasdale, D., Davidovits, P., and Onasch, T. (2015). Oxidative Aging and Cloud Condensation Nuclei Activation of Laboratory Combustion Soot. J. Aerosol Sci., 79:31–39.
- Lance, S., Nenes, A., Medina, J., and Smith, J. (2006). Mapping the Operation of the DMT Continuous Flow CCN Counter. Aerosol Sci. Technol., 40:242–254.
- Lee, D. S., Fahey, D. W., Forster, P. M., Newton, P. J., Wit, R. C., Lim, L. L., Owen, B., and Sausen, R. (2009). Aviation and Global Climate Change in the 21st Century. Atmos. Environ., 43(22):3520–3537.
- Lee, D. S., Pitari, G., Grewe, V., Gierens, K., Penner, J. E., Petzold, A., Prather, M. J., Schumann, U., Bais, A., Berntsen, T., and others (2010). Transport Impacts on Atmosphere and Climate: Aviation. Atmos. Environ., 44:4678–4734.
- Lemaire, R., Faccinetto, A., Therssen, E., Ziskind, M., Focsa, C., and Desgroux, P. (2009a). Experimental Comparison of Soot Formation in Turbulent Flames of Diesel and Surrogate Diesel Fuels. Proc. Combust. Inst., 32:737–744.
- Lemaire, R., Maugendre, M., Schuller, T., Therssen, E., and Yon, J. (2009). Original Use of a Direct Injection High Efficiency Nebulizer for the Standardization of Liquid Fuels Spray Flames. Rev. Sci. Instrum., 80:105105.
- Lemaire, R., Therssen, E., and Desgroux, P. (2010). Effect of Ethanol Addition in Gasoline and Gasoline–Surrogate on Soot Formation in Turbulent Spray Flames. Fuel, 89:3952–3959.
- Lemaire, R., Therssen, E., Pauwels, J. F., and Desgroux, P. (2009b). Experimental Comparison of Soot Formation in Turbulent Flames of Kerosene and Surrogate Model Fuels. KIT Scientific Publishing, Karlsruhe, Germany.
- Lewis, J. S., Niedzwiecki, R. W., Bahr, D. W., Bullock, S., Cumpsty, N., Dodds, W., DuBois, D., and Epstein, A. (1999). Aircraft Technology and Its Relation to Emissions, in Aviation and the Global Atmosphere, J. E. Penner, D. H. Lister, D. J. Griggs, D. J. Dokken, M. McFarland, eds., Cambridge University Press, Cambridge, UK.
- Liati, A., Brem, B. T., Durdina, L., Vögtli, M., Arroyo Rojas Dasilva, Y., Dimopoulos Eggenschwiler, P., and Wang, J. (2014). Electron Microscopic Study of Soot Particulate Matter Emissions from Aircraft Turbine Engines. Environ. Sci. Technol., 48:10975–10983.
- Lin, M., Horowitz, L. W., Cooper, O. R., Tarasick, D., Conley, S., Iraci, L. T., Johnson, B., Leblanc, T., Petropavlovskikh, I., and Yates, E. L. (2015). Revisiting the Evidence of Increasing Springtime Ozone Mixing Ratios in the Free Troposphere Over Western North America. Geophys. Res. Lett., 42:8719–8728.
- Mahashabde, A., Wolfe, P., Ashok, A., Dorbian, C., He, Q., Fan, A., Lukachko, S., Mozdzanowska, A., Wollersheim, C., Barrett, S. R., and others (2011). Assessing the Environmental Impacts of Aircraft Noise and Emissions. Prog. Aerosp. Sci., 47:15–52.
- Maranzana, A., Serra, G., Giordana, A., Tonachini, G., Barco, G., and Causà, M. (2005). Ozone Interaction With Polycyclic Aromatic Hydrocarbons and Soot in Atmospheric Processes: Theoretical Density Functional Study by Molecular and Periodic Methodologies. J. Phys. Chem. A, 109:10929–10939.
- Maricq, M. M. (2014). Examining the Relationship Between Black Carbon and Soot in Flames and Engine Exhaust. Aerosol Sci. Technol., 48:620–629.
- Maricq, M. M. (2011). Physical and Chemical Comparison of Soot in Hydrocarbon and Biodiesel Fuel Diffusion Flames: A Study of Model and Commercial Fuels. Combust. Flame, 158:105–116.
- Masiol, M. and Harrison, R. M. (2014). Aircraft Engine Exhaust Emissions and Other Airport-Related Contributions to Ambient Air Pollution: A Review. Atmos. Environ., 95:409–455.
- McCabe, J. and Abbatt, J. P. D. (2008). Heterogeneous Loss of Gas-Phase Ozone on n-Hexane Soot Surfaces: Similar Kinetics to Loss on Other Chemically Unsaturated Solid Surfaces. J. Phys. Chem. C, 113:2120–2127.
- Meyer, N. K. and Ristovski, Z. D. (2007). Ternary Nucleation as a Mechanism for the Production of Diesel Nanoparticles: Experimental Analysis of the Volatile and Hygroscopic Properties of Diesel Exhaust Using the Volatilization and Humidification Tandem Differential Mobility Analyzer. Environ. Sci. Technol., 41:7309–7314.
- Olsen, S. C., Wuebbles, D. J., and Owen, B. (2013). Comparison of Global 3-D Aviation Emissions Datasets. Atmos Chem Phys, 13:429–441.
- Oubal, M., Picaud, S., Rayez, M.-T., and Rayez, J.-C. (2010). Water Adsorption on Oxidized Single Atomic Vacancies Present at the Surface of Small Carbonaceous Nanoparticles Modeling Soot. ChemPhysChem, 11:4088–4096.
- Ouf, F. X., Yon, J., Ausset, P., Coppalle, A., and Maillé, M. (2010). Influence of Sampling and Storage Protocol on Fractal Morphology of Soot Studied by Transmission Electron Microscopy. Aerosol Sci. Technol., 44:1005–1017.
- Parent, P., Laffon, C., Marhaba, I., Ferry, D., Regier, T. Z., Ortega, I. K., Chazallon, B., Carpentier, Y., and Focsa, C. (2016). Nanoscale Characterization of Aircraft Soot: A High-Resolution Transmission Electron Microscopy, Raman Spectroscopy, X-Ray Photoelectron and Near-Edge X-Ray Absorption Spectroscopy Study. Carbon, 101:86–100.
- Penner, J. E. (1999). Aviation and the Global Atmosphere: a Special Report of the Intergovernmental Panel on Climate Change. Cambridge University Press, Cambridge, UK.
- Perraudin, E., Budzinski, H., and Villenave, E. (2007). Identification and Quantification of Ozonation Products of Anthracene and Phenanthrene Adsorbed on Silica Particles. Atmos. Environ., 41:6005–6017.
- Petters, M. and Kreidenweis, S. (2007). A Single Parameter Representation of Hygroscopic Growth and Cloud Condensation Nucleus Activity. Atmos Chem Phys, 7:1961–1971.
- Petzold, A., Busen, R., Schröder, F. P., Baumann, R., Kuhn, M., Ström, J., Hagen, D. E., Whitefield, P. D., Baumgardner, D., Arnold, F., and others (1997). Near-Field Measurements on Contrail Properties From Fuels With Different Sulfur Content. J. Geophys. Res., 102:29867–29880.
- Petzold, A., Stein, C., Nyeki, S., Gysel, M., Weingartner, E., Baltensperger, U., Giebl, H., Hitzenberger, R., Döpelheuer, A., and Vrchoticky, S. (2003). Properties of Jet Engine Combustion Particles During the PartEmis Experiment: Microphysics and chemistry. Geophys. Res. Lett., 30:1719.
- Pincus, R. and Baker, M. B. (1994). Effect of Precipitation on the Albedo Susceptibility of Clouds in the Marine Boundary Layer. Nature, 372:250–252.
- Popovicheva, O. B., Persiantseva, N. M., Kireeva, E. D., Khokhlova, T. D., and Shonija, N. K. (2011). Quantification of the Hygroscopic Effect of Soot Aging in the Atmosphere: Laboratory Simulations. J. Phys. Chem. A, 115:298–306.
- Popovicheva, O. B., Persiantseva, N. M., Tishkova, V., Shonija, N. K., and Zubareva, N. A. (2008). Quantification of Water Uptake by Soot Particles. Environ. Res. Lett., 3:025009.
- Pruppacher, H. R., Klett, J. D., and Wang, P. K. (1997). Microphysics of Clouds and Precipitation, Springer.
- Roberts, G. and Nenes, A. (2005). A Continuous-Flow Streamwise Thermal-Gradient CCN Chamber for Atmospheric Measurements. Aerosol Sci. Technol., 39:206–221.
- Saffaripour, M., Kholghy, M., Dworkin, S. B., and Thomson, M. J. (2013). A Numerical and Experimental Study of Soot Formation in a Laminar Coflow Diffusion Flame of a Jet A-1 Surrogate. Proc. Combust. Inst., 34:1057–1065.
- Samson, R. J., Mulholland, G. W., and Gentry, J. W. (1987). Structural Analysis of Soot Agglomerates. Langmuir, 3:272–281.
- Santoro, R. J. and Semerjian, H.G. (1985). Soot Formation in Diffusion Flames: Flow Rate, Fuel Species and Temperature Effects. Symposium (International) on Combustion, Elsevier, 997–1006.
- Seinfeld, J. H., Pandis, S. N., and Noone, K. (1998). Atmospheric Chemistry and Physics: From Air Pollution to Climate Change. John Wiley and Sons, New York, USA.
- Shiraiwa, M., Sosedova, Y., Rouvière, A., Yang, H., Zhang, Y., Abbatt, J. P., Ammann, M., and Pöschl, U. (2011). The Role of Long-Lived Reactive Oxygen Intermediates in the Reaction of Ozone With Aerosol Particles. Nat. Chem., 3:291–295.
- Simone, N. W., Stettler, M. E. J., and Barrett, S. R. H. (2013). Rapid Estimation of Global Civil Aviation Emissions With Uncertainty Quantification. Transp. Res. Part Transp. Environ., 25:33–41.
- Smooke, M. D., Long, M. B., Connelly, B. C., Colket, M. B., and Hall, R. J. (2005). Soot Formation in Laminar Diffusion Flames. Combust. Flame, 143:613–628.
- Stocker, T. F., Qin, D., Plattner, G. K., Tignor, M., Allen, S. K., Boschung, J., Nauels, A., Xia, Y., Bex, B., and Midgley, B. M. (2013). IPCC, 2013: climate change 2013: the physical science basis. Contribution of working group I to the fifth assessment report of the intergovernmental panel on climate change. Cambridge University Press, Cambridge, UK.
- Stubenrauch, C. J. and Schumann, U. (2005). Impact of Air Traffic on Cirrus Coverage. Geophys. Res. Lett., 32: L14813. doi:10.1029/2005GL022707.
- Sullivan, R., Moore, M., Petters, M., Kreidenweis, S., Roberts, G., and Prather, K. (2009). Effect of Chemical Mixing State on the Hygroscopicity and Cloud Nucleation Properties of Calcium Mineral Dust Particles. Atmospheric Chem. Phys., 9:3303–3316.
- Tritscher, T., Jurányi, Z., Martin, M., Chirico, R., Gysel, M., Heringa, M. F., DeCarlo, P. F., Sierau, B., Prévôt, A. S., and Weingartner, E. (2011). Changes of Hygroscopicity and Morphology During Ageing of Diesel Soot. Environ. Res. Lett., 6:034026.
- Twomey, S. (1959). The Nuclei of Natural Cloud Formation Part II: The Supersaturation in Natural Clouds and the Variation of Cloud Droplet Concentration. Pure Appl. Geophys., 43:243–249.
- Wang, H. (2011). Formation of Nascent Soot and Other Condensed-Phase Materials in Flames. Proc. Combust. Inst., 33:41–67.
- Wang, X., Heald, C. L., Ridley, D. A., Schwarz, J. P., Spackman, J. R., Perring, A.E., Coe, H., Liu, D., and Clarke, A. D. (2014). Exploiting Simultaneous Observational Constraints on Mass and Absorption to Estimate the Global Direct Radiative Forcing of Black Carbon and Brown Carbon. Atmospheric Chem. Phys., 14:10989–11010.
- Weingartner, E., Burtscher, H., and Baltensperger, U. (1997). Hygroscopic Properties of Carbon and Diesel Soot Particles. Atmos. Environ., 31:2311–2327.
- Wittbom, C., Eriksson, A. C., Rissler, J., Carlsson, J. E., Roldin, P., Nordin, E. Z., Nilsson, P. T., Swietlicki, E., Pagels, J. H., and Svenningsson, B. (2014). Cloud Droplet Activity Changes of Soot Aerosol Upon Smog Chamber Ageing. Atmospheric Chem. Phys., 14:9831–9854.
- Yon, J., Lemaire, R., Therssen, E., Desgroux, P., Coppalle, A., and Ren, K. F. (2011). Examination of Wavelength Dependent Soot Optical Properties of Diesel and Diesel/Rapeseed Methyl Ester Mixture by Extinction Spectra Analysis and LII Measurements. Appl. Phys. B, 104:253–271.
- Zhang, R., Khalizov, A. F., Pagels, J., Zhang, D., Xue, H., and McMurry, P. H. (2008). Variability in Morphology, Hygroscopicity, and Optical Properties of Soot Aerosols During Atmospheric Processing. Proc. Natl. Acad. Sci., 105:10291–10296.
- Zuberi, B., Johnson, K. S., Aleks, G. K., Molina, L. T., Molina, M. J., and Laskin, A. (2005). Hydrophilic Properties of Aged Soot. Geophys. Res. Lett., 32.