
Abstract
Hygroscopic growth of inhaled aerosols plays an important role in determining particle trajectories and hence local deposition sites. Accurate predictions of airway temperature and humidity as well as droplet–vapor interaction are critical for the calculation of hygroscopic growth. Employing a simple mouth–throat (MT) model as a computer simulation test bed, the effects of interactive heat transfer between air–droplet flow and mucus-tissue-layer have been analyzed. For a steady inhalation flow rate of 15 L/min, air temperature and relative humidity distributions affecting droplet growth, deposition efficiency (DE), and deposition pattern have been compared for different thermal airway-wall conditions. The effects considered include: (i) the latent heat of mucus-layer evaporation and convection heat transfer; (ii) convection heat transfer only; and (iii) mucus-tissue layer with constant temperature. As the most important outcome, the validated modeling results show that thermal airflow and mucus-layer interaction can significantly reduce hygroscopic growth and thereby decrease the DE of multicomponent droplets up to 10%. The modeling framework presented can be readily expanded to other systems.
Copyright © 2018 American Association for Aerosol Research
EDITOR:
1. Introduction
Accurate and realistic computer simulation of fluid-particle dynamics and droplet-size changes in human lung airways has been an important topic for evaluating the toxic effects of pollutants or targeted delivery of drug-aerosols. Hygroscopic droplet growth is determined by the aerosol–vapor interaction. Li et al. (Citation1992) obtained experimentally the growth ratio of NaCl particles under constant RH conditions, while Tu and Ray (Citation2005) recorded the dynamic growth of glycerol droplets for cases of transient RH. Zhang et al. (Citation2004b) studied numerically the vaporization, transport, and deposition of JP-8 fuel droplets in a human upper airway system. Furthermore, Zhang et al. (Citation2006b) simulated the saline droplet deposition in an upper airway model, and Zhang et al. (Citation2012a) analyzed the vapor deposition of acrolein, 1,3-butadiene, acetaldehyde, and CO generated from tobacco smoke in subject-specific lung airways. Feng et al. (Citation2016) proposed a comprehensive computational fluid-particle dynamics model for the prediction of transport, phase change, and deposition of multicomponent droplet–vapor mixtures in a basic human lung airway model. Recently, the effects of the aerosol–vapor interaction on aerosol properties also attracted attention. Ivey et al. (Citation2017) investigated the morphology of particles emitted from pressurized metered-dose inhalers for different RH conditions. It was suggested that the beclomethasone dipropionate (BDP) particles could form porous surfaces due to rapid evaporation of the propellant-cosolvent-BDP droplet.
Different approaches have been applied to manipulate aerosol-size change, e.g., selection of a specific carrier gas (Javaheri et al. Citation2013), or heating and adding water-absorbing particles (Javaheri and Finlay Citation2013). Concerning drug-carrying droplets, Longest et al. (Citation2010) proposed the method of “enhanced condensational growth” to increase the deposition of submicron hygroscopic aerosols in the lung airways with very high relative humidity (RH). Feng et al. (Citation2015) suggested that the hygroscopic growth is sensitive to small variations in the physical and chemical properties of water; indeed, Chen et al. (Citation2017) showed that a small change in saturation pressure of water vapor can cause a large difference in particle growth ratio. In human airways, the air temperature determines saturation pressure of water vapor, and the air humidity controls local hygroscopic growth. Therefore, it is of vital importance to accurately predict the distributions of both air temperature and humidity. However, the airway temperature is typically set at a uniform value of 37 °C with the RH-value above the mucus being 99.5%. In contrast, Wu et al. (Citation2014) proposed the use of two regions, i.e., a mucus-tissue layer and an airway lumen, to predict the temperature and RH distributions in human airway models. They validated the results with in vivo experimental data (McFadden et al. Citation1985). However, the simulations of Wu et al. (Citation2014) did not include the transport and deposition of aerosols, let alone that of hygroscopic aerosols. Nevertheless, the present analysis relies on their model for temperature and RH distributions.
The objective of the present study is to numerically investigate the transport and deposition of hygroscopic multicomponent droplets with more realistic thermal boundary conditions. The modeling framework can be readily expanded beyond the simple mouth–throat (MT) airway configuration employed as a computational test bed. Specifically, droplet deposition effects are compared for different thermal airway-wall conditions, considering: (i) mucus-layer evaporation and convection heat transfer; (ii) convection heat transfer only; and (iii) mucus-tissue region with constant temperature of 37 °C. Conduction in the airway mucus-tissue region is included for all simulations. The resulting distributions of temperature and RH in the MT airway as well as hygroscopic droplet deposition and droplet escape are discussed.
2. Theory
2.1. Background information
In order to analyze realistic effects of thermal boundary conditions on hygroscopic droplet transport and deposition, a more detailed composite of the airway wall in terms of tissue and mucus layer were considered (). Specifically, the simulations covered three transport phenomena, i.e., two-phase flow, airway-wall heat transfer, and droplet–vapor interaction. In order to capture the characteristics of laminar-to-turbulent air–vapor mixture flow, the transition Shear Stress Transport (SST) model was applied. Assuming dilute air–droplet flow, the discrete phase model (DPM) was used to predict the one-way coupled droplet trajectories. After calculating the water-vapor flux at the air–mucus interface, the latent heat of water vaporization in the mucus layer could be determined. The airway-wall heat transfer calculation yielded the mucus layer temperature that allowed to predict realistic RH and temperature distributions in the MT airway (Wu et al. Citation2014). The droplet–vapor interaction was embedded into the DPM via user-defined functions (UDFs). As the airflow conditions, e.g., velocity, temperature, and vapor mass fraction, affect the droplet–vapor dynamics, the droplet–vapor interactions determine the droplet properties, i.e., density and diameter. Subsequently, the droplet–vapor interactions influence the droplet trajectories and hence deposition sites and local concentrations.
Figure 1. 2-D schematics of the simulation logics for hygroscopic droplet transport with thermal airway-wall.
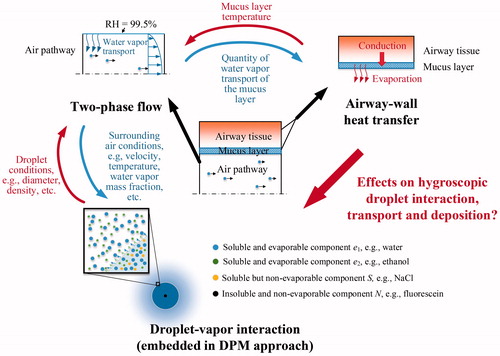
The droplets containing water, ethanol, sodium chloride and fluorescein were released at the mouth inlet. The four constituents represent three typical components which may exist in the droplet (or particle), i.e., soluble and evaporable components (water and ethanol), soluble but non-evaporable components (sodium chloride), and insoluble and non-evaporable components (fluorescein). These categories could reduce the complexity when modeling the aerosols with complexed components. More details could be found in our previous study (Chen et al. Citation2017). The water and ethanol would evaporate rapidly due to the low water and ethanol vapor pressures in air until a solid particle remained, containing just salt and fluorescein. However, if the particle reached the high RH-region near the mucus, it could absorb water vapor and hence form a droplet again.
2.2. Governing equations for continuous phase
Assuming one-way coupling for this dilute particle suspension flow, any impact of the volume of the aerosols has been neglected.
2.2.1. Continuity equation
(1)
where
and
are fluid density and velocity, respectively.
2.2.2. Momentum equation
(2)
where p is the fluid pressure,
is the dynamic viscosity of the fluid,
is the Kronecker delta, and
is the fluctuating component of the fluid velocity.
2.2.3. Transition SST model
In order to capture the flow separation in the pharynx (Heenan et al. Citation2003) and possible low-Reynolds-number turbulence, the transition SST model (Menter et al. Citation2006b) was selected to predict the airflow and water vapor mixture. The following EquationEquations (3)–(6) are the modified k equation, ω equation, intermittency γ transport equation, and transition momentum thickness in terms of the Reynolds number , respectively. EquationEquations (3)
(3) and Equation(4)
(4) are the same as the original SST model (Menter Citation1994) except for the terms
and
, which are the production and destruction terms of turbulence kinetic energy (TKE), modified with intermittency γ (Menter et al. Citation2006a, Citationb).
(3)
where k is the TKE,
is the turbulent viscosity, and
is turbulent Prandtl number for k.
(4)
where ω is specific dissipation rate,
is the turbulent eddy viscosity, and
is the cross-diffusion term.
(5)
where
and
are transition source terms,
and
are destruction source terms.
(6)
where
is the source term, and
is the model constant equal to 2.0.
2.2.4. Species transport equation
In order to calculate the humidity variations in the airway for the droplet–vapor interaction, the air flow is assumed to consist of two species, i.e., dry air and water vapor. The species transport equation reads:
(7)
where
is the mass fraction of species s,
is the mass diffusion coefficient for species s,
is the turbulent viscosity, and
is the turbulent Schmidt number (Zhang and Kleinstreuer Citation2003).
2.2.5. Energy equation for air–vapor mixture
The energy of the air–vapor mixture affects its temperature, which determines the saturation pressure of the water vapor at the air–mucus interface. Thus, it is needed for the prediction of the RH. The energy equation for the mixture is defined as:
(8)
where k is the thermal conductivity,
is the turbulent thermal conductivity,
is the specific heat of the fluid, and the total enthalpy H is defined as:
(9)
where
and
are the mass fraction and enthalpy of species s, respectively.
2.3. Governing equations for discrete phase
The Lagrangian approach is applied to predict the trajectories of the multicomponent droplets. Because of the droplet–vapor interaction, the droplet mass may change when travelling in the MT airway. Thus, in addition to solve droplet transport equations, droplet mass and energy balances also have to be considered.
2.3.1. Droplet/particle transport equation
In light of the small diameter of the inhalable aerosols, the droplets and the solid particles formed after the initial evaporation are assumed to be spherical for calculating their drag forces. Considering that the aerosol-to-air density ratio is relatively large, aerosol rotation was neglected. Thus, the trajectories of the aerosols are determined by drag force and gravity alone:
(10)
where
is the aerosol mass,
is the aerosol velocity,
is the aerosol diameter,
is the drag coefficient for the aerosol, and
is the gravitational acceleration.
The eddy–aerosol interaction is described using the eddy interaction model, which is also known as the random walk model (Gosman and Loannides Citation1983; Matida et al. Citation2004). The anisotropic eddies in the near-wall region are described by applying the damping functions in different directions (Kim et al. Citation1987; Wang and James Citation1999). Matida et al. (Citation2004) suggested that the near-wall correction for the anisotropic eddy could improve the predicted particle deposition efficiency (DE) when eddy interaction model was applied. Details of this model could be found in our previous paper (Chen et al. Citation2017).
2.3.2. Droplet mass balance with droplet–vapor integration
Droplet mass change can be predicted by calculating the mass fluxes of evaporable components on the droplet surface (Longest and Kleinstreuer Citation2005; Zhang et al. Citation2012b; Feng et al. Citation2016):
(11)
where the average mass flux of component s,
, can be calculated by the mass fractions of component s on the droplet surface
and in the fluid phase
:
(12)
where Sh is the Sherwood number,
is the mass diffusivity of component s and
is the Fuchs–Knudsen number correction.
2.3.3. Droplet energy balance
The change in droplet energy, i.e., temperature, is caused by convection and vapor condensation/evaporation. Thus, the governing equation reads:
(13)
where
is the specific heat of the droplet,
is the droplet temperature, Nu is the Nusselt number,
is the surface area of the droplet,
is the latent heat of species s, and
is the average mass flux of species s.
2.4. Governing equation for mucus and tissue layers
Since the velocity of mucus movement is much less than the airflow (Foster et al. Citation1982), the relative motion of the mucus is neglected. As the airway tissue comprises a high amount of water, the mucus and tissue layers are assumed to have a uniform thermodynamic property the same as water, which is suggested by Wu et al. (Citation2014). Thus, the heat conduction within the mucus-tissue layer can be modeled as in a solid material. However, the temperature of mucus is also affected by water vapor evaporation/condensation. Therefore, energy equation of the mucus and tissue layers can be expressed as:
(14)
where h is the sensible enthalpy,
is the conductivity of mucus–tissue layer, and
, which only exists in the mucus layer, is the heat source term for water vapor evaporation determined by the mass flux of water vapor at the air–mucus interface.
3. Numerical simulations
3.1. Geometry and mesh
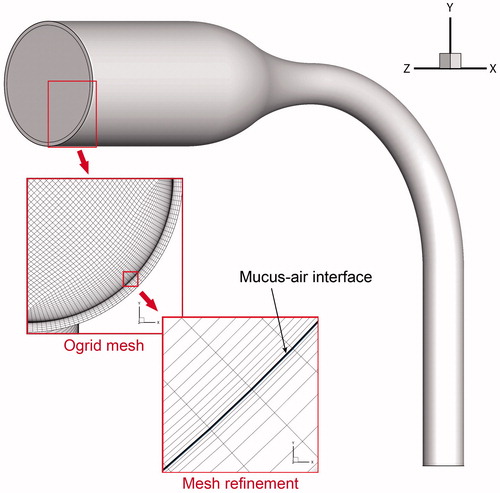
The simple MT airway model was proposed by Zhang et al. (Citation2004a). The volume of the MT model was 5.681 × 10⁻⁵ m3. Further investigation was conducted to examine the effect of geometric parameter on particle deposition (Zhang et al. Citation2006a). The air passage shares the same geometry as our recent study, which investigated the effects of flow rate, RH, and wet vs. dry airway walls on hygroscopic droplet deposition (Chen et al. Citation2017). Wu et al. (Citation2014) suggested that a 0.51 mm (i.e., 10 μm for the mucus layer and 0.5 mm for the tissue layer) could accurately capture the temperature distribution in the airway lumen, mucus, and tissue region. To reproduce the heat transfer phenomenon on the boundary, a 1 mm thick layer was constructed around the air passage to represent the mucus and airway tissue region (). The hexahedral mesh structure was applied for meshing both fluid and mucus-tissue regions. For the mucus-tissue region, 10 layers of mesh were constructed. The first mesh layer, representing the mucus layer, had a height of 10 μm. Thickness and shape of the mucus layer were assumed to remain unchanged during the simulations (Wu et al. Citation2014). Evaporation of the liquid (mucus or saliva) is largely due to convection over the air–liquid interface, while the thickness of the liquid only affects the thermal resistance of the conduction. Presently, the thickness of the saliva in the oral cavity is not included. However, it could be readily included by meshing the geometry of the saliva, sharing the same procedure as that for the mucus layer. The same mesh independence test was carried out as in our previous investigation for the same MT airway model (Chen et al. Citation2017). The resulting mesh contained 2,893,077 cells in total, including 2,287,197 cells for the fluid region and 605,880 cells for the mucus-tissue region. The mesh densities for both regions were enhanced in the area near the air–mucus interface to resolve the flow and heat transfer features.
Figure 2. The simple MT airway geometry and structured hexahedral mesh.
3.2. Numerical setup
To focus on the effect of the boundary heat transfer on the multicomponent droplet transport and deposition, the one-way coupled method was applied between the continuous phase (i.e., the air flow) and discrete phase (i.e., the aerosols). This assumption is widely adopted for dilute droplet/particle flows. However, if the number density of the droplets is relatively high, the mass and heat exchange between the air flow and the droplets may affect the hygroscopic growth, or evaporation, of the droplets. Other methods, e.g., mathematical models (Asgharian et al. Citation2018) and two-way coupling (Feng et al. Citation2016), may be required for the analysis.
Specifically, the flow field at steady inhalation of 15 L/min was solved first. The air-inlet conditions included 26.7 °C and RH = 34.7% (McFadden et al. Citation1985). The effect of the inlet RH is discussed elsewhere (Chen et al. Citation2017). The exterior surface of the tissue layer was assumed at the core temperature of human body, i.e., 37 °C. The RH of the air–mucus interface was set to 99.5% (Finlay Citation2001). The simulation of the fluid phase was continued until the change in the average temperature of the air at the outlet was smaller than 0.01 °C. Three types of thermal boundary conditions at the air–mucus interface were evaluated: (1) more realistic convection heat transfer simulations at the air–mucus interface and evaporation latent heat loss of water vapor in the mucus; (2) Consideration of only convection heat transfer; and (3) a constant wall temperature of 37 °C for comparison. It should be noted that the term “convection” used here only involves the heat transfer phenomenon and does not include the motion of a two-fluid (mucus and air) coupled system. The mucus transport and pharmaceutical particle absorption related investigations could be found elsewhere. For example, Rygg and Longest (Citation2016) proposed a computational fluid dynamics (CFD) model to predict the deposition, dissolution, clearance, and absorption of pharmaceutical particles in the human nasal cavity. Furthermore, Rygg et al. (Citation2016a) investigated the effect of the particle size on the drug absorption using their model. Rygg et al. (Citation2016b) further coupled a compartmental pharmacokinetic model with this CFD model to investigate the transient pharmacokinetic plasma concentration change.
As conduction heat transfer depends on a temperature gradient existed, no heat flows in the tissue under Condition 3 due to the uniform temperature distribution at 37 °C. A summary of the parameter values used for the simulations is provided in .
Table 1. Inlet, boundary, and droplet conditions applied for the simulations.
Transport and deposition of hygroscopic multicomponent droplets were simulated for the airflow fields subject to the three thermal boundary conditions. Each droplet contained four components, i.e., water, ethanol, NaCl (sodium chloride), and fluorescein. Their mass ratios were fixed, i.e., water:ethanol:NaCl:fluorescein = 400:100:100:2.5. The diameter of the particle containing only NaCl and fluorescein after evaporation would be 44.3% of its original size. In order to acquire a complete DE vs. Stokes number (St) relation, simulations for different initial droplet diameters were executed. Cheng et al. (Citation2014) suggested that DE correlates best with St when for its definition the inlet velocity and minimum diameter in the human MT replica are used. Thus, the Stokes number is defined as:
(15)
where
is the initial density of the droplet,
is the average air velocity at the inlet, and
is the diameter of the outlet of the MT model. For each case, 10,000 droplets were released at the inlet surface. Deposition was assumed to occur, i.e., 100% capture efficiency, when the droplet contacted with the mucus layer.
The governing equations were solved with ANSYS Fluent15.0 (ANSYS Inc., Canonsburg, PA, USA), enhanced by UDFs, executing the following tasks:
Generating a parabolic velocity profile for the air inlet;
Generating a RH =99.5% condition at the boundary surface, the temperature of which may vary with spatial location due to heat transfer;
Calculating the mass flux of the water vapor and the evaporation heat at the air–mucus interface;
Calculating the y+ value for the internal cells;
Initializing the droplet properties, e.g., diameter, mass for each component, etc.;
Calculating droplet–vapor interaction and the changes of droplet components during the transport accordingly;
Calculating the drag force for the droplet, including the fluctuating velocity, near-wall correction for the fluctuating velocity (based on the y+ value of the local cell), because the default random walk model cannot be used due to customized discrete phase time step; and
Recording the information of deposited droplet, e.g., droplet size, location, velocity, etc.
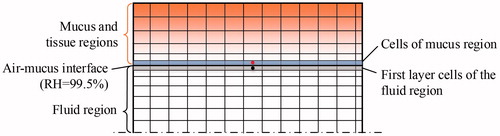
In addition, a C++ program was coded to generate a random droplet distribution that had a probability density following the profile of the air velocity at the inlet. There are few details worth noting for calculating the evaporation heat of the water vapor. As shown in , the boundary cells of the fluid region (highlighted in grey), which contain the data of water vapor flux, and the cells of the mucus layer (highlighted in blue), which require the data of evaporation heat of water vapor, are actually separated in different regions. To avoid data mapping, the surface meshes on the two sides of the air–mucus interface were exactly the same when generating the mesh. The cells on the two sides, e.g., the cells dotted in red and black, were paired before fluid iteration. At the end of each iteration, the quantity of the mass flux of water vapor was calculated in the grey cell, and the value of the vapor mass was transferred to its paired cell. Therefore, the evaporation heat of the water vapor could be obtained for the source term of EquationEquation (13)(13) when calculating the temperatures of the mucus and tissue regions.
Figure 3. Setups for the evaporation heat calculation and data transfer.
3.3. Model validations
The application of the transition SST model in human airways has been discussed by Zhang and Kleinstreuer (Citation2011). The accuracy of particle transport and deposition simulations with the transition SST model and UDF-enhanced DPM has been examined (Chen et al. Citation2017). Specifically, the droplet–eddy interaction model with the near-wall correction for fluctuating velocities was implemented for the particle trajectory prediction. Mesh-independence tests for fluid velocity and particle number independence (>10,000) concerning DE were performed. The predicted DEs for non-hygroscopic micron particles with various diameters at flow rates of 30 L/min and 90 L/min were in accordance with experiment results (Zhang et al. Citation2006a). The droplet–vapor interaction model was validated under different steady and unsteady RH conditions (Chen et al. Citation2017), and evaporation cooling and convection heat transfer were also examined (see Section 4.2 for details).
4. Results and discussion
4.1. Airflow
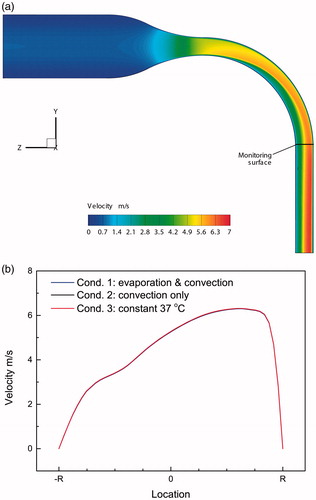
Assuming Condition 1, depicts the air velocity distribution in the mid-plane of the airway model without the mucus and tissue regions. Considering Conditions 1–3, the almost identical velocity profiles at the “monitoring section” () are shown in . Clearly, the impact air density, dependent on temperature and RH differences, is limited. The velocity distributions in the present airway configuration at different flow rates (i.e., 15–90 L/min) have been investigated in previous papers (Zhang et al. Citation2006a; Chen et al. Citation2017).
Figure 4. Airflow fields of the MT model at flow rate of 15L/min. (a) Contours of velocity distribution of symmetrical plane for Condition 1. (b) Comparison of velocity profiles of the center line at the monitoring surface.
4.2. Temperature distributions
The temperature distributions of the mid-plane and outlet of the MT model, including the mucus and tissue regions for Conditions 1–3, are shown in . An area at the curved lumen is enlarged to give a clear view of the temperature distribution at the air–mucus interface. It is evident that the near-mucus heat transfer has no significant impact on the macroscopic temperature distributions; however, local differences in both temperatures and gradients appear for the three thermal boundary conditions.
Figure 5. Temperature distributions for mid-plane and outlet in light of different thermal boundary conditions. (a) Condition 1; (b) Condition 2; (c) Condition 3.
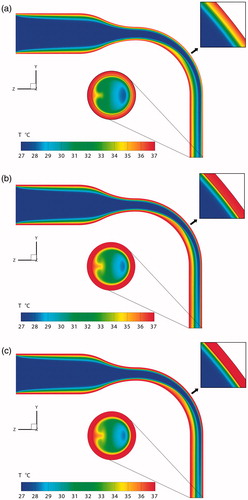
So, the temperature distributions at the air–mucus interface are examined (), where for Condition 3 the temperature distribution is uniform at 37 °C. If only convection heat transfer is considered, the average temperature of the air–mucus interface of the MT model only decreases by 0.2 °C (). However, this temperature would decrease by 1.31 °C when the loss of latent heat is also included (), i.e., 1.11 °C reduction by latent heat alone. Thus, the latent heat transfer occupies 84.7% of the total heat transfer. This percentage is similar to the result given by Tsu et al. (Citation1988). They suggested that the latent heat transfer in the oral cavity comprises 92% and 83% of the total heat transfer during inspiration and expiration, respectively.
Figure 6. Temperature distributions of the mucus layer for different boundary heat transfer conditions. (a) Condition 1, ,
; (b) Condition 2,
,
.
A large temperature decrease could be observed in the negative z-direction of the curved pipe wall for Condition 1. This region is directly impacted by the airflow. Thus, the high air–velocity leads to strong convection heat transfer as well as a high transport rate of water vapor form the mucus. This results in a minimum regional temperature of 32.81 °C for Condition 1. In contrast, the convection only decreases the local temperature by 0.61 °C for Condition 2.
4.3. RH distributions
The RH distributions are shown in . The air at the inlet has a RH of 34.7%, while it is 99.5% above the mucus. As the air velocity is relatively high in the center of the oral cavity, the water vapor evaporated from the mucus layer cannot humidify the inhaled air immediately. Therefore, the humidification process continues to the outlet of the MT model.
Figure 7. Relative humidity distributions of the mid-plane and outlet of the MT model for different boundary heat transfer conditions. (a) Condition 1, volume-averaged RH = 57.83%, average RH at outlet = 81.34%; (b) Condition 2, volume-averaged RH = 58.51%, average RH at outlet = 83.22%; (c) Condition 3, volume-averaged RH = 58.60%, average RH at outlet = 83.52%.
One of the factors influencing the process of water evaporation from the mucus is the mucus temperature. From the discussion above, it is known that the temperature difference of the mucus layer based on Conditions 2 and 3 is limited. Thus, the resulting RH distributions do not differ noticeably for Condition 2 (volume-averaged RH = 58.51%) and Condition 3 (volume-averaged RH = 58.60%) as shown in . In contrast, the volume-average RH of Condition 1 is 57.83%. Furthermore, when considering latent heat transfer, a change in the RH distribution at the outlet occurs (). The average RHs at the outlets for Conditions 1 to 3 are 81.34%, 83.22% and 83.52%, respectively. The evaporation of water vapor actually reduces the mucus temperature, thereby decreasing the speed of water evaporation.
4.4. Deposition efficiencies
depicts the deposition efficiencies (DEs) of the multicomponent hygroscopic droplets for different boundary heat transfer conditions, i.e., Conditions 1 to 3. Two extra sets of simulations were added to demonstrate the effects of phase-change, i.e., air–vapor interaction and mucus evaporation, on the hygroscopic droplet deposition. The set of data with no droplet–vapor interaction assumed that the components in the droplet would remain unchanged during the simulation, which is the same as for the traditional solid particle simulations (Zhang et al. Citation2004a; Chen et al. Citation2012). The other set of data with no mucus evaporation assumed that the mucus layer would not evaporate water vapor into the airway, but still transfer the heat via conduction and convection. This is similar to the dry boundary condition as discussed in our previous study (Chen et al. Citation2017). The droplets would evaporate completely until only solid particles remain, containing only NaCl and fluorescein. Further particle transport and deposition would be the same as the traditional solid particle simulations.
Figure 8. Deposition efficiencies of hygroscopic droplet in the MT airway under different boundary conditions.
Obviously, ignoring the droplet–vapor interaction (open circles in ) causes an unacceptable error, i.e., overestimating DE by approximately 80% at St = 0.0204, when compared to the results under Condition 1. In contrast, ignoring the mucus evaporation also causes a large error, i.e., underestimating DE by approximately 25% at St = 0.0409; again, when compared to the results under Condition 1. These indicate the importance of including the droplet–vapor interaction and mucus evaporation for the prediction of the transport and deposition of hygroscopic droplets, especially in case of nebulized drugs.
In general, the DE increases with higher environmental RH among Conditions 1–3. The DE–St curve under Condition 1 has the lowest DE-values corresponding to lowest volume-averaged RH value. Chen et al. (Citation2017) concluded that higher inlet air RH could increase the DEs of hygroscopic droplets. It is surprising that the boundary heat transfer condition can substantially affect the DEs of hygroscopic droplets, even if it has limited effect on the airway RH distribution. Comparing to the constant 37 °C boundary condition, Condition 1, i.e., the boundary condition considers convection, conduction, and evaporation latent heat, only changes the average volume RH by less than 1% (). However, it can reduce the deposition efficiency by up to 9.93% for droplets with an initial diameter equal to 14 μm. Meanwhile, the average RH difference between Conditions 2 and 3 is less than 0.1%, but the difference in DE can reach 3.39% when the initial droplet diameter is 16 μm.
This phenomenon may relate to the process of hygroscopic growth of the droplet. Feng et al. (Citation2015) claimed that the hygroscopic growth of the droplet is sensitive to the variations in properties of the droplet. Furthermore, Chen et al. (Citation2017) indicated that a small change in saturation pressure of water vapor can cause a large difference in droplet/particle growth ratio. In this case, the local temperature change, i.e., 4.19 °C decrease comparing to the constant 37 °C boundary condition at the curved pipe region as shown in , can lead to the change in saturation pressure of water vapor. Subsequently, the hygroscopic growth is reduced in the near-wall region in the case of thermal boundary Condition 1.
4.5. Final droplet distributions
illustrate the final positions and diameters of droplets deposited on the airway boundary and escaped from the outlet under Conditions 1–3. The initial droplet diameter for the simulations shown in is 14 μm. The statistics of the diameter of deposited and escaped droplets is shown in .
Figure 9. Final diameters and locations of multicomponent hygroscopic droplets under different boundary heat transfer conditions. (a) Condition 1; (b) Condition 2; (c) Condition 3.
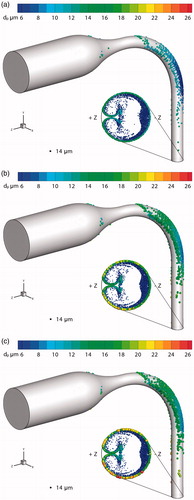
Table 2. Statistics of diameters of deposited and escaped droplets.
The spatial distributions of deposited and escaped droplets are similar to the previous study (Chen et al. Citation2017). Due to inertial impact, most droplets deposit on the boundary of curved pipe toward the − z direction. The air forms a pair of symmetric vortices when flowing through the curved pipe. Thus, some of the droplets deposit on the lateral side of the tube, which is toward the ±x direction. Similarly, the escaped droplets locate intensively on near the tube boundary toward the –z direction due to inertia. There are droplets that move along with the secondary flow close to the boundary from the –z direction to the +z direction. Some of them are also drawn into the center of the tube because of the vortices.
The boundary heat transfer of the airway comprises two mechanisms, i.e., convection heat transfer and latent heat loss due to water evaporation. The difference between the results of Conditions 2 and 3 () shows the effect of the convection on the hygroscopic growth of the multicomponent droplets. Considering the statistical results given in , it is observed that convection has a limited effect on the droplet hygroscopic growth except for reducing the maximum diameter of escaped droplets by 10.3%. The relative difference (RD) percentages are based on the notion that Condition 3 (Twall = ¢) is the simplest, but most unrealistic boundary condition in lung-aerosol dynamics.
The impact of including the latent heat of evaporation can be observed by comparing the simulation results for Condition 1 and Condition 3 (see as well as ). Specifically, the average diameters of deposited and escaped droplets are reduced by 32.50% and 13.38%, respectively. This effect also decreases the maximum diameters of deposited and escaped droplets by over 27%. However, the minimum diameters of deposited and escaped droplets remain unchanged at 6.2 μm. This is because the droplet has already lost almost all evaporable components so that only NaCl and fluorescein remain.
In conclusion, the boundary heat transfer, including convection and evaporation latent heat, is important for the accurate prediction of hygroscopic aerosol transport and deposition.
5. Conclusions
The transport and deposition of multicomponent hygroscopic droplets in a simple MT model under different heat transfer conditions for airflow and mucus-layer have been studied at a flow rate of 15 L/min. Configurations of the mucus-tissue region and the air pathway as well as their hexahedral meshes have been constructed for the MT model. The effects of mucus evaporation-induced latent heat loss and boundary convection on the air flow, temperature distribution, RH distribution, droplet deposition efficiencies and final distributions have been analyzed. The modeling framework presented can be readily expanded to other systems. Based on the validated modeling and simulation results, the conclusions for the present airway configuration and inhalation flow rate are as follows:
The latent heat of evaporation can cause a temperature gradient in the mucus-tissue region and may reduce the average temperature of the mucus layer up to 1.11 °C, while mucus convection only reduces this temperature by 0.2 °C. However, the combined heat transfer effect can locally reduce the temperature to 32.81 °C.
The interfacial heat transfer does not cause a major change in RH distribution. It just decreases the average RH in the airway by 0.77% when compared to the constant 37 °C boundary condition.
Most importantly, the effects of detailed heat transfer between airflow, mucus-layer, and tissue should be taken into account as it measurably impacts the transport and deposition of inhaled hygroscopic aerosols.
The more realistic thermal boundary condition can significantly reduce hygroscopic growth of deposited and escaped droplets.
Especially latent heat loss due to evaporation, can decrease the deposition efficiency up to 9.93%.
Compared to the constant 37 °C wall condition, imposing the more realistic thermal boundary condition leads to actual droplet-size changes of 32.50% and 13.38% in terms of average diameters of the deposited and escaped droplets, respectively.
Additional information
Funding
References
- Asgharian, B., Price O. T., Rostami, A. A., and Pithawalla Y. B. (2018). Deposition of Inhaled Electronic Cigarette Aerosol in the Human Oral Cavity. J. Aerosol Sci., 116:34–47.
- Chen, X., Zhong, W., Sun B., Jin B., and Zhou X. (2012). Study on Gas/Solid Flow in an Obstructed Pulmonary Airway With Transient Flow Based on CFD–DPM Approach. Powder Tech., 217:252–260.
- Chen, X., Feng, Y., Zhong, W., and Kleinstreuer, C. (2017). Numerical Investigation of the Interaction, Transport and Deposition of Multicomponent Droplets in a Simple Mouth-Throat Model. J. Aerosol Sci., 105:108–127.
- Cheng, Y. S., Zhou, Y., and Su, W.-C. (2014). Deposition of Particles in Human Mouth–Throat Replicas and a USP Induction Port. J. Aerosol Med. Pulm. D., 27:1–9.
- Feng, Y., Kleinstreuer, C., and Rostami, A. (2015). Evaporation and Condensation of Multicomponent Electronic Cigarette Droplets and Conventional Cigarette Smoke Particles in an Idealized G3–G6 Triple Bifurcating Unit. J. Aerosol Sci., 80:58–74.
- Feng, Y., Kleinstreuer, C., Castro, N., and Rostami, A. (2016). Computational Transport, Phase Change and Deposition Analysis of Inhaled Multicomponent Droplet–Vapor Mixtures in an Idealized Human Upper Lung Model. J. Aerosol Sci., 96:96–123.
- Finlay, W. H. (2001). The Mechanics of Inhaled Pharmaceutical Aerosols: An Introduction. Academic Press, New York, NY.
- Foster, W., Langenback, E., and Bergofsky, E. (1982). Lung Mucociliary Function in Man: Interdependence of Bronchial and Tracheal Mucus Transport Velocities With Lung Clearance in Bronchial Asthma and Healthy Subjects. Ann. Occup. Hyg., 26:227–244.
- Gosman, A., and Loannides, E. (1983). Aspects of Computer Simulation of Liquid-Fueled Combustors. J. Energ., 7:482–490.
- Heenan, A. F., Matida, E., Pollard, A., and Finlay, W. H. (2003). Experimental Measurements and Computational Modeling of the Flow Field in an Idealized Human Oropharynx. Exp. Fluids, 35:70–84.
- Ivey, J. W., Bhambri, P., Church, T. K., Lewis, D. A., McDermott, M. T., Elbayomy, S., Finlay, W.H., and Vehring, R. (2017). Humidity Affects the Morphology of Particles Emitted From Beclomethasone Dipropionate Pressurized Metered Dose Inhalers. Int. J. Pharm., 520:207–215.
- Javaheri, E., and Finlay, W. H. (2013). Size Manipulation of Hygroscopic Saline Droplets: Application to Respiratory Drug Delivery. Int. J. Heat Mass Tran., 67:690–695.
- Javaheri, E., Shemirani, F. M., Pichelin, M., Katz, I. M., Caillibotte, G., Vehring, R., and Finlay, W.H. (2013). Deposition Modeling of Hygroscopic Saline Aerosols in the Human Respiratory Tract: Comparison Between Air and Helium–Oxygen as Carrier Gases. J. Aerosol Sci., 64:81–93.
- Kim, J., Moin, P., and Moser, R. (1987). Turbulence Statistics in Fully Developed Channel Flow at Low Reynolds Number. J. Fluid Mech., 177:133–166.
- Li, W., Montassier, N., and Hopke, P. (1992). A System to Measure the Hygroscopicity of Aerosol Particles. Aerosol Sci. Technol., 17:25–35.
- Longest, P. W., and Kleinstreuer, C. (2005). Computational Models for Simulating Multicomponent Aerosol Evaporation in the Upper Respiratory Airways. Aerosol Sci. Technol., 39:124–138.
- Longest, P. W., McLeskey Jr, J. T., and Hindle, M. (2010). Characterization of Nanoaerosol Size Change During Enhanced Condensational Growth. Aerosol Sci. Technol., 44:473–483.
- Matida, E. A., Finlay, W. H., Lange, C. F., and Grgic, B. (2004). Improved Numerical Simulation of Aerosol Deposition in an Idealized Mouth–Throat. J. Aerosol Sci., 35:1–19.
- McFadden, E., Pichurko, B., Bowman, H. F., Ingenito, E., Burns, S., Dowling, N., and Solway, J. (1985). Thermal Mapping of the Airways in Humans. J. Appl. Physiol., 58:564–570.
- Menter, F. R. (1994). Two-Equation Eddy-Viscosity Turbulence Models for Engineering Applications. AIAA J., 32:1598–1605.
- Menter, F. R., Langtry, R., Likki, S., Suzen, Y., Huang, P., and Völker, S. (2006a). A Correlation-Based Transition Model Using Local Variables—Part I: Model Formulation. J. Turbomach., 128:413–422.
- Menter, F. R., Langtry, R., and Völker, S. (2006b). Transition Modelling for General Purpose CFD Codes. Flow, Turbul. Combust., 77:277–303.
- Rygg A., and Longest W. P. (2016). Absorption and Clearance of Pharmaceutical Aerosols in the Human Nose Development of a CFD Model. J. Aerosol Med. Pulm. Drug Deliv., 29:416–431.
- Rygg A., Hindel M., and Longest W. P. (2016a). Absorption and Clearance of Pharmaceutical Aerosols in the Human Nose: Effects of Nasal Spray Suspension Particle Size and Properties. Pharm. Res., 33:909–921.
- Rygg A., Hindel M., and Longest W. P. (2016b). Linking Suspension Nasal Spray Drug Deposition Patterns to Pharmacokinetic Profiles: A Proof-of-Concept Study Using Computational Fluid Dynamics. J. Pharm. Sci., 1995–2004.
- Tsu, M. E., Babb, A. L., Ralph, D. D., and Hlastala, M. P. (1988). Dynamics of Heat, Water, and Soluble Gas Exchange in the Human Airways: 1. A Model Study. Ann. Biomed. Eng., 16:547–571.
- Tu, H., and Ray, A. K. (2005). Measurement of Activity Coefficients From Unsteady State Evaporation and Growth of Microdroplets. Chem. Eng. Commun., 192:474–498.
- Wang, Y., and James, P. (1999). On the Effect of Anisotropy on the Turbulent Dispersion and Deposition of Small Particles. Int. J. Multiphas. Flow, 25:551–558.
- Wu, D., Tawhai, M. H., Hoffman, E. A., and Lin, C.-L. (2014). A Numerical Study of Heat and Water Vapor Transfer in MDCT-Based Human Airway Models. Ann. Biomed. Eng., 42:2117–2131.
- Zhang, Y., Finlay, W. H., and Matida, E. A. (2004a). Particle Deposition Measurements and Numerical Simulation in a Highly Idealized Mouth–Throat. J. Aerosol Sci., 35:789–803.
- Zhang, Y., Chia, T. L., and Finlay, W. H. (2006a). Experimental Measurement and Numerical Study of Particle Deposition in Highly Idealized Mouth-Throat Models. Aerosol Sci. Technol., 40:361–372.
- Zhang, Z., and Kleinstreuer, C. (2003). Species Heat and Mass Transfer in a Human Upper Airway Model. Int. J. Heat Mass Tran., 46:4755–4768.
- Zhang, Z., Kleinstreuer, C., Kim, C. S., and Cheng, Y. S. (2004b). Vaporizing Microdroplet Inhalation, Transport, and Deposition in a Human Upper Airway Model. Aerosol Sci. Technol., 38:36–49.
- Zhang, Z., Kleinstreuer, C., and Kim, C. S. (2006b). Isotonic and Hypertonic Saline Droplet Deposition in a Human Upper Airway Model. J. Aerosol Med., 19:184–198.
- Zhang, Z., and Kleinstreuer, C. (2011). Laminar-to-Turbulent Fluid-Nanoparticle Dynamics Simulations: Model Comparisons and Nanoparticle-Deposition Applications. Int. J. Numer. Meth. Bio., 27:1930–1950.
- Zhang, Z., Kleinstreuer, C., and Feng, Y. (2012a). Vapor Deposition During Cigarette Smoke Inhalation in a Subject-Specific Human Airway Model. J. Aerosol Sci., 53:40–60.
- Zhang, Z., Kleinstreuer, C., and Hyun, S. (2012b). Size-Change and Deposition of Conventional and Composite Cigarette Smoke Particles During Inhalation in a Subject-Specific Airway Model. J. Aerosol Sci., 46:34–52.