
Abstract
Dimethylamine (DMA) and sulfuric acid (SA) are the important constituents of atmospheric aerosols. To accurately predict the behavior of DMA-containing aerosol systems, exact thermodynamic models are needed. The applicability of these models needs to be tested carefully in different experimental settings to continuously validate and improve their performance. In this work, the Extended Aerosol Inorganics Model (E-AIM) was used to simulate the hygroscopicity of aerosol particles generated from five different aqueous DMA-SA solutions. The applicability of the model was tested in the 10–200 nm size range and from DMA-SA molar ratios ranging from 1:3 to 2:1. The aerosol hygroscopic growth at 0–80% RH was determined with two tandem differential mobility analyzers, and the composition of the generated particles was measured with the Aerosol Mass Spectrometer (AMS), which revealed that the particles contained also ammonium. The model accurately captured the hygroscopicity for particles larger than 80 nm. With particles smaller than 80 nm, the model underestimated the hygroscopicity in all the studied experimental conditions. An increase in hygroscopicity parameter κ with decreasing particle size implied a plausible base evaporation in the experimental setup, which in turn may have affected the modeled hygroscopicity as the composition of the smallest particles may have differed from the AMS measurements. Coupling E-AIM to a dynamic evaporation model, however, could not produce compositions whose modeled hygroscopic behavior would match the measured hygroscopic growth at smaller sizes. Our results, therefore, suggest that DMA thermodynamics are not modeled correctly in E-AIM or there exists uncertainty in the physicochemical parameters.
© 2018 American Association for Aerosol Research
EDITOR:
1. Introduction
Amines are organic derivatives of ammonia, in which one or more alkyl groups are bonded to nitrogen. Being present in the atmosphere, both in gaseous phase as well as in particulate matter, they comprise a vast range of different species originating from various anthropogenic and natural sources (VandenBoer et al. Citation2011; Ge et al. Citation2011a; Youn et al. Citation2015). The most abundant atmospheric amines are relatively low-weight aliphatic amines such as methylamine (MMA), dimethylamine (DMA), and trimethylamine (TMA). These compounds have relatively high equilibrium vapor pressures, and thus, they are highly volatile by nature. However, because they are also strong bases, they can undergo prompt neutralization reactions to form organic salts in the presence of organic or inorganic acids.
There exist a few experimental studies on amines in the atmospheric aerosol particles. In the early 2000s, Mäkelä et al. (Citation2001) reported an enrichment of particulate DMA during new particle formation (NPF) events and subsequent particle growth. Later, Smith et al. (Citation2010) measured the composition of freshly nucleated particles at urban and rural sites and detected a significant presence of aminium ions. In addition to experimental atmospheric studies, several theoretical findings have highlighted amines and especially DMA as an important stabilizing base for sulfuric acid (H2SO4; SA) and sulfuric acid water clusters (Kurtén et al. Citation2008; Loukonen et al. Citation2010; Erupe et al. Citation2011). These theoretical results are backed by the experimental chamber and laboratory measurements (Almeida et al. Citation2013; Jen et al. Citation2014; Kürten et al. Citation2014). For example, Almeida et al. (Citation2013) observed that only a few pptv of gaseous DMA could enhance the nucleation rates by several orders of magnitudes compared to the presence of pure ammonia (NH3).
Overall, these results suggest that amines may contribute significantly to nanoparticle formation and growth, and therefore, should be taken into account in models to better understand the subsequent impact on climate. A proper model description of amines, however, requires information about their thermodynamic properties (Bergman et al. Citation2015). Furthermore, to mimic the atmospheric behavior of amines, the computational models need to be carefully validated against laboratory measurements where the physicochemical parameters can be monitored. To our knowledge, the only thermodynamic model that includes the amines, their dissolution, and subsequent protonation, is the Extended Aerosol Inorganics Model (E-AIM; Clegg et al. Citation1998; Wexler and Clegg Citation2002). E-AIM is a thermodynamic phase equilibrium model, which allows the water activity calculations for real solutions. However, in E-AIM, interactions between aminium ions and other possible compounds are modeled similar to ammonium (NH4) and the validity of this approach is not fully confirmed. Earlier results (Clegg et al. Citation2013; Chu et al. Citation2015; Sauerwein et al. Citation2015) have shown conflicting results for E-AIM’s ability to model the amine-SA-H2O system. Further, the existing model-measurement comparisons are performed against bulk solutions or particles whose Kelvin effect can be neglected leaving uncertainty in the applicability of the model to particles with high surface-to-volume ratio.
One way to assess the model performance is to compare its ability to predict the hygroscopicity against laboratory measurements. Hygroscopicity is an important parameter describing the particles ability to absorb or adsorb moisture from the surrounding air. Thus, hygroscopicity essentially effects the particle optical properties (Zieger et al. Citation2013, Citation2017), as well as their ability to act as cloud condensation nuclei (CCN) under certain atmospheric conditions (Väisänen et al. Citation2016). On the other hand, condensation of water onto pre-existing particles also creates a pathway for aqueous phase processes that can further alter their chemical composition (McNeill Citation2015 and references therein). Last, knowing the hygroscopicity of various individual aerosol constituents, allows the possibility to estimate the aerosol chemical composition indirectly through measurements of CCN activity or hygroscopic growth.
In this work, we have atomized particles from DMA-SA-H2O solutions and determined their detailed composition in the size range greater than or equal to 70 nm by means of aerosol mass spectrometry. The measured composition of the produced dimethylaminium (DMAH), sulfate (SO4), and ammonium (NH4) containing particles is combined with measured and modeled hygroscopic growth in the 10–200 nm size range. This allows us to evaluate the performance of the studied model (E-AIM) directly with larger particles, but also, enables the possibility to inspect the applicability of the model to smaller particles whose curvature has an effect on the water partitioning.
2. Methods
2.1. Solution preparation and particle generation
Five different DMA-SA-H2O solutions were prepared by mixing stoichiometric amounts of aqueous DMA (40 wt. %, Sigma Aldrich, 426458) and sulfuric acid (Sigma Aldrich, 258105) with deionized water (MilliQ, ∼18.2 MΩcm). The prepared solutions had an approximate molar DMA-SA ratio (nominal DMA:SA) of 1:3, 1:2, 1:1, 3:2, and 2:1, and a total salt concentration of ∼3 wt. %. A polydisperse aerosol population was generated by atomizing the aqueous DMA-SA solutions with a conventional aerosol nebulizer (nebulizing section of Topas ATM 226, operated with clean pressurized air). The outgoing aerosol flow was diluted with clean air to reach a total flow of 18 lpm and relative humidity (RH) around 14%. Furthermore, the sample line leading to aerosol instrumentation was equipped with a custom-made silica gel diffusion drier to decrease the inlet RH down to ∼3%.
2.2. HTDMA measurements
The hygroscopicity of 10–200 nm particles was measured with two separate hygroscopic tandem differential mobility analyzers (HTDMA). Briefly, HTDMA is a measurement device that consists of two differential mobility analyzers, a humidifier, and a condensation particle counter (CPC). The first differential mobility analyzer (DMA1) is operated to select a nearly monodisperse particle population from the polydisperse sample flow. The monodisperse dry aerosol is then exposed to certain RH, and the resulting changes in particle size are determined with another differential mobility analyzer (DMA2) followed by a CPC. Consequently, HTDMA allows the determination of the hygroscopic growth factor
(1)
where Dp is the mean diameter of the humidified aerosol and Dp,dry is the selected dry particle size. Furthermore, the measured GF can be translated into a hygroscopicity parameter κ according to
(2)
where Mw, σw, and ρw are the molar mass, surface tension, and density of water, T the ambient temperature and R the universal gas constant (Petters and Kreidenweis Citation2007).
The hygroscopic growth of 10, 15, 20, and 25 nm particles was measured with a nano-HTDMA (Keskinen et al. Citation2011; Kim et al. Citation2016). In this setup, two nano-differential mobility analyzers (TSI Inc., model 3085) are operated in an open-loop configuration (sample flow 1 lpm, sheath/excess flow 10 lpm). Besides humidifying the monodisperse aerosol, the sheath air inside the DMA2 was pre-humidified to the desired RH in order to secure stable conditions through particle sizing. The RH of the aerosol flow and the sheath air were monitored with two capacitive RH sensors (Vaisala HMP110), and the RH of the humid excess flow was measured with a dew point meter (EdgeTech, model DewMaster). After passing the DMA2, the particles were counted with a water-based condensation particle counter (TSI Inc., model 3785).
The hygroscopic growth of 50, 80, 130, and 200 nm particles was measured with an HTDMA previously described by Väisänen et al. (Citation2016). This instrument is built around two 28 cm long Vienna-type differential mobility analyzers operated in a closed-loop arrangement (sample flow 1 lpm, sheath/excess flow 6 lpm). In other words, the sheath air slowly reaches the equilibrium with the passing sample flow in terms of RH and temperature. The RH of the humid sample flow was monitored continuously with one Vaisala HMP110 sensor and the excess flow RH downstream of DMA2 was measured with an EdgeTech dew point meter. The particles were counted with a TSI model 3010 CPC.
The HTDMA data were calibrated against dry GF offsets by determining the dry particle diameter Dp,dry from ammonium sulfate measurements. These dry size scans were performed at low RH (RH < 10%) before each experiment. In addition, the measured GFs were corrected to target RHs of 40, 60, and 80% by assuming a constant hygroscopicity parameter κ within a narrow humidity range (±1.5%) around the target value. Taking into account all the components affecting the particle sizing, the maximum instrumental uncertainties associated with the measured GFs were ±2.3% (Dp,dry ≤ 25 nm) and ±4.7% (Dp,dry ≥ 50 nm), as estimated through error propagation.
2.3. Particle composition
The chemical composition of the generated particles was measured with an Aerodyne High-Resolution Time-of-Flight Aerosol Mass Spectrometer (hereafter referred to as AMS). In summary, AMS is capable of measuring the non-refractory composition of sub-micrometer aerosol particles by applying thermal vaporization and electron impact (EI) ionization. General principles of AMS measurements, calibrations, modes of operation, and data processing have been described comprehensively in previous literature (Jayne et al. Citation2000; DeCarlo et al. Citation2006; Canagaratna et al. Citation2007).
In this study, the AMS was sampling through an additional differential mobility analyzer (sheath flow 7 lpm) that was set to generate almost monodisperse particle size distributions with a mean mobility diameter around 70 or 150 nm. The decision to size-select 70 nm particles over smaller sizes was made to guarantee high enough mass concentrations, and thus, sufficient ion signals for reliable composition calculations. Although the particle number size distribution passing the differential mobility analyzer was dominated by singly charged particles, it is also worth noting that the contribution of multiply charged particles was somewhat stronger in terms of particle mass (approximately 50%), shifting the mean vacuum aerodynamic diameter observed by mass-based AMS towards larger sizes.
The collected AMS data were analyzed using standard ToF-AMS data analysis toolkits (SQUIRREL v1.57I and PIKA V1.16I). The V-mode mass spectra were processed in PIKA to determine the ion mass concentrations. The majority of the produced salts in the mixed DMA-SA solutions are dimethylaminium sulfate ((C2H8N)2SO4) or dimethylaminium bisulfate (C2H8NHSO4) depending on the molar ratios of DMA to SA. The rest should be the unreacted precursors such as either pure DMA or SA. All these salts undergo severe fragmentations in AMS. Hence, in the data analysis, the family ions CxHyN and CxHy, where x ≤ 2 and y ≤ 8, were integrated to quantitate the mass concentrations of dimethylaminium ions. For the ion CH2N (m/z 28), the ion peak coincides with an intensive N2 signal in the mass spectrum, making its accurate quantification difficult from the high-resolution ion fitting. Thus, its concentration was approximated as 30% of C2H6N (m/z 44) based on the known DMA mass spectrum in the NIST database (NIST, Citation2018). The mass concentrations of sulfate ions were determined by the AMS default “fragmentation table” method (Allan et al. Citation2004). Besides, the ammonia (NH3) either from the water or from the ambient air could lead to the formation of ammonium sulfate and ammonium bisulfate in the mixed solutions (Section 3.1). Therefore, the concentrations of ammonium were also determined. For mass concentration calculations, the default relative ionization efficiency (RIE; Canagaratna et al. Citation2007) values 1.2 and 3.75 were applied for sulfate and ammonium, respectively. For dimethylaminium, we determined a RIE value of 1.84 assuming that the most basic measured composition had a molar total base-to-sulfate ratio of two.
2.4. Thermodynamic modelling
The Extended Aerosols Inorganics Model (E-AIM) is a thermodynamic equilibrium model for non-ideal solutions, which calculates the equilibrium partitioning of bulk chemical system by minimizing the Gibbs free energy of the system (Clegg et al. Citation1998; Wexler and Clegg Citation2002). E-AIM takes into account the particulate phase acid-base chemistry and is currently to our knowledge the only available model, which has an accurate description of amine thermodynamics relevant for atmospheric aerosols included from the work of Ge et al. (Citation2011b).
In this work, the system consists of DMA, ammonia, and sulfuric acid in the liquid phase and water, which is the only compound allowed to equilibrate between the gas and the liquid phase. In systems where the condensed phase contains ionic and neutral organic compounds, the water activity is calculated as a product of the activities of the water-ion solution and water-organic solution (Clegg et al. Citation2001). This approximation allows the activity coefficients of neutral organics and ions to be calculated using different methods. We used UNIFAC (UNIQUAC Functional-group Activity Coefficients; Fredenslund et al. Citation1975; Hansen et al. Citation1991) to calculate the activity coefficient of neutral dimethylamine.
The modeled GF was calculated according to the EquationEquation (1)(1) . The wet particle diameter Dp,wet was calculated by
(3)
where mp,wet is the mass of the particle, which is in equilibrium with respect to gaseous water and ρp,wet is the density of the same particle. The mass of the wet particle is calculated from the known dry diameter Dp,dry and the molar amounts of DMAH and NH4 in the dry and wet particles. The GF calculation requires also the densities of the dry and wet particles for which we used the values obtained from the E-AIM (Clegg and Wexler Citation2011a,Citationb; Clegg et al. Citation2013) at RH = 1% and at the investigated RH, respectively.
The modeled system in the E-AIM is a bulk chemical system with a flat surface separating the phases. Since the size of the nanoparticles studied is of the order of tens of nanometers, the curvature of the particles must also be taken into account. The equilibrium vapor pressure of water over a curved surface of a particle can be calculated from the Kelvin equation
(4)
where peq,w and peq are the equilibrium vapor pressures of water over the curved and flat surfaces, respectively, σ is the surface tension, Mw is the molar mass of water (Mw = 18.02 g mol−1), ρ is the liquid phase density, and Dp is the diameter of the particle. The exponential term is also known as the Kelvin term.
In practice, this means that the relative humidity in which the E-AIM simulations are performed must be multiplied by the Kelvin term in order for the model results to be comparable with the measurements, i.e.,
(5)
where RH is the relative humidity, which corresponds to the values set in the humidifier during nanoparticle hygroscopicity measurements, and RHE-AIM is the relative humidity in which the E-AIM calculations are performed. For the liquid phase density ρ and surface tension σ, values obtained from the E-AIM output were used.
3. Results
3.1. Composition of generated particles
shows the measured particle composition corresponding to each DMA-SA solution and the two pre-selected sizes for AMS. In addition, the tabulated values are associated with error estimates calculated assuming that the uncertainty of the measured mass concentrations is equal to ±1 standard deviation over each measurement. The most important remark concerns the fact that along with DMAH and SO4 ions, AMS also detected substantial amounts of NH4 (43–160% by moles of DMAH). Furthermore, the increasing contribution of NH4 as a function of solution acidity implies that the observed ammonium most likely originates from a contamination. One possible explanation could be that the MilliQ water used as a solvent contained small amounts of dissolved NH3, which then had protonated and partitioned into acidic particles as NH4. On the other hand, the particles were exposed to air of unknown composition during particle generation and size-selection prior to AMS, which also may have served as an external contaminant. Hereafter, the presence of NH4 has been taken into account in all model results and analyses.
Table 1. The measured particle composition for each DMA-SA solution and for the two AMS sizes. The error intervals are calculated taking into account the AMS measured mass concentrations and their standard deviations during each measurement.
Overall, we observe differences between the two AMS sizes with 150 nm particles showing generally higher DMAH molar fractions than 70 nm particles. By contrast, NH4 always shows higher molar ratios at 70 nm size, and therefore, suppresses the size-dependent differences in overall acidity. Moreover, the AMS measured DMAH:SO4 ratios differ from those expected based on the stoichiometric DMA-SA mixing ratios. The solutions with nominal DMA:SA of 1:1 and 1:2 produced particles with comparable DMAH:SO4 molar ratios. However, for solutions with nominal DMA:SA of 2:1 and 3:2, the AMS measured compositions were pronounced towards higher sulfate content, whereas the particles with nominal DMA:SA = 1:3 contained more DMAH than expected.
3.2. Hygroscopicity of DMAH-SO4-NH4 particles
, and show the measured hygroscopic growth factors of 10, 20, 80, and 200 nm particles corresponding to the three different compositions (nominal DMA:SA = 2:1, 1:1, and 1:2) as a function of RH. The result for 15, 25, 80, and 130 nm particle sizes and the two remaining DMA-SA solutions follow the same patterns and are presented in the online supplementary information. In addition to measurements, each figure plots the results from two sets of model runs. The solid black curve shows the E-AIM derived GFs for the case where the nominal DMA-SA ratio has been used as an input composition. Meanwhile, the dashed black curve shows the model results corresponding to the AMS composition (70 nm AMS composition for Dp,dry ≤ 80 nm and 150 nm AMS composition for Dp,dry ≥ 130 nm) and therefore, includes the effect of ammonium. Hereafter, these two model runs are referred to as E-AIMnominal and E-AIMAMS, respectively. In addition, both of these curves are combined with shaded areas whose upper bounds are determined by neglecting the Kelvin effect in model calculations.
Figure 1. A comparison between the measured and modelled hygroscopic growth factors (GF) at different relative humidities (RH) for nominal DMA:SA = 2:1. Shown are the results for 10, 20, 80, and 200 nm particle sizes. The measurement data are plotted as markers, and the solid and dashed lines correspond to E-AIM simulations with nominal and AMS measured compositions, respectively. The shaded areas above the model curves illustrate the sensitivity to the Kelvin term and the whiskers show the maximum instrumental uncertainty.
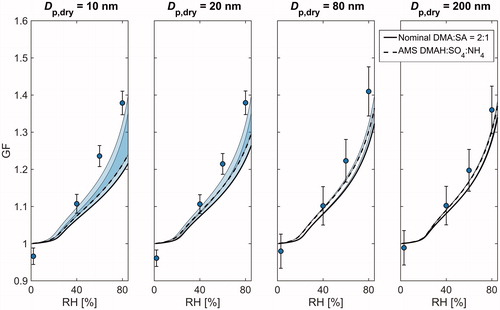
Figure 2. A comparison between the measured and modelled hygroscopic growth factors (GF) at different relative humidities (RH) for nominal DMA:SA = 1:1. Shown are the results for 10, 20, 80, and 200 nm particle sizes. The measurement data are plotted as markers, and the solid and dashed lines correspond to E-AIM simulations with nominal and AMS measured compositions, respectively. The shaded areas above the model curves illustrate the sensitivity to the Kelvin term and the whiskers show the maximum instrumental uncertainty.
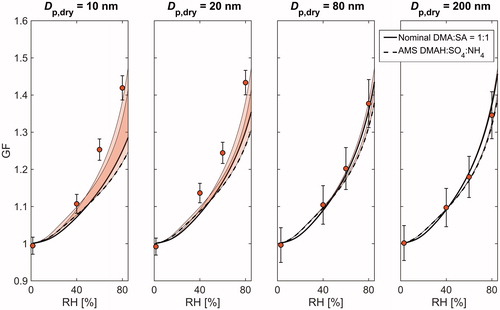
Figure 3. A comparison between the measured and modelled hygroscopic growth factors (GF) at different relative humidities (RH) for nominal DMA:SA = 1:2. Shown are the results for 10, 20, 80, and 200 nm particle sizes. The measurement data are plotted as markers, and the solid and dashed lines correspond to E-AIM simulations with nominal and AMS measured compositions, respectively. The shaded areas above the model curves illustrate the sensitivity to the Kelvin term and the whiskers show the maximum instrumental uncertainty.
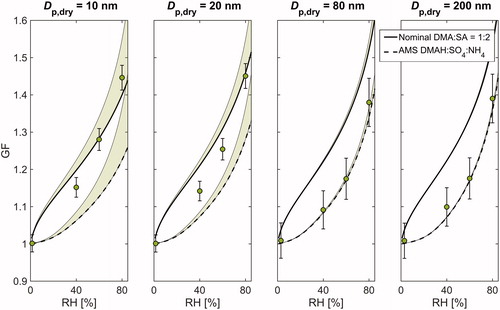
Both the modelled and measured GFs show a clear monotonous increase as a function of RH at every particle size and given composition. The model results with nominal DMA-SA composition also show a clear composition dependence with elevated GFs being associated with increased acidity. Nonetheless, when using the AMS composition, the modeled GFs become generally smaller and the variation between different compositions is considerably suppressed. This observation is not surprising keeping in mind that the measured particle composition experienced relatively less variation compared to nominal solutions.
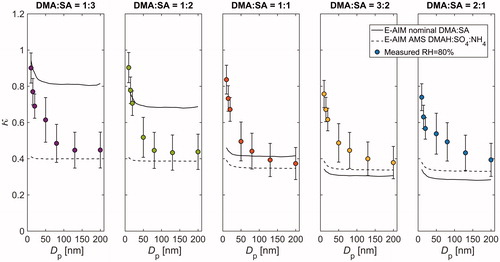
Overall, the measured GFs at Dp,dry ≥ 80 nm tend to agree relatively well with those derived from E-AIMAMS. An especially good agreement is achieved at nominal DMA:SA of 1:3, 1:2, 1:1, and 3:2, whereas in the most basic case (nominal DMA:SA = 2:1), both E-AIMnominal and E-AIMAMS slightly underestimate the hygroscopic growth. The measured GFs start to differ considerably from the model results when particle size decreases to sub-80 nm size range. Specifically, the E-AIMAMS falls clearly below the measured GFs at every composition, and with the three most basic solutions, the same goes for E-AIMnominal. This holds even if the Kelvin term is neglected in model calculations, indicating that the discrepancy cannot be solely explained by the uncertainty related to adopted values of liquid phase density and surface tension. Furthermore, as the contribution of Kelvin effect becomes progressively important with increasing particle curvature, the modelled GFs show a clear decreasing trend with decreasing particle size. Such behavior, however, is not apparent in the measurement data. Instead, in some cases, the GFs measured at 10–25 nm are even larger than those measured at 50–200 nm. The inverse size-trend is also illustrated in showing the size-dependence of hygroscopicity parameter κ (calculated at RH = 80%) for each of the five solutions. Interestingly, the κ values can increase up to 100% when particle size decreases from 200 nm down to 10 nm, highlighting the uncertainty that is related to predicting the chemical composition of the smallest atomized particles.
Figure 4. Measured and modelled hygroscopicity parameter κ versus particle size at RH = 80%. The measurement data are plotted as markers, and the solid and dashed lines correspond to E-AIM simulations with nominal and AMS measured compositions, respectively. The whiskers illustrate the maximum instrumental uncertainty.
3.3. Evaporation of the bases in the sampling lines
The above results leave open the possibility that the basic compounds could have evaporated from the smallest particles after their generation, producing particles whose modeled hygroscopic growth factors would match well against the measured values. In order to assess how the chemical composition of the smallest atomized particles could change during particle sampling, a set of simulations describing the gas-particle partitioning of DMA, SA, and NH3, was performed. The simulations were performed with the MABNAG model (Yli-Juuti et al. Citation2013; Ahlm et al. Citation2016) modified to solve the gas-particle partitioning of DMA and NH3 dynamically. The initial composition of the particles was determined according to the 70 nm AMS measurements, and the gas phase was assumed to be infinitely diluted with respect to DMA, SA and NH3. The simulations were performed for 10 nm particle size, meaning that the simulated conditions were favorable for the maximum possible evaporation. Hence, the evaporation time was set to 10 s, which was an upper-limit estimate for the maximum time that the particles spend in sampling lines before entering the aerosol instruments. The evaporation was also modeled in both high (RH = 80%) and low relative humidity (RH = 4%) to account for any non-ideal behavior of the compounds. The low RH case yielded higher evaporation, and thus, the compositions from these model runs were selected for further analysis. It is to be noted, however, that the MABNAG model uses E-AIM to calculate the activity of each compound. This means that any uncertainties in the amine thermodynamics are also included in the MABNAG simulations, and thus, the resulting MABNAG composition is a qualitative estimate.
The molar DMAH:SO4:NH4 ratios after 10 s evaporation can be found in . The MABNAG simulations yielded DMAH evaporation between 0 and 7% and NH4 evaporation between 8 and 77%, both increasing with initial basicity. To illustrate the possible impacts on hygroscopic growth, plots the measured GFs (Dp,dry = 10 nm) together with two simulated hygroscopicity curves. The dashed line corresponds to the composition determined with MABNAG, and the solid line corresponds to the composition that best fits the measured GFs assuming the AMS measured DMAH-NH4 ratio. Overall, the relative difference between the two simulated curves remains between 10 and 12% at RH = 80%, and the hygroscopicity calculated with the MABNAG composition produces clearly smaller water uptake than what is measured in all the studied cases. In order for the E-AIM to capture the measured hygroscopicity, the nanoparticles should be significantly more acidic than what can be obtained through the MABNAG simulations. In fact, even increasing the equilibrium vapor pressure of every compound by two orders of magnitude does not yield fast enough evaporation for the final MABNAG composition to describe the measured hygroscopic growth (Figure S8).
Figure 5. Modelled hygroscopic growth factors (GF) after 10 s evaporation and comparison to measurements at Dp,dry = 10 nm. The measurement data are plotted as markers, the dashed lines show the E-AIM results corresponding to the compositions obtained through MABNAG simulations, and the solid lines correspond to the E-AIM simulations with compositions that best fit the measurement data. The shaded areas illustrate the model sensitivity to the Kelvin term and the whiskers show the maximum instrumental uncertainty. The composition that best fits the measurement data is determined assuming that the molar DMAH:NH4 ratio is equal to that of 70 nm AMS measurements.
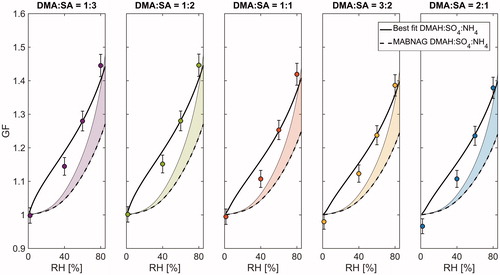
Table 2. Results from E-AIM and MABNAG simulations. The second column lists the compositions resulting in the best agreement between the measured and modelled hygroscopic growth factors. The third and fourth columns show the final compositions of 10 nm particles as obtained through MABNAG simulations.
4. Discussion
The aim of our study was to quantify the hygroscopicity of dimethylamine and sulfuric acid containing particles in the sub-200 nm size range. According to AMS measurements, the composition of the generated particles differed from the composition of the prepared DMA-SA solutions. More precisely, we observed differences in relative contribution of dimethylaminium and sulfate, but also substantial fractions of ammonium originating most likely from an external contamination. First of all, particles with nominal DMA:SA of 2:1 and 3:2 contained less DMAH than expected and the difference increased with decreasing particle size. This could be explained by DMA evaporation that can occur both during the preparation of DMA-SA solutions as well as during particle sampling and drying (Chu et al. Citation2015; Sauerwein et al. Citation2015). For example, Chu et al. (Citation2015) observed that in the case of dimethylaminium sulfate (DMAS) particles with initial aminium-to-sulfate ratio of 1.9 were not stable, but instead, equilibrated towards 1.5 during dehumidification. These trends are comparable to our observations at nominal DMA:SA of 2:1 and 3:2.
For nominal DMA:SA = 1:3, we observe an excess amount of DMAH. Part of this excess DMAH could be attributed to impurities in bulk SA that was used in preparation of DMA-SA solutions. While the solutions were prepared assuming 100 wt. % SA, for example Sauerwein et al. (Citation2015) found an SA concentration of approximately 95.5 wt. %, which is close to the lower range of nominal purity (95–98 wt. %). However, such a difference in bulk SA concentration would not be sufficient to explain the observed shift towards higher DMAH content. Although Ouyang et al. (Citation2015) suggested that SA could dissociate from DMA-SA nanoclusters, it is highly unlikely, that this could happen in the particles that are larger by almost two orders of magnitude. Nevertheless, we cannot rule out a possibility that DMA that conceivably evaporates from the smallest particles could re-condense onto larger ones and thus, serve as an internal source of DMAH.
In addition, we detected ammonium in the generated particles in all studied cases. This highlights the importance of careful chemical characterization of the measured particles. To our knowledge, this is the first study where the composition of laboratory generated DMA-SA particles has been determined with an AMS. For example, Sauerwein et al. (Citation2015) and Chu et al. (Citation2015) determined the aminium-to-sulfate ratios of the studied droplets with an ion chromatograph (IC), whereas Chan and Chan (Citation2013) inferred the aminium-sulfate composition indirectly from the mass change in EDB (Electrodynamic Balance). In contrast, Qiu and Zhang (Citation2012) and Rovelli et al. (Citation2017) did not present any direct nor indirect measurements on particle composition, but rather relied on accurate and validated solution preparation method. In addition, it is yet unclear, whether Sauerwein et al. (Citation2015) and Chu et al. (Citation2015) considered the possible presence of ammonium in their IC analysis, or if it simply was not observed. According to our results, this can be a crucial factor, since ammonium can strongly affect the hygroscopic properties of the studied mixtures, especially with high particulate sulfuric acid content.
Due to the presence of ammonium, direct comparison between our hygroscopicity measurements and previously reported values can be rather challenging. However, in many studies, the measured values are combined with modeled hygroscopicity curves calculated with E-AIM enabling a possibility for indirect comparison. Both Clegg et al. (Citation2013) and Rovelli et al. (Citation2017) found a good agreement between the modeled and measured GFs of DMAS. In their studies, the particle sizes were large enough that the curvature effect could be disregarded. On the contrary, Chu et al. (Citation2015) found that for 3:2 aminium-to-sulfate molar ratio, the water-to-solute molar ratios were lower than what was calculated with E-AIM. In addition, Sauerwein et al. (Citation2015) observed higher hygroscopicity of DMAS particles than what was measured with HTDMA by Qiu and Zhang (Citation2012) and modeled by Clegg et al. (Citation2013). Similarly, we found that for nominal DMA:SA = 2:1, the model slightly underestimates the measured water uptake, especially at elevated RH.
Chu et al. (Citation2015) speculated that the difference between the HTDMA results by Qiu and Zhang (Citation2012) and other methods such as Raman spectrometry and water activity measurements (Chu et al. Citation2015; Sauerwein et al. Citation2015), could be partially attributed to the fact that Qiu and Zhang (Citation2012) assumed GFs equal to unity at 12% RH. As Chu et al. (Citation2015) further pointed out, aminium sulfate particles can be hydrous at 10% RH and even lower. This can eventually lead to underestimation of hygroscopic growth at elevated RH. In our measurements, as described in Section 2.2, the initial dry size selection was always performed at RH < 3%, in which the water content of the particles was assumedly imperceptible.
Sauerwein et al. (Citation2015) also showed that the water uptake increases when the molar dimethylaminium-to-sulfate ratio increases from bisulfate towards sulfate composition. A similar behavior was also observed by Chu et al. (Citation2015) when they compared the hygroscopicities of equilibrated and non-equilibrated DMAS particles. In our case, the GFs measured at 80% RH and Dp,dry ≥ 50 nm tend to slightly increase when the nominal DMA:SA shifts from 1:1 towards 2:1. Nevertheless, this observation contradicts with the composition-dependence predicted by E-AIM, but also, with measurements conducted at smaller particle sizes.
Along with the reversed composition-dependence, the measured GFs deviate significantly from the modeled values when the particle size decreases. According to the size-dependence of hygroscopicity parameter κ, it is also evident that the generated particles have a size-dependent composition. We would like to highlight that the smallest and largest particles were always generated from the same solution with constant atomizer settings, and thus, the only possible explanation for the size-dependent composition is the evaporation of compounds during the generation and subsequent dilution. Another factor that could potentially result in size-dependent composition would be the presence of surface-active organic impurities, whose relative concentrations tend to increase with decreasing particle size. Nonetheless, as the hygroscopicity of organic compounds is generally clearly lower than that of SA, the increasing concentration of surface-active organic impurities with decreasing particle size cannot explain the simultaneous increase in GFs.
More precisely, it is likely that due to the increased particle surface-to-volume ratio, DMA and NH3 evaporate from the smallest particles resulting in higher acidity than what is measured with the AMS. This makes the direct comparison of the measured and modeled values indeed more challenging. A significant DMA and NH3 evaporation would be required for the E-AIM to be able to predict the measured GFs (). Such a base evaporation, in the timescales of a measurement, could not be produced when the E-AIM was coupled with a dynamic evaporation model (MABNAG). In fact, such evaporation was not possible even if the equilibrium vapor pressures of the compounds were 100-fold to the simulations presented in (see also Figure S8). In general, these results are in line with observations by Ahlm et al. (Citation2016) who studied the evolution of a nucleating SA-DMA-H2O system in the CLOUD (Cosmics Leaving OUtdoor Droplets) chamber. The authors used the MABNAG model to simulate the composition of the freshly formed particles and observed that the modeled base-to-SA ratios were generally much higher than what was directly measured with TDCIMS (Lawler et al. Citation2016) and indirectly inferred from nano-HTDMA data (Kim et al. Citation2016) using the E-AIM. In addition, they found a size-dependent disagreement between the two latter methods with E-AIM derived compositions showing much stronger increase in aerosol basicity with increasing particle size. All things considered, given that the evaporation of the bases in our simulations was not fast enough to produce DMAH:SO4:NH4 ratios whose hygroscopic behavior would be similar to the measured values, it is likely that E-AIM inaccurately describes the amine thermodynamics in the DMA-SA-NH3-H2O systems.
One interesting remark concerns the fact that we observed significant changes in particle size when running the HTDMAs in low-humidity conditions. At smaller sizes, the most acidic particles lie approximately around GF = 1, whereas the measurements with nominal DMA:SA of 3:2 and 2:1 fall below unity by up to 4%. At larger sizes, the most DMA-containing particles have GF < 1, whereas the most acidic particles, which also contain comparably less evaporable amines, already start to take up water at ∽3% RH. Because both of the instruments were calibrated for dry size offsets before each measurement, it is very unlikely that the observed variation would occur due to changes in instrumental performance. In some studies (Zardini et al. Citation2008), GFs smaller than one have been associated with structural rearrangements due to condensation of water onto non-spherical or branch-shaped particles. Again, this explanation would be unlikely as the “dry” RH in our measurements always remained below ∼3%, and thus, the particles may have experienced only small humidity gradients between the dry size selection and DMA2. Moreover, Qiu and Zhang (Citation2012) used an aerosol particle mass analyzer (APM) to assess the morphology of aminium sulfate particles. They observed that the particles were uniform and compact, and close to spherical in shape. However, one cannot rule out the possibility that some of the volatile material evaporates from the particle phase after the initial dry size selection. This could be the case, especially within the nano-HTDMA, where the sample flow is diluted with clean pressurized air inside the differential mobility analyzers. Nevertheless, it is yet unclear whether the possible evaporation occurs regardless of RH or if it only concerns the measurements at low humidity.
5. Summary and conclusions
In this study, the hygroscopic growth factors of 10–200 nm DMAH-SO4-NH4 particles were measured with five different molar compositions. These values were then compared to those predicted with a state-of-the-art thermodynamic equilibrium model (E-AIM). The model was able to predict the hygroscopic growth well for the largest particles with diameters of 80 nm or above. Nevertheless, the agreement between the measurements and the model became poorer with decreasing particle size, and the model tended to underestimate the hygroscopic growth, especially when the particles were towards more basic composition.
The analysis on hygroscopicity parameter κ indicated that the small sub-50 nm particles were more acidic than the 70 and 150 nm particles measured with an AMS, even if they were generated from the same solution. Moreover, in order for the E-AIM to capture their measured hygroscopic growth, the particulate base-to-sulfate ratios should have been around 0.6–0.7:1, suggesting a possible base evaporation in the sampling lines. However, even with conditions favorable for maximum base evaporation, E-AIM coupled with a dynamic evaporation model (MABNAG) was not able to produce compositions that would be even close to those required. This suggests that E-AIM may not be able to describe the amine thermodynamics accurately in DMA-SA-NH3-H2O system.
One possible reason for this discrepancy is that in E-AIM dimethylaminium is assumed to interact with water similar to ammonium. In this case, it would mean that the dimethylaminium-water interaction deviates more from the ideal solution behavior than the ammonium-water interaction. The results show that there are still knowledge gaps regarding the thermodynamics of DMA-SA-NH3-H2O system. Furthermore, the results highlight that the future studies must be accompanied by careful and thorough chemical characterization in order to diminish the uncertainties caused by instability of the studied compounds as well as temporal and size-dependent evolution of chemical composition.
UAST_1484071_Supplemental_File.zip
Download Zip (2 MB)Additional information
Funding
References
- Ahlm, L., Yli-Juuti, T., Schobesberger, S., Praplan, A. P., Kim, J., Tikkanen, O. P., Lawler, M. J., Smith, J. N., Tröstl, J., Navarro, J. C. A., Baltensperger, U., Bianchi, F., Donahue, N. M., Duplissy, J., Franchin, A., Jokinen, T., Keskinen, H., Kirkby, J., Kürten, A., Laaksonen, A., Lehtipalo, K., Petäjä, T., Riccobono, F., Rissanen, M. P., Rondo, L., Schallhart, S., Simon, M., Winkler, P. M., Worsnop, D. R., Virtanen, A., and Riipinen, I. (2016). Modeling the Thermodynamics and Kinetics of Sulfuric Acid-Dimethylamine-Water Nanoparticle Growth in the CLOUD Chamber. Aerosol. Sci. Tech., 50:1017–1032.
- Allan, J. D., Delia, A. E., Coe, H., Bower, K. N., Alfarra, M. R., Jimenez, J. L., Middlebrook, A. M., Drewnick, F., Onasch, T. B., Canagaratna, M. R., Jayne, J. T., and Worsnop, D. R. (2004). A Generalised Method for the Extraction of Chemically Resolved Mass Spectra from Aerodyne Aerosol Mass Spectrometer Data. J. Aerosol. Sci., 35:909–922.
- Almeida, J., Schobesberger, S., Kürten, A., Ortega, I. K., Kupiainen-Määttä, O., Praplan, A. P., Adamov, A., Amorim, A., Bianchi, F., Breitenlechner, M., David, A., Dommen, J., Donahue, N. M., Downard, A., Dunne, E., Duplissy, J., Ehrhart, S., Flagan, R. C., Franchin, A., Guida, R., Hakala, J., Hansel, A., Heinritzi, M., Henschel, H., Jokinen, T., Junninen, H., Kajos, M., Kangasluoma, J., Keskinen, H., Kupc, A., Kurtén, T., Kvashin, A. N., Laaksonen, A., Lehtipalo, K., Leiminger, M., Leppä, J., Loukonen, V., Makhmutov, V., Mathot, S., McGrath, M. J., Nieminen, T., Olenius, T., Onnela, A., Petäjä, T., Riccobono, F., Riipinen, I., Rissanen, M., Rondo, L., Ruuskanen, T., Santos, F. D., Sarnela, N., Schallhart, S., Schnitzhofer, R., Seinfeld, J. H., Simon, M., Sipilä, M., Stozhkov, Y., Stratmann, F., Tome, A., Tröstl, J., Tsagkogeorgas, G., Vaattovaara, P., Viisanen, Y., Virtanen, A., Vrtala, A., Wagner, P. E., Weingartner, E., Wex, H., Williamson, C., Wimmer, D., Ye, P. L., Yli-Juuti, T., Carslaw, K. S., Kulmala, M., Curtius, J., Baltensperger, U., Worsnop, D. R., Vehkamäki, H., and Kirkby, J. (2013). Molecular Understanding of Sulphuric Acid-Amine Particle Nucleation in the Atmosphere. Nature, 502:359.
- Bergman, T., Laaksonen, A., Korhonen, H., Malila, J., Dunne, E. M., Mielonen, T., Lehtinen, K. E. J., Kühn, T., Arola, A., and Kokkola, H. (2015). Geographical and Diurnal Features of Amine-Enhanced Boundary Layer Nucleation. J. Geophys. Res. Atmos., 120:9606–9624.
- Canagaratna, M. R., Jayne, J. T., Jimenez, J. L., Allan, J. D., Alfarra, M. R., Zhang, Q., Onasch, T. B., Drewnick, F., Coe, H., Middlebrook, A., Delia, A., Williams, L. R., Trimborn, A. M., Northway, M. J., DeCarlo, P. F., Kolb, C. E., Davidovits, P., and Worsnop, D. R. (2007). Chemical and Microphysical Characterization of Ambient Aerosols with the Aerodyne Aerosol Mass Spectrometer. Mass Spectrom. Rev., 26:185–222.
- Chan, L. P., and Chan, C. K. (2013). Role of the Aerosol Phase State in Ammonia/Amines Exchange Reactions. Environ. Sci. Technol., 47:5755–5762.
- Chu, Y. X., Sauerwein, M., and Chan, C. K. (2015). Hygroscopic and Phase Transition Properties of Alkyl Aminium Sulfates at Low Relative Humidities. Phys. Chem. Chem. Phys., 17:19789–19796.
- Clegg, S. L., and Wexler, A. S. (2011a). Densities and Apparent Molar Volumes of Atmospherically Important Electrolyte Solutions. 1. The Solutes H2SO4, HNO3, HCl, Na2SO4, NaNO3, NaCl, (NH4)2SO4, NH4NO3, and NH4Cl from 0 to 50 °C, Including Extrapolations to Very Low Temperature and to the Pure Liquid State, and NaHSO4, NaOH, and NH3 at 25 °C. J. Phys. Chem. A, 115:3393–3460.
- Clegg, S. L., and Wexler, A. S. (2011b). Densities and Apparent Molar Volumes of Atmospherically Important Electrolyte Solutions. 2. The Systems H+-HSO4−-SO42−-H2O from 0 to 3 Mol Kg−1 as a Function of Temperature and H+-NH4+-HSO4−-SO42−-H2O from 0 to 6 Mol Kg−1 at 25 °C Using a Pitzer Ion Interaction Model, and NH4HSO4-H2O and (NH4)3H(SO4)2-H2O over the Entire Concentration Range. J. Phys. Chem. A, 115:3461–3474.
- Clegg, S. L., Brimblecombe, P., and Wexler, A. S. (1998). Thermodynamic Model of the System H+-NH4+-SO42−-NO3−-H2O at Tropospheric Temperatures. J. Phys. Chem. A, 102:2155–2154.
- Clegg, S. L., Qiu, C., and Zhang, R. Y. (2013). The Deliquescence Behaviour, Solubilities, and Densities of Aqueous Solutions of Five Methyl- and Ethyl-Aminium Sulphate Salts. Atmos. Environ., 73:145–158.
- Clegg, S. L., Seinfeld, J. H., and Brimblecombe, P. (2001). Thermodynamic Modelling of Aqueous Aerosols Containing Electrolytes and Dissolved Organic Compounds. J. Aerosol Sci., 32:713–738.
- DeCarlo, P. F., Kimmel, J. R., Trimborn, A., Northway, M. J., Jayne, J. T., Aiken, A. C., Gonin, M., Fuhrer, K., Horvath, T., Docherty, K. S., Worsnop, D. R., and Jimenez, J. L. (2006). Field-Deployable, High-Resolution, Time-of-Flight Aerosol Mass Spectrometer. Anal. Chem., 78:8281–8289.
- Erupe, M. E., Viggiano, A. A., and Lee, S. H. (2011). The Effect of Trimethylamine on Atmospheric Nucleation Involving H2SO4. Atmos. Chem. Phys., 11:4767–4775.
- Fredenslund, A., Jones, R. L., and Prausnitz, J. M. (1975). Group-Contribution Estimation of Activity-Coefficients in Nonideal Liquid-Mixtures. Aiche J., 21:1086–1099.
- Ge, X. L., Wexler, A. S., and Clegg, S. L. (2011a). Atmospheric Amines - Part I. A Review. Atmos. Environ., 45:524–546.
- Ge, X. L., Wexler, A. S., and Clegg, S. L. (2011b). Atmospheric Amines - Part II. Thermodynamic Properties and Gas/Particle Partitioning. Atmos. Environ., 45:561–577.
- Hansen, H. K., Rasmussen, P., Fredenslund, A., Schiller, M., and Gmehling, J. (1991). Vapor-Liquid-Equilibria by Unifac Group Contribution.5. Revision and Extension. Ind. Eng. Chem. Res., 30:2352–2355.
- Jayne, J. T., Leard, D. C., Zhang, X. F., Davidovits, P., Smith, K. A., Kolb, C. E., and Worsnop, D. R. (2000). Development of an Aerosol Mass Spectrometer for Size and Composition Analysis of Submicron Particles. Aerosol. Sci. Tech., 33:49–70.
- Jen, C. N., McMurry, P. H., and Hanson, D. R. (2014). Stabilization of Sulfuric Acid Dimers by Ammonia, Methylamine, Dimethylamine, and Trimethylamine. J. Geophys. Res. Atmos., 119:7502–7514.
- Keskinen, H., Romakkaniemi, S., Jaatinen, A., Miettinen, P., Saukko, E., Joutsensaari, J., Mäkelä, J. M., Virtanen, A., Smith, J. N., and Laaksonen, A. (2011). On-Line Characterization of Morphology and Water Adsorption on Fumed Silica Nanoparticles. Aerosol. Sci. Tech., 45:1441–1447.
- Kim, J., Ahlm, L., Yli-Juuti, T., Lawler, M., Keskinen, H., Tröstl, J., Schobesberger, S., Duplissy, J., Amorim, A., Bianchi, F., Donahue, N. M., Flagan, R. C., Hakala, J., Heinritzi, M., Jokinen, T., Kürten, A., Laaksonen, A., Lehtipalo, K., Miettinen, P., Petäjä, T., Rissanen, M. P., Rondo, L., Sengupta, K., Simon, M., Tome, A., Williamson, C., Wimmer, D., Winkler, P. M., Ehrhart, S., Ye, P., Kirkby, J., Curtius, J., Baltensperger, U., Kulmala, M., Lehtinen, K. E. J., Smith, J. N., Riipinen, I., and Virtanen, A. (2016). Hygroscopicity of Nanoparticles Produced from Homogeneous Nucleation in the CLOUD Experiments. Atmos. Chem. Phys., 16:293–304.
- Kürten, A., Jokinen, T., Simon, M., Sipilä, M., Sarnela, N., Junninen, H., Adamov, A., Almeida, J., Amorim, A., Bianchi, F., Breitenlechner, M., Dommen, J., Donahue, N. M., Duplissy, J., Ehrhart, S., Flagan, R. C., Franchin, A., Hakala, J., Hansel, A., Heinritzi, M., Hutterli, M., Kangasluoma, J., Kirkby, J., Laaksonen, A., Lehtipalo, K., Leiminger, M., Makhmutov, V., Mathot, S., Onnela, A., Petäjä, T., Praplan, A. P., Riccobono, F., Rissanen, M. P., Rondo, L., Schobesberger, S., Seinfeld, J. H., Steiner, G., Tome, A., Tröstl, J., Winkler, P. M., Williamson, C., Wimmer, D., Ye, P. L., Baltensperger, U., Carslaw, K. S., Kulmala, M., Worsnop, D. R., and Curtius, J. (2014). Neutral Molecular Cluster Formation of Sulfuric Acid-Dimethylamine Observed in Real Time under Atmospheric Conditions. Proc. Natl. Acad. Sci. USA, 111:15019–15024.
- Kurtén, T., Loukonen, V., Vehkamäki, H., and Kulmala, M. (2008). Amines are Likely to Enhance Neutral and Ion-Induced Sulfuric Acid-Water Nucleation in the Atmosphere More Effectively than Ammonia. Atmos. Chem. Phys., 8:4095–4103.
- Lawler, M. J., Winkler, P. M., Kim, J., Ahlm, L., Tröstl, J., Praplan, A. P., Schobesberger, S., Kürten, A., Kirkby, J., Bianchi, F., Duplissy, J., Hansel, A., Jokinen, T., Keskinen, H., Lehtipalo, K., Leiminger, M., Petäjä, T., Rissanen, M., Rondo, L., Simon, M., Sipilä, M., Williamson, C., Wimmer, D., Riipinen, I., Virtanen, A., and Smith, J. N. (2016). Unexpectedly Acidic Nanoparticles Formed in Dimethylamine-Ammonia-Sulfuric-Acid Nucleation Experiments at CLOUD. Atmos. Chem. Phys., 16:13601–13618.
- Loukonen, V., Kurtén, T., Ortega, I. K., Vehkamäki, H., Padua, A. A. H., Sellegri, K., and Kulmala, M. (2010). Enhancing Effect of Dimethylamine in Sulfuric Acid Nucleation in the Presence of Water - a Computational Study. Atmos. Chem. Phys., 10:4961–4974.
- Mäkelä, J. M., Yli-Koivisto, S., Hiltunen, V., Seidl, W., Swietlicki, E., Teinilä, K., Sillanpää, M., Koponen, I. K., Paatero, J., Rosman, K., and Hämeri, K. (2001). Chemical Composition of Aerosol during Particle Formation Events in Boreal Forest. Tellus B, 53:380–393.
- McNeill, V. F. (2015). Aqueous Organic Chemistry in the Atmosphere: Sources and Chemical Processing of Organic Aerosols. Environ. Sci. Technol., 49:1237–1244.
- Ouyang, H., He, S. Q., Larriba-Andaluz, C., and Hogan, C. J. (2015). IMS-MS and IMS-IMS Investigation of the Structure and Stability of Dimethylamine-Sulfuric Acid Nanoclusters. J. Phys. Chem. A, 119:2026–2036.
- Petters, M. D., and Kreidenweis, S. M. (2007). A Single Parameter Representation of Hygroscopic Growth and Cloud Condensation Nucleus Activity. Atmos. Chem. Phys., 7:1961–1971.
- Qiu, C., and Zhang, R. Y. (2012). Physiochemical Properties of Alkylaminium Sulfates: Hygroscopicity, Thermostability, and Density. Environ. Sci. Technol., 46:4474–4480.
- Rovelli, G., Miles, R. E. H., Reid, J. P., and Clegg, S. L. (2017). Hygroscopic Properties of Aminium Sulfate Aerosols. Atmos. Chem. Phys., 17:4369–4385.
- Sauerwein, M., Clegg, S. L., and Chan, C. K. (2015). Water Activities and Osmotic Coefficients of Aqueous Solutions of Five Alkylaminium Sulfates and Their Mixtures with H2SO4 at 25 °C. Aerosol. Sci. Tech., 49:566–579.
- Smith, J. N., Barsanti, K. C., Friedli, H. R., Ehn, M., Kulmala, M., Collins, D. R., Scheckman, J. H., Williams, B. J., and McMurry, P. H. (2010). Observations of Aminium Salts in Atmospheric Nanoparticles and Possible Climatic Implications. P. Natl. Acad. Sci. USA, 107:6634–6639.
- Stein, S. E., director NIST Mass Spec Data Center. (2018). "Mass Spectra" in NIST Chemistry WebBook, NIST Standard Reference Database Number 69, P. J. Linstrom and W. G. Mallard, eds., National Institute of Standards and Technology, Gaithersburg MD, retrieved February 26, 2018.
- Väisänen, O., Ruuskanen, A., Ylisirniö, A., Miettinen, P., Portin, H., Hao, L. Q., Leskinen, A., Komppula, M., Romakkaniemi, S., Lehtinen, K. E. J., and Virtanen, A. (2016). In-Cloud Measurements Highlight the Role of Aerosol Hygroscopicity in Cloud Droplet Formation. Atmos. Chem. Phys., 16:10385–10398.
- VandenBoer, T. C., Petroff, A., Markovic, M. Z., and Murphy, J. G. (2011). Size Distribution of Alkyl Amines in Continental Particulate Matter and Their Online Detection in the Gas and Particle Phase. Atmos. Chem. Phys., 11:4319–4332.
- Wexler, A. S., and Clegg, S. L. (2002). Atmospheric Aerosol Models for Systems Including the Ions H+, NH4+, Na+, SO42-, NO3-,Cl-, Br-, and H2O. J. Geophys. Res., 107(D14): ACH 14-1–ACH 14-14.
- Yli-Juuti, T., Barsanti, K., Hildebrandt Ruiz, L., Kieloaho, A. J., Makkonen, U., Petäjä, T., Ruuskanen, T., Kulmala, M., and Riipinen, I. (2013). Model for Acid-Base Chemistry in Nanoparticle Growth (MABNAG). Atmos. Chem. Phys., 13:12507–12524.
- Youn, J. S., Crosbie, E., Maudlin, L. C., Wang, Z., and Sorooshian, A. (2015). Dimethylamine as a Major Alkyl Amine Species in Particles and Cloud Water: Observations in Semi-Arid and Coastal Regions. Atmos. Environ., 122:250–258.
- Zardini, A. A., Sjogren, S., Marcolli, C., Krieger, U. K., Gysel, M., Weingartner, E., Baltensperger, U., and Peter, T. (2008). A Combined Particle Trap/HTDMA Hygroscopicity Study of Mixed Inorganic/Organic Aerosol Particles. Atmos. Chem. Phys., 8:5589–5601.
- Zieger, P., Fierz-Schmidhauser, R., Weingartner, E., and Baltensperger, U. (2013). Effects of Relative Humidity on Aerosol Light Scattering: results from Different European Sites. Atmos. Chem. Phys., 13:10609–10631.
- Zieger, P., Väisänen, O., Corbin, J. C., Partridge, D. G., Bastelberger, S., Mousavi-Fard, M., Rosati, B., Gysel, M., Krieger, U. K., Leck, C., Nenes, A., Riipinen, I., Virtanen, A., and Salter, M. E. (2017). Revising the Hygroscopicity of Inorganic Sea Salt Particles. Nat. Comms., 8:15883.