
Abstract
Electrical mobility size spectrometers (with a neutralizer, an electrical mobility classifier, and a detector as key components) are widely used to measure aerosol size distributions. The performance of a neutralizer is often evaluated separately from the spectrometer. In real-world applications of a neutralizer, i.e., typically with uncontrolled composition of the neutralizer carrier gas including trace constituents that can lead to variabilities in properties of positive and negative ions, charge fractions may differ from those predicted by widely used aerosol charging models with fixed ion properties and subsequently cause significant uncertainties in reported aerosol size distributions. In this study, we proposed an empirical method to retrieve the variations in neutralizer ion properties and aerosol charge fractions when measuring aerosol size distributions. Our approach requires measuring both positively and negatively charged particles using the electrical mobility size spectrometer to provide information on the performance of the neutralizer. Bipolar diffusion charging theories were applied to illustrate that aerosol charge fractions are governed by the mobility ratio of positive and negative ions. Positively and negatively charged particles measured by the spectrometer can be used to estimate the mobility ratio of positive and negative ions for the neutralizer. A modified Gunn and Woessner’s formula can then be used to calculate aerosol charge fractions from the retrieved ion mobility ratio. These charge fractions can be used for size distribution data inversion. Both simulated aerosols and experiments were used to evaluate the proposed method. We found that this new method can capture the variations in neutralizer ion properties and aerosol charge fractions under various conditions and help to achieve more accurate measurement of aerosol size distributions.
Copyright © 2018 American Association for Aerosol Research
Editor:
1. Introduction
An electrical mobility size spectrometer is composed of an aerosol neutralizer, a differential mobility analyzer (DMA), and a detector (e.g., condensation particle counter (CPC)). These instruments are widely used to measure aerosol particle number size distributions (PNSDs). The neutralizer conditions the charge state of aerosols using bipolar ions produced in the carrier gas with methods such as corona, radioactive, and soft X-ray ionization (Whitby and Peterson Citation1965; Cooper and Reist Citation1973; Liu and Pui Citation1974; Shimada et al. Citation2002). Downstream of the neutralizer, a fraction of particles is positively or negatively charged. Either positively or negatively charged particles are then selected by the DMA based on their electrical mobility and counted by the detector. We refer the distribution of these measured particles as the raw PNSD from which size-dependent aerosol charge fractions are used in data inversion (e.g., Hagen and Alofs Citation1983) to recover the orginal (or inverted) PNSD. If inversions are carried out using inaccurate aerosol charge fractions, those inaccuracies will lead to errors in the inverted PNSD. Charge fractions are governed by ion mobilities and masses, which are affected by the composition of the neutralizer carrier gas. Those dependencies are typically not accounted for when inverting data.
Conventionally, aerosol charge fractions are often evaluated using bipolar diffusion charging theories and experiments with the neutralizer separated from an electrical mobility size spectrometer. Gunn and Woessner (Citation1956) reported an analytical solution to predict charge fractions for large particles. For particles in the transition regime, Fuchs’ theory (Fuchs Citation1963; Hoppel and Frick Citation1986) is widely used to quantify the ion-particle collision rates and to predict aerosol charge fractions. For nanometer sized particles, Hoppel and Frick (Citation1986) applied the three body trapping correction to Fuchs’ theory. Improved models (Gopalakrishnan et al. Citation2013; López-Yglesias and Flagan 2013) that properly account for the Maxwell-Boltzmann speed distribution of ions (Filippov Citation1993) have recently been reported. Ion properties are essential input parameters for these theoretical analyses. They have mostly been determined through indirectly fitting to measured charge fractions downstream of a neutralizer using predictions from Fuchs’ theory, and their values vary with studies (e.g., Hussin et al. Citation1983; Adachi, Kousaka, and Okuyama Citation1985; Wiedensohler et al. Citation1986; Reischl et al. Citation1996). A single positive ion and a single negative ion, each with a fixed mobility and mass, are commonly used. Wiedensohler (Citation1988) calculated stationary aerosol charge fractions using Fuchs’ theory with fixed ion properties and then fitted them with an approximation that has been widely used to calculate charge fractions for aerosol size distribution data inversion (Wiedensohler et al. 2012). Maisser et al. (Citation2015) measured ion mobilities and masses downstream of a radioactive source using a tandem mobility-mass measurement system and reported broad distributions of positive and negative ions. After incorporating these polydisperse ions into the improved model by Gopalakrishnan et al. (Citation2013), they found that the calculated charge fractions are consistent with those predicted by Wiedensohler’s approximation.
In real-world applications of a neutralizer (as a component of an electrical mobility size spectrometer and typically with uncontrolled composition of the neutralizer carrier gas), charge fractions can differ significantly from those predicted using Wiedensohler’s approximation or aerosol charging models with fixed ion properties. Ion properties can change significantly when the carrier gas switches from air to nitrogen, argon or helium (Wiedensohler et al. Citation1986; Adachi et al. Citation1987). In addition, trace constituents or “impurities” in the carrier gas can alter neutralizer ion properties significantly (e.g., Mäkelä et al. Citation1996; Lee et al. Citation2005b; Luts et al. Citation2011; Steiner and Reischl Citation2012). For instance, when using organic solvents to generate aerosols through the atomization process, the solvent residue could lead to significant variations in ion properties and in aerosol charge fractions (Chen, McMurry, and Jiang Citation2018). Hoppel and Frick (Citation1990) suggested that the unequal mobility of positive and negative ions can lead to a changing balance in ion concentrations downstream of the neutralizer and thus variations in aerosol charge fractions. Positive and negative charge fractions are more identical to each other for soft X-ray neutralizers than those produced by radioactive ionization sources such as 210Po, 85Kr or 241Am (Lee et al. Citation2005a; Jiang et al. Citation2014; Kallinger and Szymanski Citation2015). In some commercial spectrometers, a different set of charge fractions (Tigges, Jain, and Schmid Citation2015a) has been used for soft X-ray neutralizers in comparison to Wiedensohler’s approximation for radioactive neutralizers. Though charged particles of only one polarity is conventionally measured by a spectrometer, Jiang et al. (Citation2014) suggested that charge fractions of both positively and negatively charged particles should be simultaneously considered. If correct charge fractions are used, the inverted PNSDs based on positively and negatively charged particles should be close to each other. Using charge fractions calculated by Wiedensohler’s approximation for data inversion, a ∼10% deviation was observed when measuring positively and negatively charged particles (Wiedensohler et al. Citation2018). In order to achieve an accurate estimation of aerosol charge fractions for size distribution measurement, it appears that the conventional method would require quantifying the broad distributions of ions and their dynamics, flow patterns, spatial uniformity, and the interactions between ions and particles inside and downstream of the neutralizer (before mobility classification by a DMA) (Jiang et al. Citation2014). This would often be impractical.
In this study, we report a practical method to retrieve the variations in neutralizer ion properties and aerosol charge fractions. It requires measuring both positively and negatively charged particles using the electrical mobility size spectrometer. Jiang et al. (Citation2014) suggested that charge fractions achieved by a neutralizer are largely influenced by the relative differences in properties (mobility, mass, and concentration) of positive and negative ions. We hypothesize that the raw PNSDs of positively and negatively charged particles provide key information on these relative differences and on charge fractions achieved by a neutralizer. This hypothesis was tested using both Gunn and Woessner’s formula and Fuchs’ theory. A procedure was proposed to obtain the mobility ratio of positive and negative ions from the raw PNSDs for particles of both polarities. A modified Gunn and Woessner’s formula was then developed to calculate aerosol charge fractions from the retrieved ion mobility ratio. These charge fractions can be used for size distribution data inversion. Both simulated aerosols and experiments were used to evaluate the proposed empirical method.
2. Estimating the ion mobility ratio from the raw PNSDs
In this section, we first show that the ratio of positive to negative aerosol charge fractions is governed by the ratio of positive ion mobility to negative ion mobility. Then, we show that the raw PNSDs of positively and negatively charged particles reported by electrical mobility size spectrometers reflect the difference between the fractions of positively charged particles and negatively charged particles and can be used to estimate the mobility ratio of positive and negative ions.
2.1. Relation between aerosol charge fractions and the ion mobility ratio
Analytical solutions from Gunn and Woessner (Citation1956) and Fuchs’ theory (Fuchs Citation1963; Hoppel and Frick Citation1986) were used to investigate the relation between aerosol charge fractions and ion properties. Due to the limitation of equilibrium Boltzmann distribution (Wiedensohler Citation1988; Lopez-Yglesias and Flagan Citation2013), Gunn and Woessner’s formula was only applied for particles larger than 70 nm.
The analytical solution from Gunn and Woessner (Citation1956) is given by;
(1)
where fG(±q, dp) is the fraction of size dp particles carrying ±q elementary charges (the subscript G denotes that the fraction was calculated using Gunn and Woessner’s formula); e is the elementary charge; ε0 is the permittivity of vacuum; kB is the Boltzmann’s constant; T is the temperature;
is the concentration of positive or negative ions. For particles with the diameter of dp and q elementary charges, the ratio of positive to negative charge fractions can be estimated as (with the assumption that the concentrations of positive and negative ions are equal to each other);
(2)
The logarithmic ratio of positive to negative charge fractions with the same number of elementary charges is then directly proportional to the logarithmic mobility ratio of positive and negative ions. The proportionality constant is twice the number of charges.
A similar proportional relation was found when applying Fuchs’ theory for particles with diameters of 30 nm and 100 nm, respectively (). Detailed equations to calculate aerosol charge fractions are given in Section 1 in the online supplemental information (SI). Both ion mobility and mass are essential input parameters for the calculation. As summarized by Tigges, Jain, and Schmid (Citation2015b) and given in Figure S2 in the SI, various values for ion mobility were used in previous studies. The typical range of ion mobilities for neutralizers with air as the carrier gas is 1.00 ∼ 2.00 10−4 m2/V·s. With an interval of 0.05
10−4 m2/V·s, 441 combinations of positive and negative ion mobilities were used in this study. For a given ion mobility, the corresponding ion mass was estimated using the fitted mass-mobility equations by Mäkelä et al. (Citation1996), a fitting to Kilpatrick’s (Citation1971) data, and by Steiner et al. (Citation2014), a fitting to both Kilpatrick’s and newly measured data. shows that the logarithmic ratio of positive to negative charge fractions with the same number of elementary charges for 30 nm and 100 nm particles is proportional to the logarithmic mobility ratio of positive and negative ions. The proportional relations using the two fitted mass-mobility equations are similar. In addition, measured aerosol charge fractions from three previous studies (Hussin et al. Citation1983; Adachi, Kousaka, and Okuyama Citation1985; Wiedensohler et al. Citation1986) agree well with the proportional relation.
The proportional relation was tested for particles with a broad size range using Fuchs’ theory. Analogous to EquationEquation (2)(2) derived from Gunn and Woessner’s formula, the same proportional relation exists for particles in the size range of 20–1000 nm and up to the highest tested charge of 5 (Figure 1b). The proportionality constant approximates 2q (further illustrated in Section 1 in the SI) and all correlation coefficients are greater than 0.99. For particles smaller than 20 nm, the proportional relation still exists between singly charged fractions calculated using Fuchs’ theory and the ion mobility ratios. However, the proportional constant decreases as the particle size decreases (Figure S3). Nevertheless, neutralizer ion properties retrieved from charge fractions of particles larger than 20 nm should be independent of the particle size.
2.2. Relation between the raw PNSDs and the ion mobility ratio
Based on EquationEquation (2)(2) , the ion mobility ratio can be calculated if the ratio of positive to negative charge fractions is known. An electrical mobility size spectrometer can be operated to measure both positively and negatively charged particles by simply switching the high voltage polarity applied to the DMA while keeping other conditions the same. The raw PNSDs of positively and negatively charged particles reflect the difference between the fractions of positively and negatively charged particles. Therefore, the mobility ratio of positive and negative ions can be estimated from the raw PNSDs using EquationEquation (2)
(2) .
For monodisperse aerosols, the ratio of positively to negatively singly charged particle raw concentration, R+/R−, measured at the corresponding DMA voltage of different polarity, is simply equal to the ratio of positive to negative charge fractions. For polydisperse aerosols, multiple charging complicates the analysis since larger particles with higher charge states having the same electrical mobility as singly charged particles contribute to measured concentrations at a given DMA voltage. One solution is to search for a proper size bin in the raw PNSDs for which multiple charging can be neglected. With a given DMA voltage of positive or negative polarity, one can select negatively or positively charged particles with the diameter range of dp±Δdp. If the classification resolution of the DMA is high enough, we can neglect the influence of Δdp. Then the ratio of positively to negatively charged particle concentration, R+/R−, should be equal to f(+1, dp)/f(−1, dp) if multiple charging can be neglected.
Figure 1. (a) The ratio of positive to negative charge fractions with the same number of elementary charges, fF(+q, dp)/fF(-q, dp), as a function of the mobility ratio of positive and negative ions, , for particles with the diameter of 30 nm and 100 nm, respectively. Positive ion mobility,
, and negative ion mobility,
, with values ranging from 1.00 to 2.00
10-4 m2/V·s and an interval of 0.05
10-4 m2/V·s were tested, i.e., 441 combinations of
and
. Experimental data from Hussin et al. (Citation1983), Adachi et al. (Citation1985), and Wiedensohler et al. (Citation1986) are also plotted. (b) The fitted proportionality constant, k, for ln[fF(+q, dp)/(-q, dp)] and ln(Z+ion/Z-ion) as a function of particle diameter and the elementary charges carried by the particles. When dp is greater than 20 nm, k is approximately equal to 2q and is nearly independent of the particle size. For small particles, the fractions with 2 or more charges are negligible such that their data are not included. The fitted ion mass-mobility relations by Mäkelä et al. (Citation1996) and Steiner et al. (Citation2014) were both used for the estimation.
![Figure 1. (a) The ratio of positive to negative charge fractions with the same number of elementary charges, fF(+q, dp)/fF(-q, dp), as a function of the mobility ratio of positive and negative ions, , for particles with the diameter of 30 nm and 100 nm, respectively. Positive ion mobility, , and negative ion mobility, , with values ranging from 1.00 to 2.0010-4 m2/V·s and an interval of 0.0510-4 m2/V·s were tested, i.e., 441 combinations of and . Experimental data from Hussin et al. (Citation1983), Adachi et al. (Citation1985), and Wiedensohler et al. (Citation1986) are also plotted. (b) The fitted proportionality constant, k, for ln[fF(+q, dp)/(-q, dp)] and ln(Z+ion/Z-ion) as a function of particle diameter and the elementary charges carried by the particles. When dp is greater than 20 nm, k is approximately equal to 2q and is nearly independent of the particle size. For small particles, the fractions with 2 or more charges are negligible such that their data are not included. The fitted ion mass-mobility relations by Mäkelä et al. (Citation1996) and Steiner et al. (Citation2014) were both used for the estimation.](/cms/asset/b4c56de4-ccb8-423e-a0ec-fc3da432552e/uast_a_1498587_f0001_c.jpg)
Figure 2. (a) Example of the raw PNSDs; (b) the procedure of estimating the ion mobility ratio from the raw PNSDs. The diameter and raw particle concentrations of ith (g(i)th) size bin are dp,i (dp,g(i)) and (
), respectively. The counting variable i starts from the peak size bin. Function g(i) maps dp,i to dp,g(i), particles in which diameter are doubly charged and have the same electrical mobility as particles in the diameter of dp,i. Continue searching for the size bin until it meets the requirements that
and that dp,g(i) is within the limit of measurement. Then
can be estimated from
.
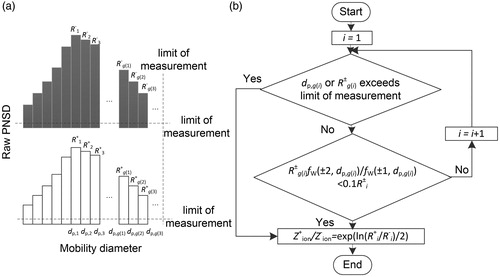
Figure 3. The estimated ion mobility ratio, ()P, using the proposed method is compared to the input ion mobility ratio,
, that is presented as dots in the figure. The dash-lines are to guide the comparison. Geometric mean diameters (dpg) of the lognormally distributed testing aerosols are 20, 30, 50, 70, 100, 130, 200, and 300 nm, respectively. Geometric standard deviations (σg) are 1.1, 1.2, 1.3, 1.5, 1.8, 2.1, and 2.5, respectively. In total, 56 combinations of dpg and σg were tested.
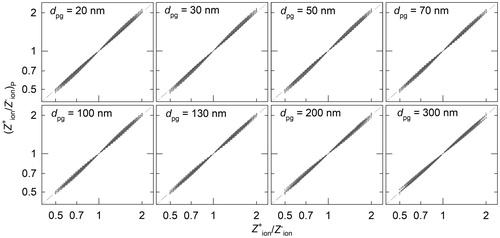
Figure 4. (a) Box plots of relative differences between charge fractions calculated using Gunn & Woessner’s formula, fG(q, dp), and using Fuchs’ theory, f F(q, dp), i.e., [fG(q, dp) - f F(q, dp)]/f F(q, dp). (b) Correction coefficient, α, as a function of dp. The included formulae were obtained by fitting the 441 median α values. For all the plots: the boundaries of the box indicate the 25th and 75th percentiles, respectively; the line within the box marks the median; whiskers (error bars) above and below the box indicate the 90th and 10th percentiles, respectively; circles are 5th and 95th outlying points.
![Figure 4. (a) Box plots of relative differences between charge fractions calculated using Gunn & Woessner’s formula, fG(q, dp), and using Fuchs’ theory, f F(q, dp), i.e., [fG(q, dp) - f F(q, dp)]/f F(q, dp). (b) Correction coefficient, α, as a function of dp. The included formulae were obtained by fitting the 441 median α values. For all the plots: the boundaries of the box indicate the 25th and 75th percentiles, respectively; the line within the box marks the median; whiskers (error bars) above and below the box indicate the 90th and 10th percentiles, respectively; circles are 5th and 95th outlying points.](/cms/asset/fda71b96-da64-4205-9429-170f5012e12d/uast_a_1498587_f0004_b.jpg)
Figure 5. Weighted deviation between the input PNSD and the inverted PNSDs using the proposed method () and using Wiedensohler's approximation (
) for aerosol charge fractions. The superscript indicates that the inverted PNSD is from positively or negatively charged particles. dpg and σg of the testing aerosol are 100 nm and 1.5, respectively.
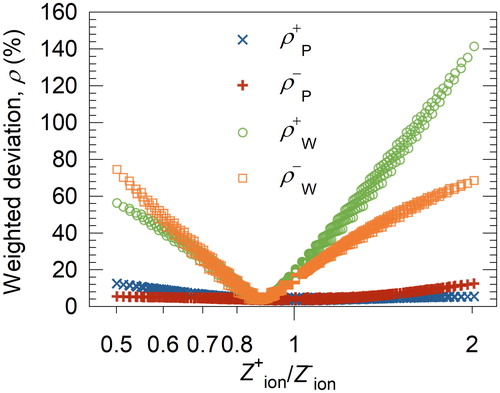
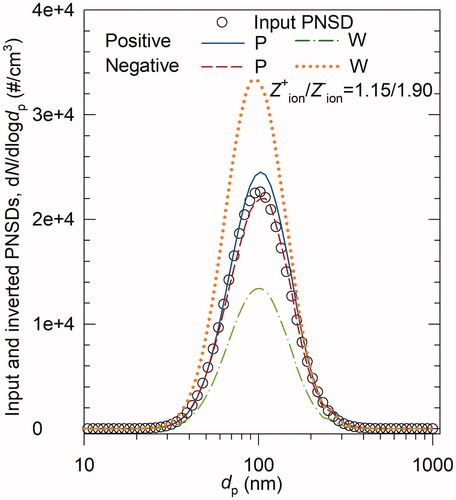
Figure 6. Comparison of the inverted PNSDs using the proposed method (P) and using Wiedensohler’s approximation (W) for aerosol charge fractions. is 1.15/1.90. The geometric mean diameter and geometric standard deviation of the testing aerosols are 100 nm and 1.5, respectively. The solid (blue line and dashed (red) line are the inverted PNSDs from the raw PNSDs of positively and negatively charged particles, respectively, using the proposed method. The dash-dot (green) line and dots (orange) are those using Wiedensohler’s approximation.
illustrates the strategy to find a proper size bin (for which multiple charging can be neglected) from the raw PNSDs. Each bin has a raw concentration of charged particles selected by the DMA, applied with a certain voltage. The search for a proper size bin starts from the peak size bin and moves towards the right, i.e., the size bins with larger mobility diameters. Because of the high concentration of the peak size bin, the contribution of multiple charged particles tends to be minor. In addition, higher particle concentrations help to reduce measurement uncertainties. If there is more than one peak, the peak size bin with a larger mobility diameter is selected. The raw concentration at the peak size bin is mostly contributed by singly charged particles with the diameter of dp,1, i.e.,
, followed by doubly charged particles with the diameter of dp,g(1), i.e.,
. Function g(1) maps dp,1 to the corresponding size bin dp,g(1), and doubly charged particles with the diameter of dp,g(1) have the same electrical mobility as singly charged particles with the diameter of dp,1. For simplicity, the approximation for neutralizer charge fractions (Wiedensohler Citation1988) together with the raw PNSDs are used to estimate the contribution of doubly charged particles, i.e.,
(3)
If the contribution of doubly charged particles to the raw concentration at the peak size bin is less than 10% (this is an empirical value and can be adjusted depending on the applications, as discussed with more details in Section 5 of the SI), i.e, , we can neglect the influence of doubly charged particles and use the ratio of raw concentrations,
, to represent the ratio of positive to negative charge fractions. In this circumstance, the contribution of particles with three or more charges would be much less than that of doubly charged particles and is neglected. If the contribution of doubly charged particles is greater than 10%, the larger size bin, dp,2, is then used to repeat the above procedure until the contribution of doubly charged particles is less than 10%, i.e.,
. This search also stops if the size bin dp,g(i) exceeds the limit of measurement or the raw particle concentration in this size bin is too low.
We tested this strategy by comparing the input ion mobility ratio to the estimated ion mobility ratio using lognormally distributed testing aerosols and various ion mobility combinations. For a given combination of neutralizer positive and negative ions, testing aerosols were sent into a virtual electrical mobility size spectrometer to generate the raw PNSDs. Using the above strategy, ion mobility ratio can be estimated from the raw PNSDs of positively and negatively charged particles and compared to the input ion mobility ratio. and
with values ranging from 1.00 to 2.00 × 10⁻⁴ m2/V·s and an interval of 0.05 × 10⁻⁴ m2/V·s were used, i.e., 441 combinations of
and
For a given ion mobility, the corresponding ion mass was estimated using the fitted mass–mobility equation by Steiner et al. (Citation2014). The raw PNSDs of positively and negatively charged particles were calculated as
(4)
where Ω(V, q, dp,j) is the DMA transfer function for particles with q charges and the diameter of dp,j when the DMA applied voltage is V; n(dp,j) is the particle size distribution function; Δ is the step length; the product of n(dp,j) and Δ represents the concentration of particles with the diameter of dp,j if Δ is small enough. Aerosol charge fractions were calculated using Fuchs’ theory (q ≤ 2) and Gunn and Woessner’s formula (q > 2), respectively. The non-diffusing DMA transfer function (Knutson and Whitby Citation1975) and a sheath-to-aerosol flowrate ratio of 10:1 were used. Particle penetration efficiency during the transport through the spectrometer and detection efficiency of the detector were assumed to be unity.
Geometric mean diameter (dpg) and geometric standard deviation (σg) of the testing aerosols are in the ranges of 20–300 nm and 1.1–2.5. In total, 56 combinations of dpg and σg were tested. illustrates that the estimated ion mobility ratio, ()P, agrees well with the input ion mobility ratio,
. Therefore, the variations in neutralizer ion properties were well captured by the proposed method.
3. Estimating aerosol charge fractions from the ion mobility ratio
After obtaining the ion mobility ratio from the raw PNSDs of positively and negatively charged particles measured by an electrical mobility size spectrometer, fractions of particles carrying three or more charges can be calculated using EquationEquation (1)(1) . However, the ion mobility ratio alone is not enough to calculate aerosol charge fractions for q
2 using Fuchs’ theory. A correction coefficient can be added to Gunn and Woessner’s formula to address this.
Relative differences between charge fractions calculated by Gunn and Woessner’s formula (fG(+q, dp), q = 1 or 2) and Fuchs’ theory (fF(+q, dp), q = 1 or 2) are shown in . 441 combinations of positive and negative ions with mobilities in the range of 1.00 to 2.00 10−4 m2/V·s were tested. For 70 nm
dp
1000 nm (q = 1, 2), the difference between charge fractions estimated using these two methods is mostly within 10%. For 20 nm
dp < 70 nm (q = 1, 2), however, their difference becomes larger and cannot be ignored, as was also reported previously (Hussin et al. Citation1983; Qi and Kulkarni Citation2013). A correction coefficient, α, was obtained by fitting fG(+q, αdp) to fF(+q, dp) using a least-square method. Results from 441 combinations of positive and negative ions were used for the fitting. The variations of α values and the fitted formulae as a function of particle diameter for q = 1 and 2 are illustrated in .
It follows that charge fractions for particles in the size range of 20–1000 nm can be calculated for a given ion mobility ratio using the following equation.
(5)
Note that significant difference exists between charge fractions calculated using Gunn and Woessner’s formula and Fuchs’ theory for particles smaller than 20 nm (Figure S4 in the SI).
4. Evaluation of the proposed method
The proposed method that retrieves neutralizer ion mobility ratios and aerosol charge fractions from the raw PNSDs of positively and negatively charged particles measured by an electrical mobility size spectrometer was evaluated using log normally distributed testing aerosols and various ion mobility combinations. The procedure reported in Section 2.2 was used to generate the raw PNSDs. 441 combinations of positive and negative ions with mobilities in the range of 1.00 to 2.00 10−4 m2/V·s were tested. Geometric mean diameter, dpg, and geometric standard deviation, σg, of the testing aerosols are 100 nm and 1.5, respectively. Following the strategy in Section 2.2, the ion mobility ratio can be estimated from the raw PNSDs. Then, aerosol charge fractions obtained by the neutralizer can be estimated using EquationEquation (5)
. Using these charge fractions, a linear data inversion scheme (Hagen and Alofs Citation1983) was used to recover the original PNSD from the raw PNSDs. In comparison, aerosol charge fractions predicted by the widely used approximation (Wiedensohler Citation1988) was also applied using the same inversion scheme. This approximation was obtained at a fixed mobility ratio of positive and negative ions, i.e., 1.4
10−4 m2/V·s/1.6
10−4 m2/V·s = 0.875. If the estimated charge fractions at various ion mobility combinations are accurate, the inverted PNSD should be the same or close to the input PNSD. A weighted deviation,
, is defined to evaluate the difference between the inverted PNSD and the input PNSD,
(6)
where nI,j and nT,j represent the size distribution function of the jth size bin of the inverted PNSD and the input PNSD, respectively; J is the total number of size bins.
shows the weighted deviations for the inverted PNSDs using both the proposed method and Wiedensohler’s approximation for aerosol charge fractions. When is close to 0.875, both the proposed method and Wiedensohler’s approximation perform well. When
is different from 0.875, however, the inverted PNSDs using Wiedensohler’s approximation deviate significantly from the input PNSD, while the proposed method continues to perform well. The deviation between the inverted PNSDs using the proposed method and the input PNSD increases when the ion mobility ratio approaches 0.5 or 2.0, which is caused by the error in estimated ion mobility ratio and charge fractions. As shown in Figure S2, however, typical ion mobility ratios for neutralizers with air as the carrier gas are in the range of 0.6–1.0. The proposed method can well capture the variations in ion mobility and aerosol charge fractions in these conditions and recover the input PNSD.
presents the input PNSD and the inverted PNSDs from the raw PNSDs of positively and negatively charged particles at the ion mobility ratio of 1.15 10−4 m2/V·s/1.90
10−4 m2/V·s used by Reischl et al. (Citation1996). When using Wiedensohler’s approximation for predicting aerosol charge fractions, significant discrepancy occurs between the input PNSD and the inverted PNSDs. In comparison, better agreement was observed when using the proposed method for aerosol charge fractions.
The proposed method was also evaluated using laboratory-generated aerosols (Lee et al. Citation2005a; Chen, McMurry, and Jiang Citation2018). As illustrated in Table S1, Figure S5 and associated discussions in the SI, ion mobility ratios for both radioactive and soft X-ray neutralizers under experimental conditions reported by Lee et al. (Citation2005a) were retrieved and the discrepancy between the inverted PNSDs from the raw PNSDs of positively and negatively charged particles was resolved. When using an atomization method to generate dioctyl sebacate aerosols, the concentration of residue isopropyl alcohol solvent in the carrier gas was adjusted to change ion properties in the neutralizer and subsequently aerosol charge fractions (Chen, McMurry, and Jiang Citation2018). Under various solvent concentrations, significantly different ion mobility ratios were retrieved and the deviation of the PNSD-integrated total number concentration from that measured by a reference condensation particle counter is reduced from ∼15%–17% to within 4% when using the proposed method for aerosol charge fractions instead of Wiedensohler’s approximation (Figures 3 and S3 in Chen, McMurry, and Jiang Citation2018).
In addition, there are concerns on whether the proposed method suffers from the empirically fitted mass–mobility equations and Fuchs’s theory without the three body trapping correction (Hoppel and Frick Citation1986) and proper representation of the Maxwell-Boltzmann speed distribution of ions (Filippov Citation1993; Gopalakrishnan et al. Citation2013; López-Yglesias and Flagan 2013). The former is because the mobility of an ion is not only a function of its mass, but also its structure and interaction potential with background neutral gas (Mesleh et al. Citation1996; Maisser et al. Citation2015). As illustrated in Figure S6 and associated discussions in the SI, the relation between the ion mobility ratio and the ratio of positive to negative charge fractions given by EquationEquation (2)(2) works for aerosol charge fractions estimated using improved models for quantifying ion–particle collision rates (Gopalakrishnan et al. Citation2013; López-Yglesias and Flagan Citation2013) and/or measured ion mobilities and masses using a tandem mobility–mass measurement system (Maisser et al. Citation2015) rather than derived from the fitted mass–mobility equations. The retrieved ion mobility ratios are consistent for particles with various sizes and charge states. The smallest particle diameter and the highest charge state tested are 10 nm and 5, respectively. The retrieved ratios are also consistent with the ion mobility ratios used in the charging models by López-Yglesias and Flagan (Citation2013) and Maisser
et al. (Citation2015), respectively, to calculate these aerosol charge fractions.
Note that the ion mobility ratio used in the proposed method is an empirical parameter gauged by the measurement of raw PNSDs in real-world applications of a neutralizer. For instance, it empirically averages the contribution of the broad distributions of positive and negative ions generated by the neutralizer. If the assumption of equal concentration of positive and negative ions is not valid (e.g., Hoppel and Frick [Citation1990] suggested that the unequal mobility of positive and negative ions can lead to a changing balance in ion concentrations downstream of the neutralizer), as shown in EquationEquations (1)(1) and (S6), the changing balance in ion concentrations would be empirically included in the ion mobility ratio by forcing positive and negative ion concentrations equal to each other. The proposed method empirically bypasses the need to address challenges encountered when applying the conventional method that would require quantifying the broad distributions of ions, flow patterns, spatial uniformity, and the interactions between ions and particles inside and downstream of the neutralizer (before mobility classification) in order to achieve an accurate estimation of aerosol charge fractions for size distribution measurement (Jiang et al. Citation2014).
5. Conclusion
This study reported an empirical method to retrieve the variations in ion properties and aerosol charge fractions for a neutralizer in real-world applications for measuring aerosol size distributions. It is based on both positively and negatively charged particles measured by the electrical mobility size spectrometer. Aerosol charging theories were applied to develop both the relation between aerosol charge fractions and the mobility ratio of positive and negative ions and the relation between the same ion mobility ratio and measured positively and negatively charged particles. After retrieving the ion mobility ratio from positively and negatively charged particles, a modified Gunn and Woessner’s formula was proposed to retrieve aerosol charge fractions (downstream of the neutralizer) to be used for size distribution data inversion. This modified formula can be readily used for calculating charge fractions of aerosols in the size range of 20–1000 nm. Though the retrieved ion mobility ratio for the neutralizer is independent of particle size, significant difference between charge fractions calculated using Gunn and Woessner’s formula and Fuchs’ theory limits the application of the modified formula for particles smaller than 20 nm. After testing it using both simulated aerosols and experiments, we found that this empirical method performs well in capturing the variations in neutralizer ion properties and aerosol charge fractions under various conditions and helps to achieve more accurate measurement of aerosol size distributions.
| Nomenclature | ||
| = | correction coefficient for Gunn & Woessner’s formula [dimensionless] | |
| dp | = | particle diameter [m] |
| dpg | = | geometric mean diameter of the testing aerosols [m] |
| e | = | elementary charge [C] |
| = | permittivity of vacuum [C2/N·m2] | |
| fG/F/W(±q, dp) | = | fraction of particles with a diameter of dp and elementary charges of +q or –q. G, F, and W indicates that aerosol charge fractions are calculated from Gunn & Woessner’s formula, Fuchs’ theory, Wiedensohler’s approximation, respectively [dimensionless] |
| k | = | fitted proportionality constant in the proportional relation of ln[f(+q,dp)/f(-q,dp)] = k ln(Z+ion/Z−ion) [dimensionless] |
| kB | = | Boltzmann’s constant [J/K] |
| nI,j/nT,j | = | size distribution function of the jth size bin of the inverted PNSD (particle number size distribution) and the input PNSD [#/m3] |
| = | positive or negative ion concentration [#/m3] | |
| q | = | number of elementary charges carried by a particle [#] |
| = | raw concentration of positively or negatively charged particles in the ith size bin [#/m3] | |
| = | raw concentration of positively or negatively charged particles in the ith size bin contributed by particles with multiple charges from the jth size bin [#/m3] | |
| = | weighted deviation of the inverted PNSD by the proposed method (P) or using Wiedensohler’s approximation (W) [dimensionless] | |
| αg | = | geometric standard deviation of the testing aerosols [dimensionless] |
| T | = | the temperature [K] |
| = | electrical mobility of positive or negative ions [m2/V·s] | |
Supplemental Material
Download Zip (283.8 KB)Acknowledgments
X. Chen would like to thank the support from Tsinghua Fudaoyuan Scholarship program. We thank Prof. Peter McMurry and the three anonymous reviewers for their comments that help to improve this article.
Additional information
Funding
Related Research Data
References
- Adachi, M., Y. Kousaka, and K. Okuyama. 1985. Unipolar and Bipolar Diffusion Charging of Ultrafine Aerosol Particles. J. Aerosol Sci. 16 (2):109–23.
- Adachi, M., K. Okuyama, Y. Kousaka, H. Kozuru, and D. Y. H. Pui. 1987. Diffusion Charging of Ultrafine Aerosol Particles by Positive Helium, Argon, and Nitrogen Ions. J. Appl. Phys. 62 (7):3050–52.
- Chen, X., P. H. McMurry, and J. Jiang. 2018. Stationary Characteristics in Bipolar Diffusion Charging of Aerosols: Improving the Performance of Electrical Mobility Size Spectrometers. Aerosol Sci. Technol. 52(8):809–813. doi:10.1080/02786826.2018.1479058
- Cooper, D. W., and P. C. Reist. 1973. Neutralizing Charged Aerosols with Radioactive Sources. J. Colloid Interface Sci. 45 (1):17–26.
- Filippov, A. V. 1993. Charging of Aerosol in the Transition Regime. J. Aerosol Sci. 24 (4):423–36.
- Fuchs, N. A. 1963. On the Stationary Charge Distribution on Aerosol Particles in a Bipolar Ionic Atmosphere. Geofis. Pura. Appl. 56 (1):185–93.
- Gopalakrishnan, R., M. J. Meredith, C. Larriba-Andaluz, and C. J. Hogan. Jr. 2013. Brownian Dynamics Determination of the Bipolar Steady State Charge Distribution on Spheres and Non-Spheres in the Transition Regime. J. Aerosol Sci. 63:126–45.
- Gunn, R., and R. H. Woessner. 1956. Measurements of the Systematic Electrification of Aerosols. J. Colloid Sci. 11 (3):254–9.
- Hagen, D. E., and D. J. Alofs. 1983. Linear Inversion Method to Obtain Aerosol Size Distributions from Measurements with a Differiential Mobility Analyzer. Aerosol Sci. Technol. 2 (4):465–75.
- Hoppel, W. A., and G. M. Frick. 1986. Ion-Aerosol Attachment Coefficients and the Steady-State Charge Distribution on Aerosols in a Bipolar Ion Environment. Aerosol Sci. Technol. 5 (1):1–21.
- Hoppel, W. A., and G. M. Frick. 1990. The Nonequilibrium Character of the Aerosol Charge Distribution Produced by Neutralizer. Aerosol Sci. Technol. 12 (3):471–96.
- Hussin, A., H. G. Scheibel, K. H. Becker, and J. Porstendorfer. 1983. Bipolar Diffusion Charging of Aerosol Particles. 1. Experimental Results within the Diameter Range 4-30 nm. J. Aerosol Sci. 14 (5):671–7.
- Jiang, J., C. Kim, X. Wang, M. R. Stolzenburg, S. L. Kaufman, C. Qi, G. J. Sem, H. Sakurai, N. Hama, and P. H. McMurry. 2014. Aerosol Charge Fractions Downstream of Six Bipolar Chargers: Effects of Ion Source, Source Activity, and Flowrate. Aerosol Sci. Technol. 48 (12):1207–16.
- Kallinger, P., and W. W. Szymanski. 2015. Experimental Determination of the Steady-State Charging Probabilities and Particle Size Conservation in Non-Radioactive and Radioactive Bipolar Aerosol Chargers in the Size Range of 5-40 nm. J. Nanopart. Res. 17 (4):1–10.
- Kilpatrick, W. D. 1971. An Experimental Mass-Mobility Relation for Ions in Air at Atmospheric Pressure. Proc. Annu. Conf. Mass Spectrosc. 19:320–5
- Knutson, E. O., and K. T. Whitby. 1975. Aerosol Classification by Electric Mobility: Apparatus, Theory, and Applications. J. Aerosol Sci. 6 (6):443–451.
- Lee, H. M., C. S. Kim, M. Shimada, and K. Okuyama. 2005a. Bipolar Diffusion Charging for Aerosol Nanoparticle Measurement Using a Soft X-ray Charger. J. Aerosol Sci. 36 (7):813–29.
- Lee, H. M., C. S. Kim, M. Shimada, and K. Okuyama. 2005b. Effects of Mobility Changes and Distribution of Bipolar Ions on Aerosol Nanoparticle Diffusion Charging. J. Chem. Eng. Japan / JCEJ. 38 (7):486–96.
- Liu, B. Y. H., and D. Y. H. Pui. 1974. Electrical Neutralization of Aerosols. J. Aerosol Sci. 5 (5):465–72.
- López-Yglesias, X., and R. C. Flagan. 2013. Ion-Aerosol Flux Coefficients and the Steady-State Charge Distribution of Aerosols in a Bipolar Ion Environment. Aerosol Sci. Technol. 47 (6):688–704.
- Luts, A., T.-E. Parts, U. Horrak, H. Junninen, and M. Kulmala. 2011. Composition of Negative Air Ions as a Function of Ion Age and Selected Trace Gases: Mass and Mobility Distribution. J. Aerosol Sci. 42 (11):820–38.
- Maisser, A., J. M. Thomas, C. Larriba-Andaluz, S. He, and C. J. Hogan. Jr. 2015. The Mass-Mobility Distributions of Ions Produced by a Po-210 Source in Air. J. Aerosol Sci. 90:36–50.
- Mäkelä, J. M., V. Jokinen, T. Mattila, A. Ukkonen, and J. Keskinen. 1996. Mobility Distribution of Acetone Cluster Ions. J. Aerosol Sci. 27 (2):175–90.
- Mesleh, M. F., J. M. Hunter, A. A. Shvartsburg, G. C. Schatz, and M. F. Jarrold. 1996. Structural Information from Ion Mobility Measurements: Effects of the Long-Range Potential. J. Phys. Chem. 100 (40):16082–86.
- Qi, C., and P. Kulkarni. 2013. Miniature Dual-Corona Ionizer for Bipolar Charging of Aerosol. Aerosol Sci. Technol. 47 (1):81–92.
- Reischl, G. P., J. M. Mäkelä, R. Karch, and J. Necid. 1996. Bipolar Charging of Ultrafine Particles in the Size Range below 10 nm. J. Aerosol Sci. 27 (6):931–49.
- Shimada, M., B. W. Han, K. Okuyama, and Y. Otani. 2002. Bipolar Charging of Aerosol Nanoparticles by a Soft X-ray Photoionizer. J. Chem. Eng. Japan / JCEJ. 35.(8):786–93.
- Steiner, G., T. Jokinen, H. Junninen, M. Sipila, T. Petaja, D. Worsnop, G. P. Reischl, and M. Kulmala. 2014. High-Resolution Mobility and Mass Spectrometry of Negative Ions Produced in a 241Am Aerosol Charger. Aerosol Sci. Technol. 48.(3):261–70.
- Steiner, G., and G. P. Reischl. 2012. The Effect of Carrier Gas Contaminants on the Charging Probability of Aerosols under Bipolar Charging Conditions. J Aerosol Sci. 54 (7):21–31.
- Tigges, L., A. Wiedensohler, K. Weinhold, J. Gandhi, and H. J. Schmid. 2015a. Bipolar Charge Distribution of a Soft X-ray Diffusion Charger. J. Aerosol Sci. 90:77–86.
- Tigges, L., A. Jain, and H. J. Schmid. 2015b. On the Bipolar Charge Distribution Used for Mobility Particle Sizing: Theoretical Considerations. J. Aerosol Sci. 88:119–34.
- Whitby, K. T., and C. M. Peterson. 1965. Electrical Neutralization and Particle Size Measurement of Dye Aerosols. Ind. Eng. Chem. Fundam. 4 (1):66–72.
- Wiedensohler, A. 1988. An Approximation of the Bipolar Charge Distribution for Particles in the Sub-Micron Size Range. J. Aerosol Sci. 19 (3):387–9.
- Wiedensohler, A., W. Birmili, A. Nowak, A. Sonntag, K. Weinhold, M. Merkel, B. Wehner, T. Tuch, S. Pfeifer, M. Fiebig, A. M. Fjäraa, E. Asmi, K. Sellegri, R. Depuy, H. Venzac, P. Villani, P. Laj, P. Aalto, J. A. Ogren, E. Swietlicki, P. Williams, P. Roldin, P. Quincey, C. Hüglin, R. Fierz-Schmidhauser, M. Gysel, E. Weingartner, F. Riccobono, S. Santos, C. Grüning, K. Faloon, D. Beddows, R. Harrison, C. Monahan, S. G. Jennings, C. D. O'Dowd, A. Marinoni, H.-G. Horn, L. Keck, J. Jiang, J. Scheckman, P. H. McMurry, Z. Deng, C. S. Zhao, M. Moerman, B. Henzing, G. de Leeuw, G. Löschau, and S. Bastian. 2012. Mobility Particle Size Spectrometers: Harmonization of Technical Standards and Data Structure to Facilitate High Quality Long-Term Observations of Atmospheric Particle Number Size Distributions. Atmospheric Meas. Tech. 5 (3):657–85.
- Wiedensohler, A., E. Lutkemeier, M. Feldpausch, and C. Helsper. 1986. Investigation of the Bipolar Charge Distribution at Various Gas Conditions. J. Aerosol Sci. 17 (3):413–6.
- Wiedensohler, A., A. Wiesner, K. Weinhold, W. Birmili, M. Hermann, M. Merkel, T. Müller, S. Pfeifer, A. Schmidt, T. Tuch, F. Velarde, P. Quincey, S. Seeger, and A. Nowak. 2018. Mobility Particle Size Spectrometers: Calibration Procedures and Measurement Uncertainties. Aerosol Sci. Technol. 52 (2):146–64.