
Abstract
During the SEAC4RS campaign in 2013, inflight measurements of light-absorption by aerosol in biomass burning and agriculture fire plumes were collected along with concomitant measurements of aerosol extinction, scattering, and black carbon mass concentration. Here, we compare three measurements of aerosol absorption coefficients: from a photoacoustic spectrometer (PAS), a particle soot absorption photometer (PSAP), and a continuous light absorption photometer (CLAP). Each of these absorption measurements was collected in three visible spectral regions: red, green, and blue (although the precise wavelength and bandwidth vary with each instrument). The absorption measurements were compared during the plumes, in the boundary layer, and in the free troposphere. The slopes from the comparison ranged from 0.6 to 1.24. For biomass burning plumes, the uncertainty in the absorption measurements translates into a range in single scattering albedos of 0.93–0.94 at a wavelength of 660 nm, 0.94–0.95 at 532 nm and 0.92–0.95 at 405 nm. Overall, the aerosol absorption instruments agreed within their stated accuracies. Comparisons with simultaneous measurements of refractive black carbon mass concentration (collected by a single particle soot photometer), were used to derive the mass absorption coefficients (MAC). For all wavelengths, the MAC was high by greater than a factor of three compared to the expected MAC for black carbon.
© 2018 American Association for Aerosol Research
EDITOR:
1. Introduction
Optical absorption by atmospheric aerosols including refractory black carbon (rBC), brown carbon (BrC) and dust is poorly constrained. A broad assessment of the radiative forcing by rBC specifically is given by Bond et al. (Citation2013) where they approximate the total radiative forcing as +1.1 W m−2 (0.7 W m−2 is due to the direct effect) but with 90% uncertainty bounds of (+0.17,+2.1) W m−2. Estimates of radiative forcing due to BrC and dust are similarly uncertain (Chung, Ramanathan, and Decremer Citation2012; Lack and Langridge Citation2013; Stocker et al. Citation2013). Such a high uncertainty in the radiative forcing motivates efforts to improve understanding of the radiative properties of light absorbing aerosol particles.
The measurement of aerosol absorption is particularly reliant on in situ instrumentation. Many satellite and lidar measurements cannot directly determine aerosol absorption and scattering coefficients (babs and bscat, respectively). Absorbing aerosol optical depth (AAOD) is routinely retrieved from the alcumantar scans of Aerosol Robotic Network (AERONET) of sun photometers. This method only allows retrieval of AAOD when the aerosol loading is high (scattering aerosol optical depth greater than 0.4 at 440 nm) and requires validation by in situ measurements (Sheridan et al. Citation2012). While there have been several successful closure experiments for the atmospheric column, the same is not true for in situ absorption measurements (Andrews et al. Citation2017; Mallet et al. Citation2016; Strawa et al. Citation2006).
In situ aerosol absorption instrumentation usually relies on one of three techniques. One method measures the change in light transmitted and/or reflected by a filter on which aerosol is continuously deposited (Bond, Anderson, and Campbell Citation1999). These instruments are relatively inexpensive, simple to operate, span a wide spectral range, and are included in many ground based monitoring networks: the United States (U. S.) Department of Energy’s Aerosol Radiation Measurement (ARM), the U. S. National Oceanic and Atmospheric Administration's (NOAA’s) surface aerosol network and Global Atmosphere Watch (GAW) (Hansen, Rosen, and Novakov Citation1982; Petzold, Kramer, and Schonlinner Citation2002; Virkkula et al. Citation2005). These filter-based absorption measurements are susceptible to biases due to light scattering from the filter on which the particles are deposited, due to interactions of absorbing and nonabsorbing aerosol on the filter (Bond, Anderson, and Campbell Citation1999; Virkkula et al. Citation2005) and due to changes in morphology and evaporation of volatile components upon deposition on the filter (Cappa et al. Citation2008; Lack et al. Citation2008). A second method, photoacoustic spectroscopy (PAS), measures the pressure wave created by periodically illuminating the absorbing particles still suspended in the sample air (Haisch Citation2012; Miklos, Hess, and Bozoki Citation2001; Moosmuller, Chakrabarty, and Arnott Citation2009). Due to the absorption of light, the particles are heated and transfer heat to surrounding air. When the light source is modulated at an acoustic frequency, the heating of the air produces an acoustic wave that is detected with microphones. The detection region is often surrounded by a resonant acoustic cavity that increases the magnitude of the acoustic wave by storing the acoustic energy over many acoustic cycles (Arnott et al. Citation2006; Havey et al. Citation2010; Lack et al. Citation2006). The magnitude of the acoustic wave is proportional to the aerosol absorption coefficient, intensity of the optical illumination, and the quality factor of the acoustic cavity. The photoacoustic method can be biased low due to the evaporation of volatile components, in practice this effect is most significant for aerosol water (Langridge et al. Citation2013) and can be avoided by maintaining the sample at low relative humidity. A third method for determining the aerosol absorption is taking the difference between aerosol extinction and the aerosol scattering. Aerosol extinction can be measured by cavity enhanced spectroscopic techniques, such as cavity ringdown spectroscopy (CRDS) and cavity attenuated phase-shift spectroscopy, while the scattering coefficient is measured using nephelometers (Onasch et al. Citation2015; Sanford et al. Citation2008; Strawa et al. Citation2003; Thompson et al. Citation2008). Because aerosol absorption in the ambient accumulation mode is a small fraction of extinction, this method is sensitive to bias in either the extinction or scattering measurements.
Past intercomparisons of aerosol absorption measurements, for ground-based field and laboratory studies, have shown mixed levels of agreement. These intercomparisons include all combinations of the three in situ methods described above. In 14 laboratory intercomparisons presented in four studies, the median agreement is found to be 1.02 with a range of 0.84–1.33 (Bond, Anderson, and Campbell Citation1999; Müeller et al. 2011; Petzold et al. Citation2005; Sheridan et al. Citation2005). Out of these 14 intercomparisons, 11 show agreement to within 10% (0.9 ≥ slope ≥1.1). However, in 21 field intercomparisons, presented in five studies, much poorer levels of agreement are shown, with the median agreement being 1.28 and a range of agreements from 0.14 to 2.55 (Arnott et al. Citation2005; Chow et al. Citation2009; Hitzenberger et al. Citation2006; Petzold and Schonlinner Citation2004; Wu et al. Citation2015). Out of these 21 field intercomparisons, only four show an agreement of 10% or better. Laboratory generated aerosol are often less complex (uncoated, single mode, and mono-component) than ambient aerosol. We note that there are no obvious biases in the literature comparisons towards one particular instrument measuring higher or lower absorption than another.
Calculation of the radiative impact of aerosol absorption requires the vertical distribution of aerosol absorption (McComiskey et al. Citation2008). Aircraft based, in situ measurements are an effective method for obtaining these distributions (Arnott et al. Citation2006; Koch et al. Citation2009; Liu et al. Citation2015; Presser et al. Citation2017; Taubman et al. Citation2004). Aircraft provide a challenging environment for instrumentation due to temperature extremes, pressure changes, and local acoustic noise. Only two comparisons of in situ absorption measurements made aboard aircraft are known to these authors. Arnott et al. (Citation2006) compared PAS and filter-based particle soot absorption photometer (PSAP) instruments measuring smoke transported from forest fires to north central Oklahoma on three separate days. Two of these comparisons were performed without correcting the PSAP data for known scattering biases described by Bond, Anderson, and Campbell (Citation1999) and Virkkula et al. (Citation2005), and found that the PSAP measurements were 16% and 14% higher than the PAS. In the third flight described by Arnott et al. (Citation2006), a scattering correction was applied due to an expected high single scattering albedo of the measured smoke (i.e., very large scattering contribution) and an agreement of 0.99 was obtained. The second intercomparison of airborne absorption instruments, by Lack et al. (Citation2012b), also looked at the PSAP vs PAS relationship and found agreements of 1.06, 1.03, and 1.02 for wavelengths of 404, 532, and 659 nm, respectively.
In August and September of 2013, the Studies of Emissions and Atmospheric Composition Clouds and Climate Coupling by Regional Surveys (SEAC4RS) campaign collected in situ and remote-sensing measurements during 19 research flights aboard the NASA DC8 aircraft as well as concomitant surface measurements (Toon et al. Citation2016). Here, we will compare the various in situ absorption measurements collected aboard the DC8 aircraft. The absorption measurements include two filter-based instruments (PSAP and continuous light absorption photometer (CLAP)) and a photoacoustic spectrometer (PAS). Absorption is also determined from the difference between extinction coefficient, measured using a cavity ringdown spectrometer (CRDS), and scattering coefficient measured using a nephelometer, and compared with the other absorption measurements. The instrument uncertainty is propagated to calculated properties such as single scattering albedo (SSA). The absorption values are also combined with single particle soot photometer (SP2) data to estimate mass absorption coefficients (Schwarz et al. Citation2006; Schwarz et al. Citation2010).
2. Instrumentation and methods
The SEAC4RS study sampled a wide geographic area over the continental U.S. with several areas of focus: western North American wildfires, southeastern U.S. atmospheric chemistry, the North American Monsoon, and hurricanes in the Gulf of Mexico (Toon et al. Citation2016). A broad array of instruments, including those probing trace gas composition, aerosol composition, and aerosol optical properties were installed aboard the NASA DC8 research aircraft. These flights were carried out from August to September of 2013 over the western, central, and southeastern U.S. (archived data available through the NASA SEAC4RS web page: https://www-air.larc.nasa.gov/missions/seac4rs/ or https://doi.org/10.5067/Aircraft/SEAC4RS/Aerosol-TraceGas-Cloud). During the 26th and 27th of August, the DC8 aircraft sampled the plume from the Rim Fire, a wildland fire that started in Stanislaus National Forest and was the third largest in California’s history (Forrister et al. Citation2015; Peterson et al. Citation2015). shows the flight tracks of the DC8 aircraft during SEAC4RS used in this analysis, colored by the carbon monoxide (CO) concentration during each burning event.
Figure 1. Map showing flight tracks (grey) during the SEAC4RS campaign. The plumes where aerosol absorption is greater than 20 Mm−1 are highlighted where the color-scale indicates the level of CO in the plume. The Rim Fire (black dashed) and agricultural (Ag, white dashed) fires are highlighted separately.
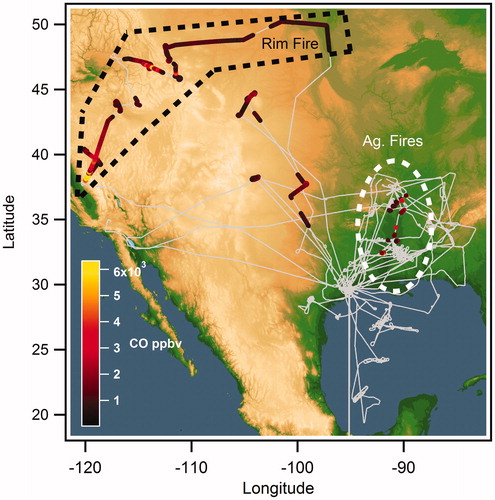
Several studies have reported and analyzed the measurements of the Rim Fire plume and other wildfire and agricultural fire plumes observed during the SEAC4RS campaign: the lifetime of absorbing brown carbon in the Rim Fire has been studied by Forrister et al. (Citation2015), who observe a much longer lifetime than that predicted by laboratory measurements (Lee et al. Citation2014; Zhong and Jang Citation2014). The day to day and nocturnal variations in the smoke emissions of the Rim Fire have also been studied by Saide et al. (Citation2015), by coupling the flight data with ground based and satellite observations. An analysis of the emissions factors of trace gases and aerosols of the agricultural fires during SEAC4RS was performed by Liu et al. (Citation2016).
Measurements of black carbon aerosol mass concentration, aerosol absorption, extinction, and scattering coefficients were made through a shrouded diffuser inlet described by McNaughton et al. (Citation2007) which efficiently transmits particles with aerodynamic diameters less than 4 µm. The PAS, CLAP, and CRDS instruments sampled air downstream of pair of Nafion driers (Permapure PD-200T-12-MSS, Toms River, NJ, USA),1 an impactor with a 1 µm aerodynamic diameter size cut, a monolithic activated carbon scrubber (to remove NO2 and O3, MAST Carbon NovaCarb F, Basingstoke, United Kingdom)1, and a pair of automated valves used to periodically route the sample flow through filter. The PSAP was operated at 40 °C to reduce sample humidity conditions and had no impactor upstream of the instrument. The nephelometer sampled air that had been dried (Permapure FC125-240-10P, Toms River, NJ, USA)1 before passing through a cyclonewith a 1 µm size cut. (Ziemba et al. Citation2013).
Due to small differences in the time taken to transport aerosol from the common inlet to each instrument, prior to analysis the data from each instrument were manually shifted by a few seconds such that the plume features aligned with the gas phase CO measurement. In addition, each optical instrument measured aerosol optical properties at three wavelengths spanning the visible spectrum, corresponding to red, green, and blue wavelengths (the specific wavelength for each instrument differed slightly). Adjustments due to these small wavelength differences are discussed in the online supplementary information (SI), Section S5. One 405 nm channel in the CRDS instrument sampled continuously behind an aerosol filter and confirmed that the gas phase absorbers were effectively scrubbed from the sample air.
As measurement uncertainty is important in comparing measurements, in this analysis we use the term uncertainty to refer to the combination of the accuracy and precision. Accuracy is expressed as a percentage of the measurement and refers to the expected agreement with an ideal measurement or absolute standard at a high signal-to-noise ratio. The precision refers to the detection limit at low signal-to-noise ratio. The precision depends on the time interval over which the measurement is averaged, and on operational conditions.
2.1. Photoacoustic spectrometer
The PAS instrument used during SEAC4RS was developed at the NOAA ESRL laboratory and is described in detail by Lack et al. (Citation2012b). Briefly, the PAS instrument used during SEAC4RS consisted of five photoacoustic cells sampling in parallel, three of which were operating under dry conditions (<30% RH) at red, green, and blue wavelengths (405, 532, and 660 nm). The remaining two cells, using red and blue wavelengths, sampled downstream of a thermodenuder (TD) maintained at a temperature of 250 °C which acted to remove most of the volatile compounds from the sampled aerosol particles. However, the thermodenuder is not expected remove all non-rBC aerosol mass because the flow rate (5 lpm) through the TD is relatively high compared with its heated length (50 cm) so the sample air will not come to equilibrium with the walls (Fierz, Vernooij, and Burtscher Citation2007). Additionally, aged brown carbon has an extremely low volatility component that may not be possible to remove in a thermodenuder (Saleh et al. Citation2014).
The instrumental background, resonant frequency, and quality factor of each acoustic sample cell are dependent on the internal pressure and temperature. Every 5 min, automated valves placed a filter in line with the inlet for a period of 22 s, allowing the background microphone signal (due to absorption of scattered light by the cell walls) to be measured. Non-concurrently with the filter period every 5 min, a speaker was used to generate a broadband acoustic excitation in each cell. The subsequent acoustic ringing of each cell was used to determine the acoustic quality factor (Q) and resonant frequency (Fr). The modulation frequencies of the lasers were then adjusted to match the measured resonant frequencies. An absorption coefficient (babs,PAS) could thus by calculated for each cell using EquationEquation (1)(1) .
(1)
In EquationEquation (1)(1) , Plaser is the relative optical intensity measured by a photodiode illuminated by light leaking through the back mirror of the multipass acoustic cell and Pmic is the integrated area under the resonant peak at the modulation frequency in a Fourier transform of the microphone signal. The slope, mcal, is a cell specific calibration slope determined as defined in the SI, Section S1. The total measurement accuracy under flight conditions given by Lack et al. (Citation2012b) is ±10% plus the detection limit; however, due to the correction for the calibration bias we use an accuracy of ±15% plus the detection limit for the red and the green channels and ±30% plus the detection limit for the blue channels for the SEAC4RS data. Lack et al. (Citation2012b) reported the 1 s detection limit under flight conditions as 2.0, 1.2, 1.1, 1.5, and 1.5 Mm−1 for the red dry, green dry, blue dry, red thermodenuded, and blue thermodenuded, respectively. Under SEAC4RS operational conditions, the 1 s 1σ detection limit was in the range of 0.6–3.5 Mm−1 varying with channel and flight (see the SI, Section S3). For data averaged over a 10 s and 1 min intervals the 1 s, 1σ detection limit was less than 1.5 Mm−1. Bluvshtein et al. (2016) recently described a factor of two bias in a similar PAS operating at 405 nm, however, the source and wider applicability of the described bias is unclear. In a similar experiment, Davies et al. (Citation2018) found no bias.
2.2. Particle soot absorption photometer
A particle soot absorption photometer (PSAP, Radiance Research, Seattle, WA, USA)1 measured real-time dry absorption, babs.PSAP at three wavelengths. The instrument uses an integrating plate technique where the sample flow containing particles is passed through a filter and the particles collect on the filter. The change in optical transmission (i.e., the original light intensity (l0) divided by intensity of light transmitted through the filter (l)) as a function of time is related to the absorption coefficient through the Beer–Lambert law. For a deposition spot area A and volume of air sampled V, the absorption coefficient of the sample may thus be calculated using EquationEquation (2)(2) .
(2)
In EquationEquation (2)(2) , f(Tr) is the transfer function based on filter loadings and corrects the absorption for instrumental artifacts (e.g., scattering aerosol deposited on the filter contributing to the reported absorption). Although data from the PSAP were collected at 1 Hz frequency, the internal electronics of the PSAP applied a smoothing with an approximate 6 s time constant. The raw uncorrected PSAP and sub-micron nephelometer data (described below) were used to apply the Bond, Anderson, and Campbell (Citation1999) and Ogren (2010) corrections. The PSAP instrumental noise was assessed by laboratory measurements of filtered air over several hours (using an instrument equivalent but not identical to the flight instrument). Utilizing the methods described in Sherman et al. (Citation2015), the accuracy of the PSAP instrument was found to be ±25%. Using the sub-micron scattering to correct the PSAP data may lead to a slight over-estimation of absorption when super-micron absorbing aerosol is present. Under SEAC4RS operational conditions, the PSAP 1σ detection limit for all three wavelengths is less than 0.5 Mm−1 for a 10 s averaging time, and less than 0.2 Mm−1 for a 1 min average (SI, Section S3).
2.3. Continuous light absorption photometer
The CLAP is a filter-based instrument that is designed to be an improved replacement for the PSAP (Ogren et al. Citation2017). Like the PSAP, the CLAP measures simultaneously at blue, green, and red wavelengths. It differs from the PSAP in that it sequentially cycles through eight filter spots (areas of sample collection in a single filter) and two reference spots. This multi-spot approach allows it to operate for longer than the single spot PSAP. The wavelengths of the light sources used in the CLAP are also slightly different from those of the PSAP (see the SI, Section S5). Ogren et al. (Citation2017) have characterized the uncertainty of the CLAP-based on laboratory tests and measurements at eight ground sites. The total uncertainty depends on the averaging interval and the single scatter albedo of the aerosol. The uncertainty is smallest (20%) at long averaging times and low single scattering albedo, and the median uncertainty of measurements presented in Ogren et al. (Citation2017) was 30%. Under SEAC4RS operational conditions, the 1 s 1σ detection limit ranged from 1.5 to 11 Mm−1. The 1σ detection limit was less than 5 Mm−1 for a 10 s time interval and less than 2 Mm−1 for 1 min time interval for all of the channels. These detection limits are significantly larger than precision reported by Ogren et al. (Citation2017) and likely reflect the limits of the SEAC4RS dataset rather than the CLAP instrument. The CLAP is corrected using Bond, Anderson, and Campbell (Citation1999) along with the adjustments for spectral measurements described by Ogren (Citation2010). For the SEAC4RS dataset, measurements of extinction were used as a proxy for scattering in the scattering correction. Using extinction as a proxy may result in a slight over-correction for scattering artifacts (i.e., underestimation of absorption) as the Bond correction was developed to utilize nephelometer scattering data that had not been corrected for the truncation error; however, this effect is expected to be small (less than 2%).
2.4. Other instrumentation
An integrating nephelometer (model 3563, TSI, Shoreview, MI, USA)1 reported bscat at red, green and blue wavelengths. The nephelometer measures aerosol scattering by illuminating the sample air from all incident angles and measuring the total scattered light (using a photomultiplier tube) over a narrow range of scattered angles (relative to the sample cell geometry). The known Rayleigh scattering coefficients of pure gases are used to calibrate the scattering signal, and the scattering signal due to aerosol alone is obtained by subtracting the instrumental background due to gas phase Rayleigh scattering and the light scattered from the walls of the sample cell. The instrumental background is determined by periodically filtering the sampling stream. The nephelometer data were corrected for instrument nonidealities (e.g., truncation) using methods described by Anderson and Ogren (Citation1998). Using the methodology of Sherman et al. (Citation2015), the accuracy for 10 s and 1 min scattering data were found to be approximately 12% and 9%, respectively.
A CRDS was used to measure extinction during SEAC4RS as described in detail in Langridge et al. (Citation2011); however, a brief description is given here. The CRDS consists of eight separate optical cavities/channels. The dry aerosol extinction coefficient was measured by passing the aerosol sample in series through four separate optical cavities: one at 532 nm, one at 660 nm, and two at 405 nm. The remaining channels were used to measure humidified and denuded extinction coefficients. For airborne measurements, the lower limit of detection is 0.1 Mm−1, and the accuracy is ±5%.
A single particle soot photometer (SP2, Droplet Measurement Technologies, Longmont, CO, USA)Footnote1 was used to measure refractory black carbon (rBC, ng m−3, STP) mass concentration using laser induced incandescence (Schwarz et al. Citation2010). The SP2 measures the rBC-mass, in the range of 0.7 and 150 fg, for individual particles (equivalent to core sizes between 90 and 550 nm volume-equivalent diameter with an assumed void-free density for rBC of 1.8 g/cc). This range includes most of the rBC mass in the accumulation mode in BB plumes and background air (Schwarz et al. Citation2008). Log-normal fits to the observed rBC mass-weighted size distribution are used to extrapolate the fraction of accumulation mode rBC mass that was outside of the SP2 detection window; for the Rim Fire this missed mass is 5%. The reported SP2 mass concentration is therefore scaled upwards by a factor of 1.05 for calculations made using the SP2 data. Note that this correction does not account for rBC mass which may exist in either the Aitken or coarse modes, which the SP2 does not detect. Schwarz et al. (Citation2008) estimate accuracy for the rBC mass concentration measurement of ±30% for ambient sampling.
2.5. Calculated properties
In this analysis, a few calculated parameters are used to check if the instruments are internally consistent and within the range of expected values from the literature. In addition to checking instrument performance, these calculated values give some insight in to the nature of the absorbing aerosol sampled during SEAC4RS and their climatic effect. The calculated parameters include the absorption Ångström exponent, single scattering albedo (SSA), mass absorption coefficient (MAC) and absorption determined using extinction minus scattering (bext-scat). Because the wavelength used in each instrument differ an Ångström exponent is used to adjust the measurements to the same wavelength as described in the SI, Section S5.
A comparison of all the extinction data taken during SEAC4RS to scattering data before and after wavelength adjustments is given in the SI (). These plots demonstrate that the slopes after wavelength adjustment are significantly less than 1 in case of the red and blue wavelengths and near 1 in the case of the green. Therefore, for the SEAC4RS dataset extinction minus scattering (bext-sca) was, on average, negative in the case of the blue and red wavelengths and close to zero for the green. The unphysical results are not surprising as this method relies on a small difference between large numbers. The nephelometer and the CRDS used during SEAC4RS were operated by separate research groups, did not have matched wavelengths, and did not have common flow paths, conditioners or calibration standards. The unphysical absorption differences simply mean that independently operated extinction and scattering measurements are not consistent to within a few percent. No further analysis of the absorption obtained by the difference method (bext-sca) is presented.
The single scattering albedo is the ratio of the aerosol scattering coefficient to the extinction coefficient. For the purposes of this analysis, SSAs are calculated from four different combinations of instruments. For each of the three absorption measurements, SSA is calculated using EquationEquation (3)(3) along with the CRDS extinction measurement. The SSA can also be calculated with scattering measurements from the nephelometer; however, the results are not significantly different because the extinction and scattering measurement agree to better than 10% (see the SI, Section S2).
(3)
In this analysis, the bulk mass absorption coefficient is used to relate the aerosol absorption to the mass concentration of rBC and is hereafter referred to as the MAC. The MAC is calculated using EquationEquation (4)(4) , where the absorption comes from one of the three absorption measurements and the rBC mass concentration measured by the SP2 is increased by 5% to account for black carbon outside the detection range of the SP2.
(4)
We note that several closely related quantities could be termed the mass absorption coefficient. First, the mass absorption coefficient (MAC) in the analysis uses the bulk aerosol absorption and the bulk rBC mass concentration for a polydispersed aerosol. Second, the single particle mass absorption coefficient normalizes the absorption due to a single particle by the total mass of that particle. Third, a material property mass absorption coefficient normalizes the absorption of an optical thin film by the mass density of the film. This material property mass absorption coefficient is independent of particle size or morphology and is directly related to the complex index of refraction. In the case of an aerosol with particle diameters sufficiently small to be optically thin and with a pure composition, these three MACs would have the same value. Based on the measurements available during the SEAC4RS mission, only the first MAC can be quantified.
Bond and Bergstrom (Citation2006) have associated with the MAC of atmospheric and lab-generated pure black carbon to a central range (7.5 ± 1.2 m2g−1 at 550 nm) and suggest that this MAC corresponds approximately to a material property of black carbon. Although recent studies have reported MAC values outside of this range (Radney et al. Citation2014; Weyant et al. Citation2016), we use it as a reference value here. In SEAC4RS field study, the sampled aerosol is not pure black carbon (rather a mixture of black carbon, organic aerosol, and inorganic aerosol), but the MAC is calculated by normalization with respect to black carbon mass. The presence of brown carbon (BrC), other coatings, or dust, that enhances absorption but is not measured by the SP2, would bias the MAC high. In the presence of large BC particle (which are not optically thin), some the mass is shielded from the full optical field. This shielding affect would bias the MAC low. In Section 3.2.1, we compare the MAC measured during SEAC4RS to the MAC for BC suggested by Bond and Bergstrom (Citation2006) using EquationEquation (5)(5) , which implicitly assumes absorption Ångström exponent (AAE) of 1.
(5)
2.6. Data categorization
During the SEAC4RS campaign, a total flight time of 144 hs was available for these comparisons. The data used in this analysis were limited to time periods when the PAS reported data (80% of the available flight time). The absorption data were split into two broad categories: plumes and backgrounds. A total of 51 aerosol plumes were identified manually when aerosol absorption measured by the PAS rose above 20 Mm−1 at 532 nm. Typical sampling duration in individual plumes was 1–3 min, and the peak absorption was 50–100 Mm−1 (at 405 nm). During the Rim Fire measurements on 26 and 27 August; however, the plume from the fire was so large and dense that the sampling time was 10–40 min and absorption values >1000 Mm−1 were recorded. The background (non-plume) data constituted the majority of all the data and were further split into boundary layer (<2 km) and free-troposphere (>2 km) categories. The plume data were averaged to 10 s intervals while the background data, having a lower signal to noise, were averaged to 60 s. The intercomparison of the absorption instruments focuses on three aspects: linearity, slope, and detection limit (SI Sections S3 and S4). The absorption data from the plumes were used to assess the linearity and slope among the instruments while clean periods over the Gulf of Mexico were used to assess the detection limits.
3. Results and discussion
3.1. Absorption time series
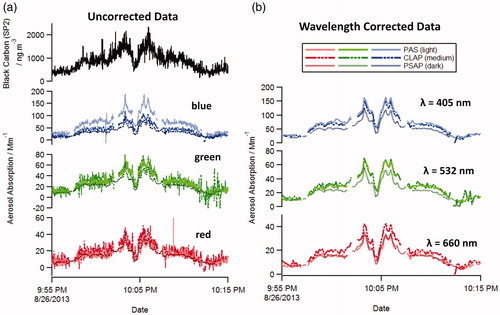
shows a time series of absorption coefficients measured by the PAS, PSAP, CLAP, and rBC mass measured by the SP2. The time series is a portion of the Rim Fire plume sampled over western Nevada on 26 August 2013 between altitudes of 1–8 km. The data shown in are not wavelength adjusted and are presented as they are available on the SEAC4RS archive. The data after wavelength adjustment and averaged over 10 s intervals are shown in . Both before and after wavelength adjustment, the measurements of absorption coefficients (PAS, PSAP, CLAP) are correlated but disagree on the magnitude. The PSAP is the lowest of the three measurements for all three wavelengths.
Figure 2. Time series of absorption and black carbon concentration as a function of time during the 26 August 2013 for (a) the unadjusted data and (b) the data after wavelength adjustment and 10 s averaging. The scatter in the 1 s data in panel A is due to both instrumental noise/precision and particle shot noise; however, in panel b, the uncertainties are dominated by overall accuracy of each measurement.
3.2. Intercomparison of plume absorptions
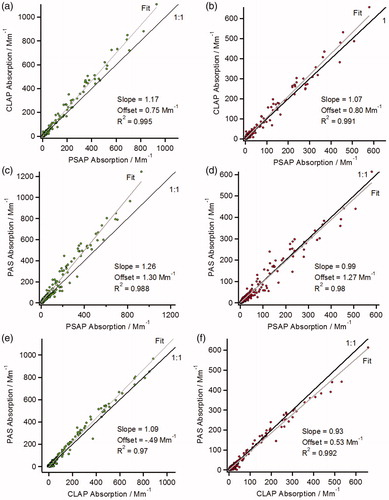
shows the agreements between each wavelength-adjusted, 10 s averaged, red and green absorption measurements for all the plumes during the SEAC4RS campaign. All three red and green absorption measurements are linearly correlated as demonstrated by orthogonal distance regression fit. At 660 nm, the agreement between all the instruments is within 10% (). At 532 nm, the agreement between the PAS and CLAP () is also within 10%. However, the PSAP at 532 nm () measures a lower absorption coefficient relative to the other two instruments.
Figure 3. Scatter plots comparing the green (532 nm, left plots) and red (660 nm, right plots) absorption data. Orthogonal distance fits (gray) and 1:1 lines (black) are shown.
The agreement between the blue absorption measurements is shown in . For the blue data, there is a significant nonlinearity at high signal, where the PAS measurement is low compared with either of the filter-based measurements (PSAP or CLAP). The nonlinearity is apparent if one compares the slopes of linear fits to the complete dataset (, main plots) and subset of data with absorption coefficients less than 200 Mm−1 (, inset plots). For the comparison between the two filter instruments (CLAP/PSAP), there is a small difference when the slopes of the all absorption and low absorption data are compared (); 1.19 and 1.28, respectively.
Figure 4. Scatter plots comparing the 405 nm absorption data during plumes. Plots (a), (b), and (c) show comparisons of the absorption coefficients by instrument, and plot (d) shows the PAS 405 nm data against the PAS 532 nm data. Each insert plot shows the same data where the scale is limited to less than 200 Mm−1. Orthogonal distance fits (gray) and 1:1 lines (black) are shown.
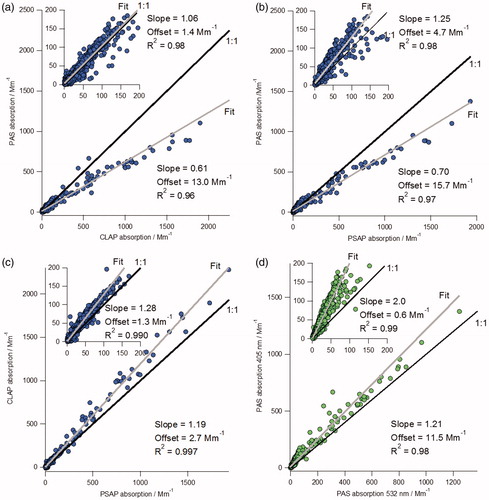
This nonlinearity is also present in the comparison of the PAS 405 nm and PAS 532 nm channels (). When we compare the 405 and 532 nm data for the PSAP and CLAP, we observe a good correlation at both low and high absorption. This suggests an instrumental issue with the PAS 405 nm measurement at absorption coefficients greater than 200 Mm−1. This nonlinearity could be due to a saturation of the microphone amplifier at high signal levels. We have excluded these high absorption PAS data from any further analyses when discussing the plume data in the next section.
The best agreements are between the CLAP and PAS instruments indicating that the PSAP may be underestimating absorption at green and blue wavelengths during the SEAC4RS campaign. We note that the CLAP and PAS shared an instrumentation rack aboard the aircraft and many components upstream of the measurement, i.e., dryer, scrubber, and impactor. This could indicate that particles were being lost in the tubing prior to the PSAP although this is unlikely given that accumulation mode particles dominate biomass burning (Reid et al. Citation2005) and are expected to be efficiently transported to each instrument. Although the disagreement between the PSAP and the other instruments is larger, it is within the summed uncertainties of the measurements.
3.2.1. Single scattering albedos, mass absorption coefficients, and AAE
Histograms of the single scattering albedo (SSA) and mass absorption coefficients (MAC) for the plume data of each instrument are shown in . For each absorption measurement, the SSA was determined using EquationEquation (3)(3) . The MAC was calculated for each PAS cell, including the blue and red thermodenuded (TD) cells, using EquationEquation (4)
(4) .
Figure 5. Histograms of single scattering albedo and effective mass absorption coefficient for plume data taken during SEAC4Rs. Blue PAS data greater than 200 Mm−1 are excluded from these plots. In each case the single scattering albedo is calculated as the ratio of the difference between the CRDS extinction and the absorption to the CRDS extinction. TD indicates data from the thermodenuded PAS cells.
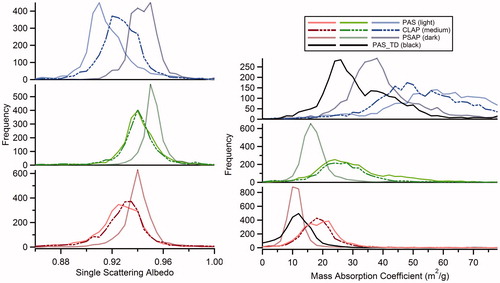
A Gaussian fit was used to determine the central value of each histogram to give an average SSA and MAC for each instrument and wavelength. These averages are given in along with a literature value for MAC given by Bond and Bergstrom (Citation2006) which is calculated using EquationEquation (5)(5) .
Table 1. Single scattering albedo and mass absorption cross-section averages for all SEAC4RS plumes.
Due to the mathematical relationship between the absorption coefficient and the SSA, the relative spread of SSA between instruments is lower than the relative spread of absorption coefficients: for red the SSA range is 0.93–0.94, for green it is 0.94–0.95, and for blue it is 0.92–0.95. The SSA of the measured aerosol particles rarely drops below a value of 0.9. It is, therefore, likely that, even in the case of the Rim Fire plume, the aerosol particles have a net negative (cooling) direct radiative forcing (Haywood and Shine Citation1995).
The effective mass absorption coefficients observed during SEAC4RS ( and ) are much higher than the mass absorption coefficient for pure black carbon reported in Bond and Bergstrom (Citation2006). When comparing the non-thermodenuded MACs to the Bond and Bergstrom values the difference is approximately a factor of three at 660 nm and a factor of four to six at 405 nm. Clear coatings on black carbon cores can enhance absorption across the visible spectrum (sometime referred to as the “lensing” effect); however, the coating enhancement would at most account for an enhancement factor of 1.9 (Bond, Habib, and Bergstrom Citation2006). Additionally, the presence of BrC can increase the absorption in the blue region spectrum. Both of these effects should be significantly reduced by thermodenuding the aerosol; however, the effective MACs calculated using the thermodenuded PAS channels are smaller but still a factor of two to three larger than the BC MACs suggested by Bond and Bergstrom (Citation2006). Recent work by Zanatta et al. (Citation2016) suggests similar MAC values at 660 nm for some European sites. The presence of brown carbon could explain the enhanced MACs in the blue region of the spectrum, but brown carbon is not expected to contribute significantly to the absorption at 532 and 660 nm. As stated above when calculating the SSA and MAC at 405 nm, we excluded the 405 nm data above 200 Mm−1 due to the nonlinear response. If these data are included in the SSA and MAC calculations, the effect is to shift the values by <1%. The absorption Ångström exponents derived from the absorption measurements () are also larger than the AAE expected from BC (AAEBC ≅ 1).
Table 2. Absorption Ångström exponents for aerosol absorption in plumes.
4. Discussion and conclusions
The comparison of aerosol absorption measurements from the PAS, CLAP, and PSAP during the SEAC4RS campaign showed disagreements amongst instruments ranging from 5% to 25% during periods of high aerosol absorption in biomass burning plumes. The observed disagreement between the instruments were within summed accuracy of each pair of instruments. One of the instruments may be more accurate than the other two, but that cannot be determined from the intercomparison data.
The 1σ detection limits for 1 min averages under SEAC4RS operating conditions were less than 1.5 Mm−1 for the PAS instrument, less 2.0 Mm−1 for the CLAP instrument, and less than 0.2 Mm−1 for the PSAP instrument. Under other conditions (such as ground and laboratory-based measurements), lower detection limits have been achieved with similar instrumentation (Ogren et al. Citation2017). These detection limits were sufficient to observe absorption outside of plumes in the boundary layer, but not the free troposphere (see the SI, Section S4).
Calculation of local direct radiative forcing is one application of in situ absorption measurements from aircraft. To illustrate the impact of instrument accuracy and precision on the calculation of radiative forcing, we consider two cases using the radiative forcing model of Chylek and Wong (Citation1995). In the case of a column of highly absorbing aerosol, the 5–25% range of disagreement between the measurements results in a similar range of the predicted direct radiative forcing due to absorption of light by aerosol.
In clean conditions when the aerosol absorption is below detection limit, the lack of precision can also lead to a larger than desired range of total radiative forcing predicted from these absorption measurements. To estimate a range of absorption measurement that would be sufficient, suppose the radiative forcing of absorbing aerosol is desired to be known (locally) to better than 0.5 W m−2 (Chylek, Henderson, and Mishchenko Citation2003). This corresponds to measuring the AAOD to better than 0.002, and is equivalent to an in situ absorption measurement detection limit of 1 Mm−1 integrated over a 2 km deep planetary boundary layer or a 0.2 Mm−1 integrated over a 10 km total atmospheric column (Chylek and Wong Citation1995). The 1σ, 1 min detection limit of the CLAP and PAS instruments are near desired detection limit, and the PSAP is below it. However, if an aircraft rapidly ascending or descending through aerosol layers is considered, a faster measurement is needed and a lower 1 s detection limit is desirable.
These results suggest that calculations of local radiative forcing could benefit from better agreement between in situ airborne absorption measurements and from airborne absorption measurements with lower detection limits.
Although the disagreement between absorption instruments is larger than desired, the agreement is sufficient to make the following observations regarding the mass absorption coefficients collected in biomass burning plumes:
The effective mass absorption coefficients observed during biomass burning plumes are a factor of three to six higher than previously reported BC specific mass absorption coefficients.
Thermodenuding the aerosol prior to the absorption measurement reduces the discrepancy, but does not eliminate it. The thermodenuded MACs are a factor of two to three larger than expected. Although thermodenuding is an imperfect method for removing all BrC or organic aerosol from an aerosol sample, the remaining organic aerosol mass is probably a few percent of the OA upstream of thermodenuder (Huffman et al. Citation2008), which is insufficient to explain the large MACs observed in this study.
Outside of the blue spectral region (where BrC absorbs strongly), the absorption should be dominated by black carbon. However, the absorption Ångström exponent calculated between 532 and 660 nm (ranging from 1.6 to 2.3) is larger than the expected absorption Ångström exponent (AAEBC ≅ 1) for black carbon aerosol.
Absorption from BrC in the biomass burning plume could resolve the discrepancy at shorter wavelengths (blue), but not at longer wavelengths (green and red). In addition to BrC, we have identified four possible explanations (in whole or part) for the aerosol absorption observed in the biomass burning plumes.
There could be a systematic high bias in all three absorption measurements. It is unlikely that this could be as large as a factor of three when independent instruments agreed to within 25%.
There could be significant refractory BC in the Aitken or coarse modes that is not measured by the SP2. Such nonaccumulation BC is not consistent with existing literature describing BC measurement in biomass burning plumes and would not explain the large AAE observed in the SEAC4RS biomass burning plumes. Similarly, scaling the SP2 measurements for accumulation mode BC by a factor of greater than three is inconsistent with its calibrations and would not explain the AAE.
Enhancement of rBC absorption by coatings could account for an enhancement of BC absorption by at most a factor of 1.9 if the BC core and shell are spherical (Bond, Habib, and Bergstrom Citation2006). In a fresh biomass burning plume, Lack et al. (Citation2012a) observed an average coating enhancement of 1.38 and a maximum of 1.7.
There could be an additional absorber that does not incandesce in the SP2 and has significant absorption at 660 and 532 nm in addition to a stronger absorption at 405 nm. Tar balls are a candidate for this additional absorber (Posfai et al. Citation2003; Sedlacek et al. Citation2018). They have been identified in biomass burning plumes using electron microscopy of samples collected on filters and absorb light (Hand et al. Citation2005). It is not clear how strongly tar balls absorb or how the SP2 responds to tar balls. There were no electron microscopy measurements during SEAC4RS to constrain the abundance of tar balls.
The disagreement between the observed MAC and the expected MAC for BC (especially at longer wavelengths) point to the need for further research into the MAC and total aerosol absorption budgets from biomass burning aerosol in both fresh and aged plumes. In addition to new measurements, compilation and analysis of measurements from existing datasets (such as the Biomass Burning Observations Project, Deep Convective Cloudsand, Chemistry Experiment, etc.) are needed.
Overall, the data demonstrate agreement between the various absorption measurements to within their stated uncertainties. However, accurate radiative forcing calculations will require further development of aerosol absorption instrument and additional measurements of aerosol absorption in biomass burning plumes with careful attention to calibrations and instrumental agreement. There are also open questions about the relative contributions of soot, brown carbon, and other, possibly unknown, species to the absorption of light by aerosol particles in biomass burning plumes.
Supplemental Material
Download Zip (1.5 MB)Acknowledgments
We thank the NASA DC-8 scientists, flight crews, and support staff for their outstanding efforts in the field.
Additional information
Funding
Notes
1 Commercial equipment and materials are identified in this article to specify the experimental procedures. The identification does not imply recognition or endorsement by the National Oceanic and Atmospheric Administration, nor does it imply that the material or equipment identified is the best available for the purpose.
Related Research Data
References
- Anderson, T. L., and J. A. Ogren. 1998. Determining Aerosol Radiative Properties Using the TSI 3563 Integrating Nephelometer. Aerosol Sci. Tech 29(1):57–69.
- Andrews, E., J. Ogren, S. Kinne, and B. Samset. 2017. Comparison of AOD, AAOD and Column Single Scattering Albedo from AERONET Retrievals and in situ Profiling Measurements. Atmos. Chem. Phys. 17(9):6041–72.
- Arnott, W. P., J. W. Walker, H. Moosmuller, R. A. Elleman, H. H. Jonsson, G. Buzorius, W. C. Conant, R. C. Flagan, and J. H. Seinfeld. 2006. Photoacoustic Insight for Aerosol Light Absorption Aloft from Meteorological Aircraft and Comparison with Particle Soot Absorption Photometer Measurements: DOE Southern Great Plains Climate Research Facility and the Coastal Stratocumulus Imposed Perturbation Experiments. J. Geophys. Res. 111(D5).
- Arnott, W. P., B. Zielinska, C. F. Rogers, J. Sagebiel, K. H. Park, J. Chow, H. Moosmuller, J. G. Watson, K. Kelly, D. Wagner, et al. 2005. Evaluation of 1047-nm Photoacoustic Instruments and Photoelectric Aerosol Sensors in Source-Sampling of Black Carbon Aerosol and Particle-bound PAHs from Gasoline and Diesel Powered Vehicles. Environ. Sci. Technol. 39(14):5398–406.
- Bluvshtein, N., J. M. Flores, Q. He, E. Segre, L. Segev, N. Hong, A. Donohue, J. N. Hilfiker, and Y. Rudich. 2017. Calibration of a Photoacoustic Spectrometer Cell Using Light Absorbing Aerosols. Atmos. Meas. Tech 10(3):1203–13.
- Bond, T. C., T. L. Anderson, and D. Campbell. 1999. Calibration and Intercomparison of Filter-Based Measurements of Visible Light Absorption by Aerosols. Aerosol Sci. Technol. 30(6):582–600.
- Bond, T. C., and R. W. Bergstrom. 2006. Light Absorption by Carbonaceous Particles: An Investigative Review. Aerosol Sci. Technol. 40(1):27–67.
- Bond, T. C., S. J. Doherty, D. W. Fahey, P. M. Forster, T. Berntsen, B. J. DeAngelo, M. G. Flanner, S. Ghan, B. Kärcher, D. Koch, et al. 2013. Bounding the Role of Black Carbon in the Climate System: A Scientific Assessment. J. Geophys. Res. Atmos. 118(11):5380–552.
- Bond, T. C., G. Habib, and R. W. Bergstrom. 2006. Limitations in the Enhancement of Visible Light Absorption Due to Mixing State. J. Geophys. Res. 111(D20):13.
- Cappa, C. D., D. A. Lack, J. B. Burkholder, and A. R. Ravishankara. 2008. Bias in Filter-based Aerosol Light Absorption Measurements Due to Organic Aerosol Loading: Evidence from Laboratory Measurements. Aerosol Sci. Technol. 42(12):1022–32.
- Chow, J. C., J. G. Watson, P. Doraiswamy, L.-W. A. Chen, D. A. Sodeman, D. H. Lowenthal, K. H. Park, W. P. Arnott, and N. Motallebi. 2009. Aerosol Light Absorption, Black Carbon, and Elemental Carbon at the Fresno Supersite, California. Atmos. Res. 93(4):874–87.
- Chung, C. E., V. Ramanathan, and D. Decremer. 2012. Observationally Constrained Estimates of Carbonaceous Aerosol Radiative Forcing. Proc. Nat. Academy Sciences 109(29):11624–9.
- Chylek, P., B. Henderson, and M. Mishchenko. 2003. Aerosol Radiative Forcing and the Accuracy of Satellite Aerosol Optical Depth Retrieval. J. Geophys. Res. 108:8(D24):n/a.
- Chylek, P., and J. Wong. 1995. Effect of Absorbing Aerosols on Global Radiation Budget. Geophys. Res. Lett. 22(8):929–31.
- Davies, N. W., M. I. Cotterell, C. Fox, K. Szpek, J. M. Haywood, and J. M. Langridge. 2018. On the Accuracy of Aerosol Photoacoustic Spectrometer Calibrations Using Absorption by Ozone. Atmos. Meas. Tech. Discuss 2018 :1–19.
- Fierz, M., M. G. C. Vernooij, and H. Burtscher. 2007. An Improved Low-Flow Thermodenuder. J. Aerosol Sci. 38(11):1163–8.
- Forrister, H., J. Liu, E. Scheuer, J. Dibb, L. D. Ziemba, K. L. Thornhill, B. Anderson, G. S. Diskin, A. E. Perring, J. P. Schwarz, et al. 2015. Evolution of Brown Carbon in Wildfire Plumes. Geophys. Res. Lett 42(11):4623–30.
- Haisch, C. 2012. Photoacoustic Spectroscopy for Analytical Measurements. Measurement Sci. Technol. 23(1):012001.
- Hand, J. L., W. C. Malm, A. Laskin, D. Day, T. Lee, C. Wang, C. Carrico, J. Carrillo, J. P. Cowin, J. Collett, et al. 2005. Optical, Physical, and Chemical Properties of Tar Balls Observed During the Yosemite Aerosol Characterization Study. J. Geophys. Res. 110(D21):14.
- Hansen, A. D. A., H. Rosen, and T. Novakov. 1982. Real-time Measurement of the Absorption Coefficient of Aerosol Particles. Appl. Opt. 21(17):3060–62.
- Havey, D. K., P. A. Bueno, K. A. Gillis, J. T. Hodges, G. W. Mulholland, R. D. van Zee, and M. R. Zachariah. 2010. Photoacoustic Spectrometer with a Calculable Cell Constant for Measurements of Gases and Aerosols. Anal. Chem. 82(19):7935–7942.
- Haywood, J. M., and K. P. Shine. 1995. The Effect of Anthropogenic Sulfate and Soot Aerosol on the Clear-sky Planetary Radiation Budget. Geophys. Res. Lett. 22(5):603–6.
- Hitzenberger, R., A. Petzold, H. Bauer, P. Ctyroky, P. Pouresmaeil, L. Laskus, and H. Puxbaum. 2006. Intercomparison of Thermal and Optical Measurement Methods for Elemental Carbon and Black Carbon at an Urban Location. Environ. Sci. Technol. 40(20):6377–83.
- Huffman, J. A., P. J. Ziemann, J. T. Jayne, D. R. Worsnop, and J. L. Jimenez. 2008. Development and Characterization of a Fast-Stepping/Scanning Thermodenuder for Chemically-resolved Aerosol Volatility Measurements. Aerosol Sci. Technol. 42(5):395–407.
- Koch, D., M. Schulz, S. Kinne, C. McNaughton, J. R. Spackman, Y. Balkanski, S. Bauer, T. Berntsen, T. C. Bond, O. Boucher, et al. 2009. Evaluation of Black Carbon Estimations in Global Aerosol Models. Atmos. Chem. Phys 9(22):9001–26.
- Lack, D. A., C. D. Cappa, D. S. Covert, T. Baynard, P. Massoli, B. Sierau, T. S. Bates, P. K. Quinn, E. R. Lovejoy, and A. R. Ravishankara. 2008. Bias in Filter-based Aerosol Light Absorption Measurements Due to Organic Aerosol Loading: Evidence from Ambient Measurements. Aerosol Sci. Tech 42(12):1033–41.
- Lack, D. A., and J. M. Langridge. 2013. On the Attribution of Black and Brown Carbon Light Absorption Using the Angstrom Exponent. Atmos. Chem. Phys. 13(20):10535–43.
- Lack, D. A., J. M. Langridge, R. Bahreini, C. D. Cappa, A. M. Middlebrook, and J. P. Schwarz. 2012. Brown Carbon and Internal Mixing in Biomass Burning Particles. Proc. Nat. Academy Sciences United States America 109(37):14802–7.
- Lack, D. A., E. R. Lovejoy, T. Baynard, A. Pettersson, and A. R. Ravishankara. 2006. Aerosol Absorption Measurement Using Photoacoustic Spectroscopy: Sensitivity, Calibration, and Uncertainty Developments. Aerosol Sci. Technol. 40(9):697–708.
- Lack, D. A., M. S. Richardson, D. Law, J. M. Langridge, C. D. Cappa, R. J. McLaughlin, and D. M. Murphy. 2012. Aircraft Instrument for Comprehensive Characterization of Aerosol Optical Properties, part 2: Black and Brown Carbon Absorption and Absorption Enhancement Measured with Photo Acoustic Spectroscopy. Aerosol Sci. Technol. 46(5):555–68.
- Langridge, J. M., M. S. Richardson, D. A. Lack, C. A. Brock, and D. M. Murphy. 2013. Limitations of the Photoacoustic Technique for Aerosol Absorption Measurement at High Relative Humidity. Aerosol Sci. Technol. 47(11):1163–73.
- Langridge, J. M., M. S. Richardson, D. A. Lack, D. Law, and D. M. Murphy. 2011. Aircraft Instrument for Comprehensive Characterization of Aerosol Optical Properties, Part I: Wavelength-Dependent Optical Extinction and its Relative Humidity Dependence Measured Using Cavity Ringdown Spectroscopy. Aerosol Sci. Tech 45(11):1305–18.
- Lee, H. J., P. K. Aiona, A. Laskin, J. Laskin, and S. A. Nizkorodov. 2014. Effect of Solar Radiation on the Optical Properties and Molecular Composition of Laboratory Proxies of Atmospheric Brown Carbon. Environ. Sci. Technol. 48(17):10217–26.
- Liu, J., E. Scheuer, J. Dibb, G. S. Diskin, L. D. Ziemba, K. L. Thornhill, B. E. Anderson, A. Wisthaler, T. Mikoviny, J. J. Devi, et al. 2015. Brown Carbon Aerosol in the North American Continental Troposphere: Sources, Abundance, and Radiative Forcing. Atmos. Chem. Phys. 15(14):7841–58.
- Liu, X., Y. Zhang, L. G. Huey, R. J. Yokelson, Y. Wang, J. L. Jimenez, P. Campuzano-Jost, A. J. Beyersdorf, D. R. Blake, Y. Choi, et al. 2016. Agricultural Fires in the Southeastern US During SEAC4RS: Emissions of Trace Gases and Particles and Evolution of Ozone, Reactive Nitrogen, and Organic Aerosol. J. Geophys. Res. Atmos. 121(12):7383–7414.
- Mallet, M.,. F. Dulac, P. Formenti, P. Nabat, J. Sciare, G. Roberts, J. Pelon, G. Ancellet, D. Tanré, F. Parol, et al. 2016. Overview of the Chemistry-aerosol Mediterranean Experiment/Aerosol Direct Radiative Forcing on the Mediterranean Climate (ChArMEx/ADRIMED) Summer 2013 Campaign. Atmos. Chem. Phys. 16(2):455–504.
- McComiskey, A., S. E. Schwartz, B. Schmid, H. Guan, E. R. Lewis, P. Ricchiazzi, and J. A. Ogren. 2008. Direct Aerosol Forcing: Calculation From Observables and Sensitivities to Inputs. J. Geophys. Res. 113(D9).
- McNaughton, C. S., A. D. Clarke, S. G. Howell, M. Pinkerton, B. Anderson, L. Thornhill, C. Hudgins, E. Winstead, J. E. Dibb, E. Scheuer, et al. 2007. Results from the DC-8 Inlet Characterization Experiment (DICE): Airborne Versus Surface Sampling of Mineral Dust and Sea Salt Aerosols. Aerosol Sci. Tech 41(2):136–59.
- Miklos, A., P. Hess, and Z. Bozoki. 2001. Application of Acoustic Resonators in Photoacoustic Trace Gas Analysis and Metrology. Rev. Scientific Instruments 72(4):1937–55.
- Moosmuller, H., R. K. Chakrabarty, and W. P. Arnott. 2009. Aerosol Light Absorption and Its Measurement: A Review. J. Quantitative Spectroscopy Radiative Transfer 110(11):844–78.
- Müller, T., J. S. Henzing, G. de Leeuw, A. Wiedensohler, A. Alastuey, H. Angelov, M. Bizjak, M. Collaud Coen, J. E. Engström, C. Gruening, et al. 2011. Characterization and Intercomparison of Aerosol Absorption Photometers: Result of two Intercomparison Workshops. Atmos. Meas. Tech 4(2):245–68.
- Ogren, J. A. 2010. Comment on “Calibration and Intercomparison of Filter-Based Measurements of Visible Light Absorption by Aerosols. Aerosol Sci. Tech 44(8):589–91.
- Ogren, J. A., J. Wendell, E. Andrews, and P. J. Sheridan. 2017. Continuous Light Absorption Photometer for Long-Term Studies. Atmos. Meas. Tech. 10(12):4805–18.
- Onasch, T. B., P. Massoli, P. L. Kebabian, F. B. Hills, F. W. Bacon, and A. Freedman. 2015. Single Scattering Albedo Monitor for Airborne Particulates. Aerosol Sci. Tech 49(4):267–79.
- Peterson, D. A., E. J. Hyer, J. R. Campbell, M. D. Fromm, J. W. Hair, C. F. Butler, and M. A. Fenn. 2015. The 2013 Rim Fire: Implications for Predicting Extreme Fire Spread, Pyroconvection, and Smoke Emissions. Bull. Amer. Meteor. Soc 96(2):229–47.
- Petzold, A., H. Kramer, and M. Schonlinner. 2002. Continuous Measurement of Atmospheric Black Carbon Using a Multi-Angle Absorption Photometer. Environ. Sci. Pollut. Res:78–82.
- Petzold, A., H. Schloesser, P. J. Sheridan, W. P. Arnott, J. A. Ogren, and A. Virkkula. 2005. Evaluation of Multiangle Absorption Photometry for Measuring Aerosol Light Absorption. Aerosol Sci. Tech 39(1):40–51.
- Petzold, A., and M. Schonlinner. 2004. Multi-angle Absorption Photometry—A New Method for the Measurement of Aerosol Light Absorption and Atmospheric Black Carbon. J. Aerosol. Sci. 35(4):421–41.
- Posfai, M., R. Simonics, J. Li, P. V. Hobbs, and P. R. Buseck. 2003. Individual Aerosol Particles from Biomass Burning in Southern Africa: 1. Compositions and Size Distributions of Carbonaceous Particles. J. Geophys. Res 108(D13):n/a.
- Presser, C., A. Nazarian, J. M. Conny, D. Chand, A. Sedlacek, and J. M. Hubbe. 2017. Absorption/Transmission Measurements of PSAP Particle-laden Filters from the Biomass Burning Observation Project (BBOP) Field Campaign. Aerosol Sci. Technol. 51(4):451–66.
- Radney, J. G., R. You, X. Ma, J. M. Conny, M. R. Zachariah, J. T. Hodges, and C. D. Zangmeister. 2014. Dependence of Soot Optical Properties on Particle Morphology: Measurements and Model Comparisons. Environ. Sci. Technol. 48(6):3169–76.
- Reid, J. S., R. Koppmann, T. F. Eck, and D. P. Eleuterio. 2005. A Review of Biomass Burning Emissions Part II: Intensive Physical Properties of Biomass Burning Particles. Atmos. Chem. Phys 5(3):799–825.
- Saide, P. E., D. A. Peterson, A. da Silva, B. Anderson, L. D. Ziemba, G. S. Diskin, G. Sachse, J. W. Hair, C. F. Butler, M. A. Fenn, et al. 2015. Revealing Important Nocturnal and Day-to-day Variations in Fire Smoke Emissions Through a Multiplatform Inversion. Geophys. Res. Lett 42(9):3609–18.
- Saleh, R., E. S. Robinson, D. S. Tkacik, A. T. Ahern, S. Liu, A. C. Aiken, R. C. Sullivan, A. A. Presto, M. K. Dubey, R. J. Yokelson, et al. 2014. Brownness of Organics in Aerosols from Biomass Burning Linked to Their Black Carbon Content. Nature Geosci. 7(9):647–50.
- Sanford, T. J., D. M. Murphy, D. S. Thomson, and R. W. Fox. 2008. Albedo Measurements and Optical Sizing of Single Aerosol Particles. Aerosol Sci. technol. 42(11):958–69.
- Schwarz, J. P., R. S. Gao, D. W. Fahey, D. S. Thomson, L. A. Watts, J. C. Wilson, J. M. Reeves, M. Darbeheshti, D. G. Baumgardner, G. L. Kok, et al. 2006. Single-particle Measurements of Midlatitude Black Carbon and Light-Scattering Aerosols from the Boundary Layer to the Lower Stratosphere. J. Geophys. Res. 111(D16).
- Schwarz, J. P., R. S. Gao, J. R. Spackman, L. A. Watts, D. S. Thomson, D. W. Fahey, T. B. Ryerson, J. Peischl, J. S. Holloway, M. Trainer, et al. 2008. Measurement of the Mixing State, Mass, and Optical Size of Individual Black Carbon Particles in Urban and Biomass Burning Emissions. Geophysical Res. Letters 35(13).
- Schwarz, J. P., J. R. Spackman, R. S. Gao, A. E. Perring, E. Cross, T. B. Onasch, A. Ahern, W. Wrobel, P. Davidovits, J. Olfert, et al. 2010. The Detection Efficiency of the Single Particle Soot Photometer. Aerosol Sci. Tech 44(8):612–28.
- Sedlacek, A. J., P. R. Buseck, K. Adachi, T. B. Onasch, S. R. Springston, and L. Kleinman. 2018. Formation and Evolution of Tar Balls from Northwestern US Wildfires. Atmos. Chem. Phys. Discuss. 2018:1–28.
- Sheridan, P. J., E. Andrews, J. A. Ogren, J. L. Tackett, and D. M. Winker. 2012. Vertical Profiles of Aerosol Optical Properties over Central Illinois and Comparison with Surface and Satellite Measurements. Atmos. Chem. Phys. Discuss 12(7):17187–721.
- Sheridan, P. J., W. P. Arnott, J. A. Ogren, E. Andrews, D. B. Atkinson, D. S. Covert, H. Moosmuller, A. Petzold, B. Schmid, A. W. Strawa, et al. 2005. The reno aerosol optics study: an evaluation of aerosol absorption measurement methods. Aerosol Sci. Tech 39(1):1–16.
- Sherman, J. P., P. J. Sheridan, J. A. Ogren, E. Andrews, D. Hageman, L. Schmeisser, A. Jefferson, and S. Sharma. 2015. A Multi-year Study of Lower Tropospheric Aerosol Variability and Systematic Relationships from four North American Regions. Atmos. Chem. Phys 15(21):12487–517.
- Stocker, T. F., Qin, D., Plattner, G.-K., Tignor, M., Allen, S. K., Boschung, J., Nauels, A., Xia, Y., Bex, V., Midgley, P. M., eds. 2013. IPCC, 2013: Climate Change 2013: The Physical Science Basis. Contribution of Working Group I to the Fifth Assessment Report of the Intergovernmental Panel on Climate Change. Cambridge, UK/New York, NY: Cambridge University Press.
- Strawa, A. W., R. Castaneda, T. Owano, D. S. Baer, and B. A. Paldus. 2003. The Measurement of Aerosol Optical Properties Using Continuous Wave Cavity Ring-Down Techniques. J. Atmospheric Oceanic Technol. 20(4):454–465.
- Strawa, A. W., R. Elleman, A. G. Hallar, D. Covert, K. Ricci, R. Provencal, T. W. Owano, H. H. Jonsson, B. Schmid, A. P. Luu, et al. 2006. Comparison of In Situ Aerosol Extinction and Scattering Coefficient Measurements Made During the Aerosol Intensive Operating Period. J. Geophys. Res 111(D5).
- Taubman, B. F., L. T. Marufu, B. L. Vant-Hull, C. A. Piety, B. G. Doddridge, R. R. Dickerson, and Z. Q. Li. 2004. Smoke Over Haze: Aircraft Observations of Chemical and Optical Properties and the Effects on Heating Rates and Stability. J. Geophys. Res. 109(D2).
- Thompson, J. E., N. Barta, D. Policarpio, and R. DuVall. 2008. A Fixed Frequency Aerosol Albedometer. Optics Express 16(3):2191–05.
- Toon, O. B., H. Maring, J. Dibb, R. Ferrare, D. J. Jacob, E. J. Jensen, Z. J. Luo, G. G. Mace, L. L. Pan, L. Pfister, et al. 2016. Planning, Implementation, and Scientific Goals of the Studies of Emissions and Atmospheric Composition, Clouds and Climate Coupling by Regional Surveys (SEAC(4)RS) field mission. J. Geophys. Res. Atmos 121(9):4967–5009.
- Virkkula, A., N. C. Ahlquist, D. S. Covert, P. J. Sheridan, W. P. Arnott, and J. A. Ogren. 2005. A Three-Wavelength Optical Extinction cell for Measuring Aerosol Light Extinction and its Application to Determining Light Absorption Coefficient. Aerosol Sci. Tech 39(1):52–67.
- Weyant, C. L., P. B. Shepson, R. Subramanian, M. O. L. Cambaliza, A. Heimburger, D. McCabe, E. Baum, B. H. Stirm, and T. C. Bond. 2016. Black carbon emissions from associated natural gas flaring. Environmental Sci. Technol. 50(4):2075–81.
- Wu, Y., P. Yan, P. Tian, J. Tao, L. Li, J. Chen, Y. Zhang, N. Cao, C. Chen, and R. Zhang. 2015. Spectral Light Absorption of Ambient Aerosols in Urban Beijing During Summer: An Intercomparison of Measurements from a Range Of Instruments. Aerosol Air Qual. Res 15(4):1178–87.
- Zanatta, M., M. Gysel, N. Bukowiecki, T. Muller, E. Weingartner, H. Areskoug, M. Fiebig, K. E. Yttri, N. Mihalopoulos, G. Kouvarakis, et al. 2016. A European Aerosol Phenomenology-5: Climatology of Black Carbon Optical Properties at 9 Regional Background Sites Across Europe. Atmos. Environ 145 :346–64.
- Zhong, M., and M. Jang. 2014. Dynamic Light Absorption of Biomass-Burning Organic Carbon Photochemically Aged Under Natural Sunlight. Atmospheric Chemistry Physics 14(3):1517–25.
- Ziemba, L. D., K. L. Thornhill, R. Ferrare, J. Barrick, A. J. Beyersdorf, G. Chen, S. N. Crumeyrolle, J. Hair, C. Hostetler, C. Hudgins, et al. 2013. Airborne Observations of Aerosol Extinction by In Situ and Remote-Sensing Techniques: Evaluation of Particle Hygroscopicity. Geophys. Res. Lett 40(2):417–22.