
Abstract
The use of a high-speed aerosol flow is proposed for sampling RDX from the surface followed by chromatographic analysis. The aerosol is generated from different solvents by means of a coaxial nebulizer. The effect of the aerosol flow parameters (solvent flowrate, an angle of the nebulizer inclination with respect to the surface) and various solvents (water, acetone, and hexane) on the efficiency of the RDX desorption was investigated. The optimal angle of the nebulizer was found to be 30°, under these conditions, the desorption of RDX from the surfaces of different structure (metal, glass, leather, cotton fabric, and paper) has also been studied. It is shown that under the action of an aerosol created using water and acetone, desorption from a smooth surface occurs most efficiently (1.5 times higher than with hexane). In this case, the sample removes almost completely (about 80%) by the aerosol flow in a few seconds. A relationship between the desorption efficiency and the amount of the solvent sprayed (that is the amount of aerosol particles in desorbing flow) has a characteristic maximum which location depends on the properties of the solvent spray. This effect is associated with a rate of solvent evaporation. Under optimal conditions for desorption of RDX from a smooth surface using an aqueous aerosol, an LOD of ∼10 ng can be achieved. For porous and rough surfaces, the efficiency of the analyte desorption decreases (three times for leather and cotton fabric). The results of the experiments conducted allow one to conclude that the RDX solubility in the solvent used does not affect considerably the efficiency of the RDX desorption. It is assumed that small aerosol drops are very active and can capture the particles of the target analyte. This promotes the desorption of RDX molecules from the surface.
© 2018 American Association for Aerosol Research
EDITOR:
1. Introduction
An ever-growing terrorism threat has promoted investigations on the development and improvement of the technologies and devices for detection of explosive traces, among which hexogen (RDX: C3H6N6O6) holds a prominent place. RDX is an explosive of increased yield surpassing trinitrotoluene (TNT: C7H5N3O6) in efficiency 1.4 times and in velocity of detonation 1.2 times. Plastic explosives, such as Semtex, produced on the basis of PETN and RDX are often used by terrorists, since they are difficult to detect by gas analytical methods because of extremely low vapor pressure and relatively simple get it (Aspects of Explosives Detection Citation2009). In particular, Chechen terrorists conducted a number of horrific attacks in Russia using military explosives such as RDX. In this connection, the task of RDX traces detection at the surface of baggage, hand luggage, at documents and passenger’s hands at the airports, stations, and security checkpoints is of great importance through a security of transportations.
For any method of detection, sampling is an important step, since this largely determines the characteristics of the entire process. Due to low-saturated vapor pressure (6.0 ppt at 25°C; Moore, Citation2004); RDX traces are usually detected by microparticles, wiping the surface being examined. Then follows the thermal desorption from the wiping material and analysis using various gas analyzers: mass spectrometer (MS; González-Méndez et al. Citation2015); ion mobility spectrometers and field asymmetric waveform ion mobility spectrometry (IMS, FAIMS; Zalewska, Pawłowski, and Tomaszewski Citation2013), gas chromatograph (GC; Waddell et al. Citation2005); or a combination thereof (GC/MS, GC/IMS; Groom et al. Citation2001; Hajialigol et al. Citation2012). The wiping material is an additional source of impurities that reduce the sensitivity and selectivity of the assay (Liu and Pack Citation2007). In addition, intermediate manipulations increase sample preparation time and make analysis in the field difficult.
The search for ways to simplify the preparation of samples led to the development of a number of methods, commonly called ambient mass spectrometry (Monge et al. Citation2013). These methods, in which analyte ions are formed by the action of charged droplets, particles, ions, or metastable atoms on the surface, include: Desorption Electrospray Ionization (DESI, Cotte-Rodriguez et al., Citation2005; Cotte-Rodríguez and Cooks Citation2006; Takáts et al. Citation2005; Justes et al. Citation2007), Direct Analysis in Real Time (DART, Petucci et al. Citation2007; Cody, Laramée, and Durst Citation2005), and Desorption Atmospheric Pressure Chemical Ionization (DAPCI, Chen et al. Citation2007). The methods have a great potential for analyzing surfaces, as they bypass the stage of sample preparation. However, since the MS is used as an analyzer, the methods become expensive and not always applicable in the field. On the other hand, the DESI simulation shows that the hydrodynamic forces play an important role in the desorption of the analyte from the surfaces in this process (Costa and Cooks Citation2008). Therefore, it seems reasonable to separate desorption and analysis in this case. Such approach allows collecting microparticles without manual sampling and using a simple device for analysis (e.g., gas chromatograph).
For materials soluble in DESI solvents, desorption of neutral molecules does occur (Venter et al. Citation2010). However, solubility does not appear to play an important role in the desorption process. For example, a method for desorbing explosives (including low volatility such as RDX and HMX) from the human skin with a neutral gas flow was described (Chen et al. Citation2009). A skin area of ∼10 mm2 containing traces of explosives was blown with a stream of pure nitrogen at a linear velocity of 300 m/s, which provides a soft desorption of the explosive from the surface. The obtained material was delivered to the analysis site using a Teflon tube 3 mm in diameter and 4 m in length. This method is very interesting, because it could be used in the search for explosive traces in the field.
Analyzing the experimental work (Chen et al. Citation2009), we assumed that increased humidity due to evaporation from the surface of the human body promotes the formation of a water aerosol at the desorption site, which facilitates the desorption and transport of RDX. Accordingly, for better desorption reasonable to create an aerosol flow by adding liquid in a gas stream. As one of the options, coaxial sprayer can be used for this purpose.
Thus, in this article, we propose using a high-speed aerosol flow for the desorption of RDX from the surface. In the experiments, we use pure (twice recrystallized) RDX without process impurities and plasticizers, as the work presented is the first step in implementing this approach for detecting traces of RDX (and other compounds) on various surfaces. In the future, work with the use of real samples is supposed. The aerosolized material is collected on a mesh concentrator and then analyzed by a portable gas chromatograph EKHO-M. With this approach, the influence of experimental conditions (solvent flow rate, spray angle on the surface) and solvents (water, acetone, hexane) on the efficiency of desorption of RDX was investigated. In addition, the desorption of RDX from different surfaces (metal, glass, leather, cotton cloth, and paper) is considered.
2. Experiment and instrumentation
2.1. Coaxial nebulizer
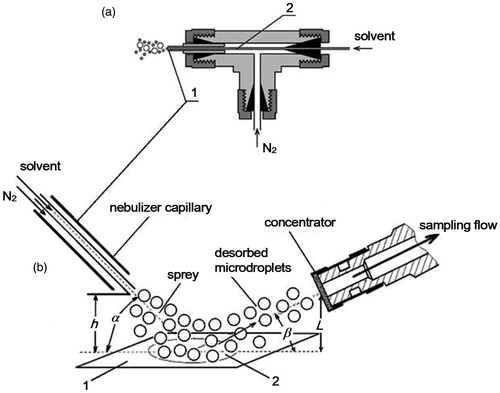
We made a coaxial nebulizer () for experiments. We used a Swagelok SS-2M0-3 tee for capillaries 2 mm O.D. as a housing. A spray part is a coaxial capillary assembly. We delivered solvent along the internal capillary (0.7 mm OD, 0.1 mm ID) and nitrogen gas along the outside capillary (2 mm OD, 1 mm ID). We controlled the solvent flowrate within the range of 0.1–40 ml/h with a precision of 2.5% using a Perfusor Compact S syringe pump of B BRAUN (Germany). We controlled the nitrogen flowrate within the range of 1–10 l/min with a PB-150/12.5 B2 (Russia) reducer and measured the gas flow with a precision of 2% with a MASS-VIEW MV-304 rotameter (Holland).
Figure 1. (a) Schematic diagram of the coaxial nebulizer. 1 – outside capillary, 2 – internal capillary. (b) Schematic diagram of the sample desorption from the surface with the coaxial nebulizer. 1 – examined surface, 2 – spot of deposited RDX.
2.2. EKHO-M field gas chromatograph
We used an EKHO-M field chromatograph 450 × 30 × 136 mm in size and 12 kg in weight (produced by “Sibertech,” Novosibirsk, Russia) to detect RDX. The EKHO-M is provided with a multicapillary column (containing about 1,000 capillaries 220 mm in length, 40 µm in diameter coated with SE-30 stationary liquid phase) and an electron capture detector (ECD) with a 63Ni β-source. We used a grid concentrator ∼10 mm in diameter consisting of four fine grids from stainless steel (wire size, 0.12 mm; mesh size, 0.3 mm) to collect the sample and inject it into the chromatograph. The air flowrate through the concentrator was 2 l/min. We placed the concentrator after sampling into the injection chamber of the EKHO-M analytical unit (see Figure S1 in the online supplementary information [SI]). Therewith, the concentrator heating took place and a pneumo-electric valve actuated. As a result, a hot carrier-gas flow removed the sample from the concentrator and transported it into the column (Figures S1 and S2) and then into the detector (Figures S1 and S3). We usually used the following gas chromatographic conditions during experiments: carrier-gas–argon, high purity (argon volume fraction, minimum 99.998%, TU 6-21-12-94), carrier-gas flowrate through the column 50–60 ml/min; column temperature, 171°C–174°C. With this mode of the EKHO-M operation the time of the lindane insecticide (C6H6Cl6) retention does not exceed 15 s and LOD is 3 pg.
Each point in the presented data sets was chromatographically measured at least three times. Data are displayed as averages with an error bar (error bars correspond to the standard deviation, 1σ).
2.3. Chemicals, materials
The Research Institute of Special Technologies and Communications, MIA, Russia, Novosibirsk provided samples of technical RDX. RDX was twice recrystallized before use. Distilled water was prepared for home consumption by the institute services. LLC REACHIM, Russia provided solvents: hexane (reagent grade, TU 2631-003-05807999-98, impurities as many as 10−2%), acetone (high purity, TU 2633-032-78119972-11, impurities as many as 10−5%). We used a stainless-steel foil (12X18H10T, 0.3 mm thick), silicate glass (TU 9464-012-52876859-2014) 1 mm thick smooth and frosted, writing paper with a density of 65 g/m2 (GOST18510-87), a paper filter (TU 6-09-1678-95), fancy leather (GOST15091-80), and white cotton fabric (GOST29298-2005) with a density of 125 g/m2 as a substrate material. All the above-mentioned materials we bought at retail shops, Novosibirsk.
3. Results and discussion
3.1. Choice of optimal experiment conditions
3.1.1. Determination of the limit of the RDX detection with the EKHO-M chromatograph
First, we evaluated the limit of the RDX detection with the EKHO-M chromatograph. To do this, we determined the relationship between the RDX signal and the amount of the sample deposited on the concentrator within the range of 2–5 ng. Using a microsyringe, we deposited on the concentrator different amounts of the RDX solution in acetone with a concentration of 1 × 10⁻⁶ g/ml and injected samples into the chromatograph following the acetone evaporation. gives a chromatogram of 2 ng of RDX. The insert on the shows a value of a noise signal of the EKHO-M at the place where the RDX peak emerges, Unois =0.029 V. We did not determine the area of the peak, since the shape of the peak did not change in our experiments. Measurement of peak amplitude gives acceptable accuracy.
Figure 2. Chromatogram of 0.2 × 10⁻⁸g of RDX deposited on the grid concentrator of the EKHO-M from acetone solution. 1 – RDX, 2 – acetone with no sample. The insert shows a value of a background signal where the RDX peak escapes.
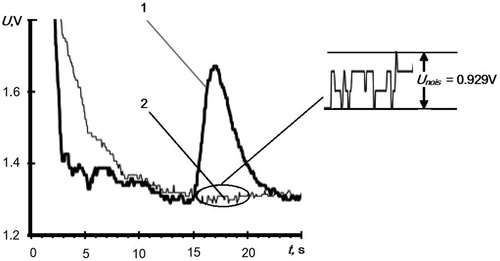
The relationship between the amplitude of the RDX peak and the amount of the sample deposited on the concentrator () is linear. To determine the minimum detectable signal, ULOD (i.e. the sensitivity of the GC), we use the value Unois and assume that the signal is detected, if signal to noise (S/N) ratio is three: ULOD = 3×Unois = 0.087 V.
Figure 3. RDX peak amplitude versus the amount of the sample deposited on the concentrator. Dotted line shows minimum detectable signal ULOD = 3×Unois = 0.087 V.
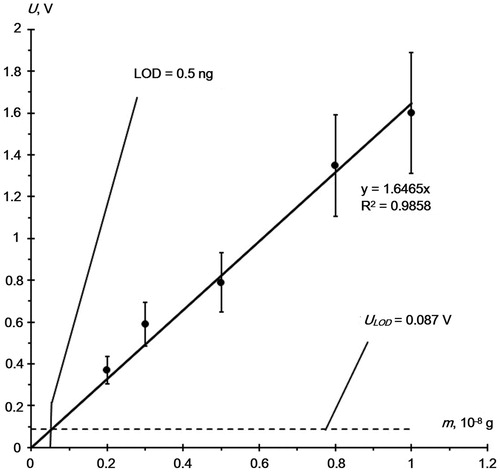
Thus, the limiting detection of RDX using an EKHO-M chromatograph when the sample was introduced onto the concentrator was 0.5 ng.
3.1.2. Choice of gas-dynamic and special experiment parameters
Experimental scheme on the RDX desorption from the surface is given on . An outlet nebulizer capillary was set at angle, α, to the surface with deposited RDX at height, h, so that the flow leaving the nebulizer reached the center of the spot with the sample. We collected samples on a grid concentrator of the EKHO-M placed along the spray flow at angle, β and distance, L, from the surface. The graphs showing the change in the RDX signal with different parameters are shown in the SI (Figures S4 and S5). Working values of spatial (α, h, β, L) and gas-dynamic (flowrates of spray gas [Qg] and solvent [Qs]) parameters we obtained experimentally considering a maximum of the RDX signal (U). We used a substrate of smooth glass 25 × 50 mm in size 1 mm thick and acetone as a solvent in experiments. gives the best values of spatial and gas-dynamic parameters. We have optimized the parameters of the experiment, using a smooth glass as a substrate. For other substrates, the optimal parameters can vary. For instance, it seems that if the surface of the substrate is rougher, it is necessary to increase the speed of the aerosol to desorb RDX from the surface. However, the available gas pressure limits the speed of the aerosol in our experiments. Changing other optimal parameters depending on the substrate is not so critical (see, e.g., Venter et al. Citation2010).
Table 1. Working values of spatial and gas-dynamic parameters.
We chose distances h and L basing on a maximum proximity of the spray capillary and sample-collecting concentrator to the surface of interest.
We varied angle of incidence, α, in the range 10–70°. U maximally and practically does not display changes from α, in the range of 10–40°. A further increase in α to 60° leads to a sharp drop of U by an order of magnitude, which we believe to be due to greater losses in sample caused by an angular redistribution of the surface-reflected spray flow. Based on the experimental results, the working value of the angle of incidence, α, was chosen equal to 30°. Effective angle of sample collection, β, was 0–5°.
A working value of gas flowrate Qg = 7 – 8 l/min we chose such that the velocity of the spray gas (nitrogen) was 300 m/s. This value of the gas velocity near sonic speed contributes to the formation of a fine aerosol with a droplet diameter of less than 5 µm in pneumatic spraying (Green and Lane Citation1964), which, in our opinion, is the best choice for carrying out experiments on the desorption of RDX from different substrates. Experiments on explosive trace desorption from hands using a flow of pure nitrogen fed with a velocity of 300 m/s (Chen et al. Citation2009), indirectly confirm this. A working value of solvent flowrate, Qs, is individual for each type of the solvent and is tested separately. gives Qs for acetone. Here, it should be noted that in the absence of an aerosol (Q = 0), we were unable to obtain the RDX signal from any surface for any gas flow Qg.
3.2. RDX desorption with different solvents
To study the effect of the solvent type on the efficiency of the RDX desorption, we chose solvents of different polarity usually used in chemical synthesis: water, acetone, hexane. Of nonpolar solvents, we used also pentane in the nebulizer. However, because of a low-boiling point of pentane (36°C), we failed to obtain stable experimental results on the RDX desorption. Solvent properties were taken from references (Orlova Citation1960; Lide Citation1992) and are given in (see the SI).
As a surface, we used smooth glass on which we deposited 1 × 10⁻⁷ g of RDX. A sample spot diameter was 5–7 mm. An amplitude of chromatographic RDX signal, U, served as a parameter of the RDX desorption efficiency. To define the solvent work flow, Qs, corresponding to the maximum value of U, we determined the U(Qs) relationship. gives the experimental results. gives the values of the solvent flowrates corresponding to the maximum RDX signal and the maximum efficiency of the RDX desorption.
Figure 4. RDX signal versus the flowrate of the spray solvent upon desorption from the smooth glass surface.
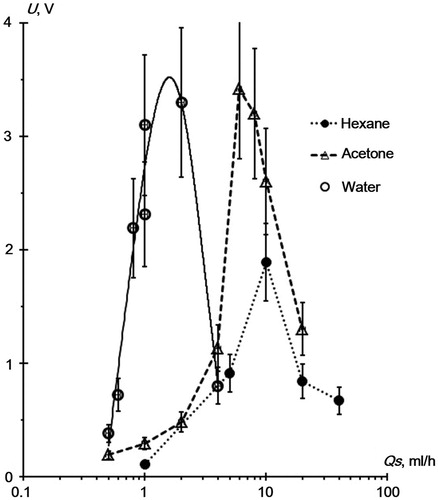
Table 2. Solvent flowrate upon spray corresponding to the maximum RDX signal.
When considering the experimental results of and , following should be noted: there is a well-defined maximum found in dependence U (Qs) for all solvents. That is, each solvent with the given flowrate of the spray gas has its own best value of the solvent consumption providing the maximum efficiency of the RDX desorption from the substrate surface. Water appears to be the most efficient solvent showing a high efficiency of the RDX desorption (U[max] = 3.2 V, that is 1.5 times higher than for hexane (U[max] = 1.9V)) with minimal flowrates (Qs[work] = 1.5 ml/h), whereas acetone requires a flowrate of Qs(work) = 6 ml/h. As for hexane, Qs[work] = 10 ml/h. We think that the U(Qs) relationship of is closely connected with the mechanism of the RDX desorption from the surface and with this, some assumptions can be made about this problem.
No continuous sample layer produces at the surface when small amount of the sample is deposited on the substrate (in our case, 10−7 g of RDX over an area ∼30 mm2). In this case, interaction of the RDX molecules and the surface is described by the known mechanisms of physical adsorption (Berozkin Citation2013) when a RDX molecule is held at the surface by nonspecific Van der Waals forces. (see the SI) gives an energy scheme of such an interaction. RDX molecule kept by the surface resides in a potential well which depth is usually Eb ∼ 0.1–0.3 eV. To desorb the RDX molecule from the surface, it is enough to apply to it energy equal or exceeding Eb.
We think that the main desorption mechanism in our experiments is the transmission of mechanical energy of aerosol particles bombarding the surface to the RDX molecules. Aerosol particles produced in the nebulizer been carried away by a high-speed gas flow acquire a rather high kinetic energy. Thus, aerosol particles 0.01–0.1 µm in diameter accelerating to a speed of 300 m/s acquire energy of ∼102–105 eV. This energy is enough to desorb more than one RDX molecule. The coaxial nebulizer used to create the aerosol, at a gas velocity close to sound speed, produces a mostly fine aerosol, with a droplet diameter <5 µm. In particular, W. Lane investigating the decay of water droplets in an air stream, showed that at a relative velocity of drops and air equal to the sound speed, droplets with a diameter of ≥5 µm disintegrate (Green and Lane Citation1964, 39.). As is known, the finer the particles, the more they tend to stick together and to adhesion to smooth hard surfaces. Adhesion is partly explained by the action of the London – van der Waals forces. These forces are very small and decrease in proportion to the seventh power of the distance between molecules, but can have a noticeable value between two small particles containing millions of molecules. The role of molecular forces with a decrease in particle diameter (d) increases, with a tendency to coalescence of the particles. This is due to the fact that the forces of attraction between the particles are proportional to d, and the forces striving to separate the particles are usually proportional to d3 (during oscillations) or d2 (aerodynamic forces). It follows that fine particles are difficult to separate from each other, in contrast to large ones (Green and Lane Citation1964, 54.). It is reasonable to assume that such small aerosol particles, due to high activity, will also effectively capture adsorbed on the surface of the RDX molecule.
Taking into account that in addition to the van der Waals dispersion forces, other forces (such as electrostatic forces, capillary forces, and chemical interactions) participate in the desorption/adsorption process, the desorption mechanism requires further study. Experimental data obtained show that solubility of RDX in the solution spray has a negligible effect on the process RDX desorption. Despite of the fact that the RDX solubility in water is 100 times less than that in acetone (see in the SI), the efficiency of the RDX desorption with their use as a spray liquid is almost the same (see the values of chromatographic signal, U[max], ). As evident from the experiments, the efficiency of the RDX desorption with hexane as a solvent is about two times less than that with water and acetone ( and ). This is consistent with previous studies (Zakon et al. Citation2012), where it is clearly shown that the presence of –OH, –phenyl, and –NH2 end groups leads to an increase in the adsorption force due to the chemical interaction. In addition, the influence of electrostatic forces cannot be excluded, since the resulting aerosol flow is bipolar electrically charged. As shown in our previous paper (Pervukhin, Sheven, and Kolomiets Citation2015), total ion current of positive or negatives charges produced by water and acetone spray is 104 times as large as for hexane spray, which is attributable to a significant difference in polarity of these solvents (the dipole moment of water and acetone is tens of times as large as for hexane (see in the SI). The electromagnetic interaction of the electrically charged droplet and RDX can enhance RDX desorption from the surface. We emphasize once again that all these mechanisms require further theoretical and experimental studies.
Nevertheless, irrespective of the desorption mechanism, the RDX molecules desorbed by the aerosol are captured by a gas stream and delivered to a concentrator for chromatographic analysis.
In our opinion, a pronounced peak in the U(Qs) relationship () can be explained by two processes: (1) a growth of the particle population in the aerosol plume with an increase of solvent flowrate, Qs and (2) the production of a solvent film at the substrate surface that covers the surface and prevents desorption of RDX. The solvent evaporation significantly affects these processes. If the solvent flowrate is low, the population of particles in the aerosol plume is small, no continuous solvent film produces at the surface, and we observe an enhanced efficiency of the RDX desorption as Qs grows (i.e., U signal increases as the number of aerosol particles increases, ). With a further increase of Qs, a continuous thin film covering the surface and preventing the RDX desorption by aerosol particles begins to produce at the surface. Here, the desorption efficiency begins to reduce, and the chromatographic signal U(Qs) decreases, as we observe in the experiment (). In this case, a value of solvent flowrate (Qs[work]) corresponding to the maximum efficiency of the RDX desorption depends on the intensity of the solvent evaporation. The higher is a rate of the solvent evaporation, the larger are its losses upon spray and the greater is the value of Qs(work). Water possessing the lowest evaporation rate among the solvents used (specific heat of evaporation, 2,256 kJ/kg, see in the SI), displays the lowest value of Qs(work) ∼ 1.5 mL/h.
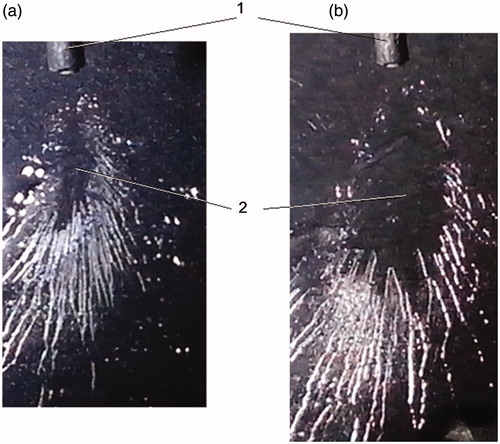
shows a picture of an aerosol plume that produces on glass upon the RDX desorption using water aerosol with two water flowrates: (1) Qs = 2 mL/h (corresponds to the maximum efficiency of the RDX desorption) and (2) Qs = 4 mL/h when a heavy decrease of chromatographic signal, U(Qs), is observed. Reference number 2 of the denotes a region of continuous solvent film (a dark region in the middle part of the aerosol plume). As the suggests continuous water film produced on glass with water flowrate Qs = 4 mL/h, is of a larger surface area than it is with flowrate, Qs = 2 mL/h and almost completely covers a desorption region.
Figure 5. Picture of an aerosol plume interacting with the surface upon the RDX desorption from the glass surface by water aerosol. (a) Qs = 2 mL/h, (b) Qs = 4 mL/h. 1 – nebulizer nozzle, 2 – region of continuous solvent film. (Nebulizer nozzle (1) of 2 mm defines an image scale.)
3.3. Desorption of RDX from different surfaces
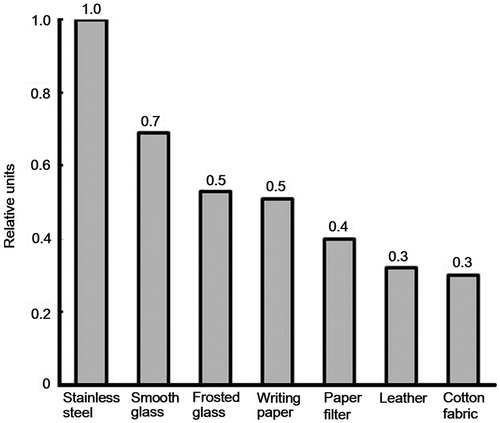
We studied the RDX desorption from different substrates to evaluate serviceability of the method. We used acetone as a spray solution. shows the curve of the RDX signal in relative units upon RDX desorption from different substrates. The amount of RDX sample deposited was 1 × 10⁻⁷ g, the same for all substrates. As the diagram () suggests, we obtained the maximum efficiency of the RDX desorption with a stainless-steel foil and the minimal one with a cotton fabric. It should be mentioned therewith that the substrates with a smooth surface (stainless steel, smooth glass) provide the RDX desorption that is 1.5–2 times as large as that of the substrates with a rough surface (frosted glass, writing paper). One might assume that auxiliary absorption centers found at the rough surface that can hinder the RDX desorption with the spray aerosol are responsible for this. We note that both roughness of the substrate and its composition are important, since they change the adhesion force of RDX to the surface (Chaffee-Cipich, Sturtevant, and Beaudoin Citation2013). Porous materials like paper filter, leather and cotton fabric exhibit a lower RDX desorption. High losses in the sample deposited caused by the penetration thereof inside the substrate can be the cause of such a low RDX desorption. As a result, a portion of the sample can no longer interact with the spray aerosol. A great difference in RDX signals for smooth glass and stainless steel stands out in obtained results. The efficiency of the RDX desorption for stainless steel is 1.4 times as large as that of smooth glass. Anomaly low energy of the RDX molecule desorption on a metal substrate can be responsible for such a behavior.
Figure 6. RDX signal upon desorption from different substrates by acetone spray.
An experiment illustrating the completeness of the RDX sample removal from smooth glass by water aerosol shows the desorption efficiency from smooth surfaces. (see the SI) gives a per unit diagram of a series of three consecutive samplings from the same sample (1 × 10⁻⁷ g RDX deposited on the smooth glass surface). A duration of each sampling was 8 s. As the diagram indicates, already the first sampling desorbs 80% of the sample from smooth glass in several seconds. Only 1% of the sample is left for a third sampling.
To appreciate the potential of the method suggested, we determined the relationship between chromatographic signal, U, obtained upon the RDX desorption from smooth glass by water aerosol and amount of deposited RDX, m. We varied the amount of the RDX sample in the range 0.5 × 10⁻⁸ – 1 × 10⁻⁷ g. gives a plot of U(m).
Figure 7. RDX peak amplitude (U) versus amount (m) of RDX deposited on the smooth glass surface. Dotted line shows minimum detectable signal, ULOD = 3×Unois = 0.18 V.
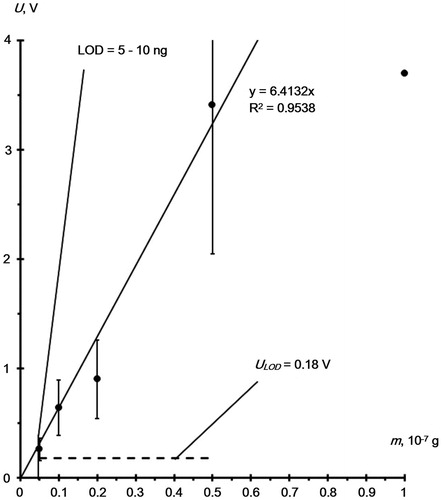
The dotted line designates minimum detectable signal, ULOD, defined by the S/N 3:1 relationship. In the experiments on the RDX detection from the substrate ULOD = 0.18 V (). This is twice the detection limit (LOD) of the RDX by the EKHO-M chromatograph (ULOD = 0.087 V, ). This result from an increase in a background signal from uncontrolled impurities. Impurities can be captured from the substrate and laboratory atmosphere by the aerosol flow and delivered to the concentrator during the sample desorption. Under these experimental conditions, the desorption of RDX from a smooth glass substrate with an aqueous aerosol allows an LOD of about 10 ng to be achieved.
It is clear that this LOD is primarily determined by the detection efficiency of the RDX by the EKHO-M chromatograph and reduced (approximately twofold) due to incomplete sample collection and the influence of impurities. Currently, surface sampling is carried out by wiping the surface using a variety of solvents (Danylewych-May and Davies Citation1992), using airflow, or, in more advanced technologies, vortex sampling (Krasnobaev and Bunker Citation2004).
Wiping the surface allows to collect about 50% of the analyte (Lim Abdullah and Miskelly Citation2010) that approximately corresponds to our results. However, the tested surface is rather large (∼100 cm2) with a concentration of ∼1 μg/100 cm2. If the target compound does not dissolve in the solvent used, the sampling efficiency decreases. Our method works even if the analyte does not dissolve in the solvent used and allows more precise determination of the location of the target compound. It should be noted that the increase adsorption of nanoparticles of a substance on the wiping material by using nanotechnology is actively studied (Jalaja et al. Citation2017), however this technology remains rather expensive. In addition, wipes and gloves used for wiping the surface can introduce contamination (Thorne et al. Citation2005). Therefore, wipes, and gloves should be carefully checked before use. Our technology, apparently, is free from this shortcoming.
With regard to vortex sampling, its attractiveness is high, since this method allows to deliver the sample for analysis without contact between the sample and the input surfaces of the analyzer. Our method also has this property. Perhaps combining these methods will be useful.
4. Conclusions
In this article, we show that desorption using sound aerosol can be a convenient way for sampling RDX (and other low-volatility compounds) followed by its detection by gas analysis. In comparison with the sampling of particles of the analyte with wiping material, the sampling suggested is easily automated and brings in fewer impurities.
Sonic flow of aerosols of the polar solvent containing –OH or = O group (water and acetone) removes easily and almost completely RDX from smooth surfaces allowing one to use to the full the sample found at the surface for gas analysis providing that the concentrator operating conditions are optimized. The situation is worse with rough and porous surfaces (as in sampling with the use of wiping material). However, our experiments show that the desorption efficiency of the target compound is only reduced by a factor of three, which is uncritical from a practical standpoint.
Finally, in this article, we do not cover many factors that can potentially affect the desorption process. For example, desorption by unipolar charged aerosol is widely used in DESI-like methods (the coaxial nebulizer used produces aerosol containing half positively and half negatively charged particles) and can affect the desorption efficiency in our approach. Variations in the aerosol particle size (i.e. the use of other methods of its generation), a change in the nature of the solvent, pH of the spray liquid and introduction of impurities to it can contribute to the desorption process. All this is the subject of our subsequent work.
Supplemental Material
Download Zip (66.2 KB)Disclosure statement
No potential conflict of interest was reported by the authors.
Additional information
Funding
Related Research Data
References
- Aspects of Explosives Detection. 2009. M. Marshall and J.C. Oxley (Editors), Copyright © 2009 Elsevier B.V. Accessed August 1, 2018. https://www.sciencedirect.com/science/book/9780123745330
- Berozkin, V. I. 2013. Introduction into physical adsorption and technology of carbon adsorbents. SPb., «Victoria plus» 409. (in Russian). Accessed on August 1, 2018. http://www.ecosafety-spb.ru/index.php?option=com_content&view=article&id=91
- Chaffee-Cipich, M. N., B. D. Sturtevant, and S. P. Beaudoin. 2013. Adhesion Of Explosives. Anal. Chem. 85 (11):5358–66.
- Chen, H., B. Hu, Y. Hu, Y. Huan, Z. Zhou, and X. L. Qiao. 2009. Neutral Desorption using a Sealed Enclosure to Sample Explosives on Human Skin for Rapid Setection by EESI-MS. J. Am. Soc. Mass Spectrom. 20 (4):719–22.
- Chen, H., J. Zheng, X. Zhang, M. B. Luo, Z. C. Wang, and X. L. Qiao. 2007. Surface Desorption Atmospheric Pressure Chemical Ionization Mass Spectrometry for Direct Ambient Sample Analysis without Toxic Chemical Contamination. J. Mass Spectrom. 42 (8):1045–56.
- Cody, R. B., J. A. Laramée, and H. D. Durst. 2005. Versatile New Ion Source for the Analysis of Materials in Open Air Under Ambient Conditions. Anal. Chem. 77 (8):2297–302.
- Costa, A. B., and R. G. Cooks. 2008. Simulated Splashes: Elucidating the Mechanism of Desorption Electrospray Ionization Mass Spectrometry. Chem. Phys. Lett. 464 (1–3):1–8.
- Cotte-Rodríguez, I., and R. G. Cooks. 2006. Non-Proximate Detection of Explosives and Chemical Warfare Agent Simulants by Desorption Electrospray Ionization Mass Spectrometry. Chem. Commun. 28 (28):2968–2970.
- Cotte-Rodriguez, I., Z. Takats, N. Talaty, H. W. Chen, and R. G. Cooks. 2005. Desorption Electrospray Ionization of Explosives on Surfaces: Sensitivity and Selectivity Enhancement by Reactive Desorption Electrospray Ionization. Anal. Chem. 77:6755–64.
- Danylewych-May, L. L., and J. H. Davies. 1992. Method for detecting explosives and other substances in samples of ground material. Canadian Patent Application. CA 2043825 AA 19921205.
- González-Méndez, R., D. F. Reich, S. J. Mullock, C. A. Corlett, and C. A. Mayhew. 2015. Development and Use of a Thermal Desorption Unit and Proton Transfer Reaction Mass Spectrometry for Trace Explosive Detection: Determination of the Instrumental Limits of Detection and an Investigation of Memory Effects. Int. J. Mass Spectrom. 385:13–8.
- Green, H., and W. Lane. 1964. Particulate clouds: Dusts, smokes and mists. 2nd ed. London: E. & F. N. Spon.
- Groom, C. A., S. Beaudet, A. Halasz, T. L. Paque, and J. Hawari. 2001. Detection of the Cyclic Nitramine Explosives Hexahydro-1,3,5-trinitro-1,3,5-triazine (RDX) and Octahydro-1,3,5,7-tetranitro-1,3,5,7-tetrazine (HMX) and their Degradation Products in Soil Environments. J. Chromatogr. A 909 (1):53–60.
- Hajialigol, S., S. A. Ghorashi, A. H. Alinoori, A. Torabpour, and M. Azimi. 2012. Thermal Solid Sample Introduction-fast Gas Chromatography-low Flow Ion Mobility Spectrometry as a Field Screening Detection System. J. Chromatogr. A 1268:123–29.
- Jalaja, K., S. Bhuvaneswari, G. Manjunatha, R. Divyamol, S. Anup, C. Jobin, and K. G. Benny. 2017. Effective SERS Detection using a Flexible Wiping Substrate Based on Electrospun Polystyrene Nanofibers. Anal. Methods 9 (26):3998–4003.
- Justes, D. R., N. Talaty, I. Cotte-Rodriguez, and R. G. Cooks. 2007. Detection of Explosives on Skin Using Ambient Ionization Mass Spectrometry. Chem. Commun. 21:2142–44.
- Krasnobaev, L. Y., and S. N. Bunker. 2004. Virtual wall gas sampling for an ion mobility spectrometer. U.S. Pat. Appl. Publ. Cont.-in-part of U.S. Ser. No. 295,010. US 2004155181 A1 20040812.
- Lide, D. R. 1992. CRC handbook of chemistry and physics. 73rd ed. Boca Raton, FL: CRC Press.
- Lim Abdullah, A. F., and G. M. Miskelly. 2010. Recoveries of Trace Pseudoephedrine and Methamphetamine Residues from Impermeable Household Surfaces: Implications for Sampling Methods used During Remediation of Clandestine Methamphetamine Laboratories. Talanta 81 (1–2):455–61.
- Liu, L., and B. W. Pack. 2007. Cleaning Verification Assays for Highly Potent Compounds by High Performance Liquid Chromatography Mass Spectrometry: Strategy, Validation, and Long-term Performance. J. Pharm. Biomed. Anal. 43 (4):1206–12.
- Monge, M. E., G. A. Harris, P. Dwivedi, and F. M. Fernández. 2013. Mass Spectrometry: Recent Advances in Direct Open Air Surface Sampling/Ionization. Chem. Rev. 113 (4):2269–308.
- Moore, D. S. 2004. Instrumentation for Trace Detection of High Explosives. Rev. Sci. Instrum. 75 (8):2499–512.
- Orlova, E. Y. 1960. Chemistry and Technologies of High Explosives. M., Oborongiz 271. (in Russian). Accessed on August 1, 2018. http://bookfi.net/book/469470
- Pervukhin, V. V., D. G. Sheven, and Y. N. Kolomiets. 2015. Ionization of Solutions Using Mechanical Spray in Collison Nebulizer: A New Simple Ion Source for Mass-spectrometric Analysis. Talanta 138:123–9.
- Petucci, C., J. Diffendal, D. Kaufman, B. Mekonnen, G. Terefenko, and B. Musselman. 2007. Direct Analysis in Real Time for Reaction Monitoring in Drug Discovery. Anal. Chem. 79 (13):5064–70.
- Takáts, Z., I. Cotte-Rodriguez, N. Talaty, H. W. Chen, and R. G. Cooks. 2005. Direct, Trace Level Detection of Explosives on Ambient Surfaces by Desorption Electrospray Ionization Mass Spectrometry. Chem. Commun. 15:1950–52.
- Thorne, P. S., N. Metwali, E. Avol, and R. S. McConnell. 2005. Surface Sampling for Endotoxin Assessment Using Electrostatic Wiping Cloths. Ann. Occup. Hyg. 49 (5):401–6.
- Venter, A. R., A. Kamali, S. Jain, and S. Bairu. 2010. Surface Sampling by Spray-desorption Followed by Collection for Chemical Analysis. Anal. Chem. 82 (5):1674–9.
- Waddell, R., D. E. Dale, M. Monagle, and S. A. Smith. 2005. Determination of Nitroaromatic and Nitramine Explosives from a PTFE Wipe Using Thermal Desorption-gas Chromatography with Electron-capture Detection. J. Chromatogr. A 1062 (1):125–31.
- Zakon, Y., N. G. Lemcoff, A. Marmur, and Y. J. Zeiri. 2012. Adhesion of Standard Explosive Particles to Model Surfaces. Phys. Chem. C 116 (43):22815–22.
- Zalewska, A., W. Pawłowski, and W. Tomaszewski. 2013. Limits of Detection of Explosives as Determined with IMS and Field Asymmetric IMS Vapour Detectors. Forensic Sci. Int. 226 (1–3):168–72.