
Abstract
The physical and chemical properties as well as the oxidative potential (OP) of water soluble components of coal combustion fine particles were examined. A laboratory-scale pulverized-coal burning system was used to produce coal combustion particles at different burning temperatures of 550 °C, 700 °C, 900 °C, and 1,100 °C. Few studies have reported the effects of burning temperature on both the chemistry and toxicity of coal combustion particles. The highest mass emission factor of particulate matter less than 2.5 µm (PM2.5) was found to be produced at 700 °C (3.51 g/kg), owing to strong elemental carbon (EC) emission and ash formation (ions and elements) resulting from the incomplete combustion of tar and char, and mineral fragmentation. The highest organic carbon in PM2.5 was found at 550 °C. At a temperature higher than 700 °C, the fraction of carbonaceous species decreased while the fractions of ions and elements increased owing to ash formation. Sulfate was found to be the dominant ionic species, followed by sodium, calcium, and magnesium. The highest emission of elements (Al, As, Ba, Cd, Co, Cu, Fe, Mn, Ni, Pb, Sr, Ti, V, and Zn) and the highest fractions of Fe and Al were observed at 700 °C. Intrinsic OP activities obtained from dithiothreitol (DTT) and electron spin resonance (ESR) assays showed the highest values at 550 °C, suggesting that fine particles from low-temperature coal combustion had the highest reactive oxygen species generation capability (potentially toxic) among various tested burning temperatures. The results of principal component analysis suggested a correlation between OP-DTT activity and OC, EC, Cd, Co, V, and Zn, while OP-ESR activity was associated with chloride, nitrate, Ba, Pb, Sr, and Ti.
© 2018 American Association for Aerosol Research
EDITOR:
Introduction
Fine particles in the ambient atmosphere are of current interest because of their effects on human health (Dockery and Pope Citation1994; Peters et al. Citation1997; Kelly and Fussell Citation2016; Weber et al. Citation2016), visibility impairment (Watson Citation2002; Cao et al. Citation2012), and climate change (IPCC Citation2014). The combustion of fossil fuels or biomasses is a major source of particulate matter less than 2.5 μm (PM2.5). Coal is the most abundant fossil fuel on Earth (Makino and Matsuda Citation2002; World Energy Council Citation2013) and its wide use in the generation of electricity accounts for around 40% of global electricity production (World Energy Council Citation2013) and more than 70% and 35% of electricity production in China (Biswas, Wang, and An Citation2011; Wang et al. Citation2013) and Korea (Shim and Seo Citation2013), respectively. Moreover, coal is used for residential heating in China and Mongolia (Zhang et al. Citation2008; Wang et al. Citation2011; Batjargal et al. Citation2010; Shen et al. Citation2010; Batmunkh et al. Citation2013). Coal combustion can generate a significant fraction of fine particles with possible adverse health effects (Zhi et al. Citation2008; Li et al. Citation2016b). It is therefore essential to determine the physicochemical and toxicological properties of coal combustion particles in order to understand their contributions to ambient PM2.5 and the effects on human health.
The physical and chemical properties of coal combustion particles depend on coal combustion conditions (burning temperature, combustion efficiency, residence time, and air-fuel ratio), coal properties, and coal rank (Solomon, Fletcher, and Pugmire Citation1993; Oros and Simoneit Citation2000; Yoo et al. Citation2006; Zhang et al. Citation2008; Popescu and Ionel Citation2010; Shen et al. Citation2012; Wang et al. Citation2013; Li et al. Citation2016b; Wang et al. Citation2016b). Various burning temperatures in the coal combustion process lead to different types of emitted particles (Dacombe et al. Citation1999; Zhang et al. Citation2008; Li et al. Citation2016b; Wang et al. Citation2016b; Zhou et al. Citation2016). The burning temperatures in residential coal combustion range from 200 °C to 1,100 °C and increase up to 1,700 °C in industrial coal combustion (Raask Citation1985; Zhang et al. Citation2008; Zhi et al. Citation2008; Li et al. Citation2016b). In the early stage of combustion, coal suffers from thermal stress caused by heating, and its surface and inner area are thereby fractured into small fragments (Li et al. Citation2016a). In addition, volatile matter is released onto the surface of coal, forming tar and subsequently burning out, and the remaining char is later oxidized. Thus, owing to multiple coal burning steps, the fine particles produced from coal combustion contain various carbonaceous species (Streets et al. Citation2003; Cao, Zhang, and Zheng Citation2006; Ohara et al. Citation2007) and minor and trace elements (Zhang and Tao Citation2009; Shen et al. Citation2012). Submicrometer ash particles containing S, Hg, B, Br, Cl, F, I, and Se are mainly formed from inorganic vapors by a condensation process, while super-micrometer ash (fly ash) particles containing Al, Ba, Cu, Co, Fe, Mn, Ni, Si, Ti, V, and Zn are produced by mineral fragmentation during the burnout of char (Taylor and Flagan Citation1981; Lind et al. Citation1996; Hammond Citation2003; Seames Citation2003).
A few toxicity studies related to coal combustion particles have been reported. According to these studies, ultrafine coal fly ash particles caused higher inflammation and cytokine levels than coarse particles (Gilmour et al. Citation2004). The types of coal also affected the toxicity of coal combustion particles. Coal with higher volatile matter contributed to higher toxicity (cytotoxicity and global DNA methylation) in coal combustion particles produced by residential stoves (Wang et al. Citation2016a). Hydroxyl radical generation of coal combustion particles collected from the chimney of coal power plant was much higher than total suspended particles in the ambient atmosphere (Wang et al. Citation2018). However, the effects of coal burning temperature on both the chemistry and toxicity of coal combustion particles have not been adequately reported.
Various redox active compounds present in coal are capable of producing reactive oxygen species (ROS); these in turn are capable of causing a number of adverse health effects in humans, for instance the initiation of inflammatory cascades and continuous stimulation can cause oxidative stress and cellular damage such as protein oxidation, DNA damage or alteration, and apoptosis (Hensley et al. Citation2000; Philip, Rowley, and Schreiber Citation2004; Tuet et al. Citation2016).
In this study, a laboratory-scale pulverized-coal combustion system was constructed to generate fine particles from coal combustion at different burning temperatures (550–1,100 °C). The physical (mass concentration and size distribution) and chemical properties (ionic species, elements, elemental carbon [EC], organic carbon [OC], and organic compounds) of these particles were measured at different burning temperatures. Further, the oxidative potential (OP) of the coal combustion particles, which is the ability to generate ROS, was measured using two different types of OP assays—dithiothreitol (DTT) chemical assay and electron spin resonance (ESR) spectrometry—to assess the water-soluble ROS activity of these particles. Two types of OP assays were used in this study because each assay is sensitive to different ROS-generating compounds (OP-DTT for quinones and OP-ESR for transition metal ions) (Charrier and Anastasio Citation2012; Yang et al. Citation2014). Both assays can be used as complementary OP analyses for coal combustion particles comprising various carbonaceous species and metals.
Experimental methods
A schematic of the experimental setup is shown in . A bench-scale high-temperature furnace (Lindberg/Blue M, Model HTF55342C, Thermo Electron Corp., Franklin, MA, USA) (Yoo et al. Citation2006; Wang et al. Citation2013) with a quartz tube 70 mm in diameter and 1,200 mm in length was used for the coal combustion. The temperature was controlled by silicon heating elements surrounding the tube and was measured at the tube wall in the middle of the heated zone. Various temperatures, that is, 550 °C, 700 °C, 900 °C, and 1,100 °C, were tested. The laminar flow condition without burning coal provided the maximum temperature difference between the tube wall and the center of the tube to within 50 °C for the tube (70 mm diameter) employed here (Bejarano and Levendis Citation2008). The coal burning process in the tube was found to generate heat affecting the wall temperature, which increased between 0 °C and 3 °C. Cool water was circulated into both ends of the tube to protect the o-ring seals. Bituminous coal obtained from a coal power plant (Korea South Power Co. Ltd., Hadong, Korea) was used to generate coal combustion particles. The coal was pulverized and sieved using a 200-mesh (less than 75 µm) sieve before being burned. It has been reported that bituminous coal consists of fixed carbon (53%), volatile matter (30%), ash (14%), and water content (4%) (Kim et al. Citation2016). The pulverized coal was fed into a quartz tube using a solid aerosol generator (Model SAG 410, Topas GmbH, Dresden, Germany) at a feeding rate of 3.5 g/h. The flow rate through the furnace tube was 5.3 L/min, and the residence time of the particles in the tube furnace reactor was around 37 s at room temperature. The coal combustion particles exiting the furnace were diluted for filter sampling at a dilution ratio of 3 and were further diluted (×100) by an aerosol diluter (Model 3302A, TSI, Inc., St. Paul, MN, USA) for online aerosol measurements. Leak tests and correction for the loss of particles transported through the generation system were conducted at operating temperatures.
Figure 1. Schematic of the experimental setup.
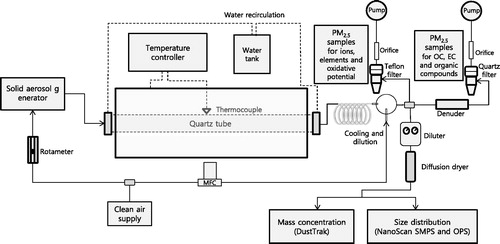
The online number size distribution of the coal combustion particles was measured using a nanoscan scanning mobility particle sizer (NanoScan SMPS) (Model 3910, TSI, Inc.) (10–420 nm) and an optical particle sizer (OPS) (Model 3330, TSI Inc.) (0.3–10 μm). A multi-instrument manager software (MIM 2.1, TSI Inc.) was used to merge two number size distributions measured with the NanoScan SMPS and OPS. The 30 min average number size distributions from the NanoScan SMPS and OPS (24 data) were used at different burning temperatures. The online PM2.5 mass concentration was measured with a Dust Trak (Model DRX, TSI Inc.).
Teflon and quartz filters were used to collect PM to determine the mass concentration, ionic species, elements, carbonaceous species, and OP for water soluble components (i.e. water soluble OP) of PM2.5. 2–7 filter samples were used to obtain average chemical and OP data including their standard errors.
The PM2.5 on a Teflon filter was extracted in 20 mL of deionized (DI) water with sonication for 1 h and shaking for 3 h. The extract was filtered through a polytetrafluoroethylene (PTFE) syringe filter. Eight ionic species—chloride Cl–, nitrate (NO3–), sulfate (SO42–), ammonium (NH4+), calcium (Ca2+), magnesium (Mg2+), potassium (K+), and sodium (Na+)—were determined using ion chromatography (IC) (850 Professional IC, Metrohm, Switzerland). For the determination of elements, the filtered extract was digested with HNO3 and HCl (3:1) and was concentrated in 0.5 mL using a microwave digester (Ethos 1600, Milestone, Shelton, CT, USA). The concentrated sample was reconstituted to 10 mL with a 2% HNO3 solution, and the sample was introduced to an inductively coupled plasma mass spectrometer (ICP-MS) (7500CE, Agilent Technologies, Wilmington, DE, USA) to determine the elements: Al, As, Ba, Cd, Co, Cu, Fe, Mn, Ni, Pb, Sr, Ti, V, and Zn (Saxena et al. Citation2017; Lee et al. Citation2018).
A quartz filter with a multichannel parallel-plate denuder was used to collect PM2.5 to determine the OC and EC. It was applied directly to the thermal-optical OC–EC analyzer (Sunset Laboratory, Inc., Forest Grove, OR, USA) to determine the mass concentrations of the OC and EC. An additional quartz filter was used to determine the organic compound groups. The PM2.5 on a quartz filter was extracted in a mixture of dichloromethane (DCM) and methanol (3:1) with sonication for 1 h, and four individual organic compound groups—polycyclic aromatic hydrocarbons (PAHs), hopanes, n-alkanes, and n-alkanoic acids—were analyzed by gas chromatography–mass spectrometry (7890A GC, 5975C MSD, Agilent Technologies) (Chang et al. Citation2017).
For determination of the OP, a sample obtained using a Teflon filter was extracted in 5 mL of DI water by sonication for 1 h, and the extracted solution was filtered by a 0.45 μm PTFE filter to eliminate insoluble materials. Two and a half milliliters of the solution was used to determine the OP by a DTT assay (OP-DTT), and the rest of the solution was used to determine the OP by an ESR assay (OP-ESR). The details of the OP analysis can be found elsewhere in the literature (Hellack et al. Citation2014; Bates et al. Citation2015; Fang et al. Citation2015; Yang et al. Citation2015). In brief, a mixture of 17.5 mL of the sample, 5 mL of a 50 mM potassium phosphate buffer, and 2.5 mL of 5 mM DTT were reacted in a shaking incubator at 37 °C and 150 rpm (reaction step). In the determination step, a 1 mL aliquot of the incubated mixture was periodically sampled at intervals of 5, 15, 25, 35, and 45 min and transferred to a reaction vial containing 2 mL of 1% trichloroacetic acid, 4 mL of 0.08 M tris buffer with 4 mM ethylendiaminetetraacetate (EDTA), and 1 mL of 1 mM 5,5-dithiobis-2-nitrobenzoic acid (DTNB). The absorbance of the samples was detected by an ultraviolet–visible light (UV-VIS) spectrophotometer (Model UV-1800, Shimadzu, Kyoto, Japan) at a wavelength of 412 nm. The OP-DTT activity was defined as the DTT consumption rate, which was calculated using a linear regression between the absorbance and the time (pmol/min). DI water and a 9,10-phenanthraquinone (PQN) solution were used for the negative and positive controls, respectively (Yang et al. Citation2014; Fang et al. Citation2015). To determine the OP-ESR, 100 µL of sample extracts, 200 µL of 0.05 M 5,5-dimethyl-1-pyrroline-N-oxide (DMPO), and 100 µL of 0.5 M H2O2 (at a ratio of 1:2:1) were placed in an Eppendorf tube (0.5 mL). After incubation at 37 °C and 200 rpm for 15 min, the mixture in the Eppendorf tube was transferred into a glass capillary (50 µL) tube to measure the hydroxyl radical (DMPO-OH) signals using an ESR spectrometer (JES-FA2000, JEOL Ltd., Tokyo, Japan). The OP-ESR activity was defined as the average of the amplitudes of the DMPO-OH quartet signals generated from the ESR spectrometer (arbitrary units). A copper sulfate (1, 5, and 10 µM of CuSO4) solution was used as a positive control, and DI water was used as a negative control (Hellack et al. Citation2014; Yang et al. Citation2014).
Results and discussion
The PM2.5 mass emission factor (EF, g/kg) from coal combustion was measured at different burning temperatures (as summarized in ). It was calculated by dividing the PM2.5 mass (g) by the amount of fuel feeding (kg) (=feeding rate [g/h] × time in the furnace [h]). The same amount of fuel feeding was used for all temperatures. Unburned coal particles present at 550 °C influenced the PM2.5 mass EF. The EF at 550 °C was not included in for comparison. Note that the PM2.5 mass EF defined here should be understood as different from the traditional EF based on the amount of burned fuel in batch-type experiments using stoves (Zhi et al. Citation2008; Zhou et al. Citation2016). The batch-type experiments enabled accurate measurement of the amount of burned fuel for determination of PM2.5 mass EF. At temperatures higher than 700 °C in this study, most of the coal particles were burned out, and the PM2.5 mass EF at 700–1,100 °C was similar to the traditional EF (batch type). The highest PM2.5 mass EF (3.51 ± 1.05 g/kg) was observed at 700 °C, where the incomplete combustion of tar and char was significant, leading to significant EC formation (Andreae and Gelencsér Citation2006). Also, significant mineral fragmentation occurred during char burning at 700 °C, resulting in ash formation (Seames Citation2003). As the burning temperature increased from 700 °C to 1,100 °C, the combustion efficiency increased, leading to lower emission of PM2.5. The combustion efficiency is defined by [CO2]/([CO] + [CO2]) (Shen et al. Citation2010, Citation2012; Li et al. Citation2016b). The CO and CO2 concentrations were not measured in this study. It was reported that a 10%–15% increase in combustion efficiency was observed when increasing temperatures from 700 °C to 1,100 °C in household stove experiments (Li et al. Citation2016b). The higher combustion efficiency was expected at the higher temperature. It was reported that the PM2.5 mass EF in residential coal combustion (i.e. at a low burning temperature) ranged from 4.6 to 19 g/kg, whereas it ranges from 0.016 to 0.1 g/kg in industrial coal combustion (i.e. at a high burning temperature) (Chen et al. Citation2005; Streets et al. Citation2001; Bond et al. Citation2002; Zhi et al. Citation2008; Zhang et al. Citation2008). Our PM2.5 mass EF was slightly lower than that reported for residential coal combustion and much higher than that for industrial coal combustion. The PM2.5 mass EF reported here was comparable to that of biomass burning (1–4 g/kg) (Janhäll, Andreae, and Pöschl Citation2010) and much higher than diesel-engine exhaust (0.02–0.1 g/kg) (Kuhns et al. Citation2004; Nickel et al. Citation2013).
Table 1. Number mean diameters, total number concentrations, PM2.5 mass EF, and number EF at different coal burning temperatures.
As summarized in and in the online supplementary information (SI), a nucleation mode less than 100 nm was responsible for the number of fine particles from coal combustion at all burning temperatures. The nucleation mode diameters were 17, 36, 58, and 41 nm at burning temperatures of 550, 700, 900, and 1,100 °C, respectively. The smallest nucleation mode diameter was found at 550 °C, suggesting that those particles were produced by nucleation with subsequent condensation by the abundant vapors released during the devolatilization process (Wang et al. Citation2013). With an increase in temperature from 550 °C to 900 °C, the nucleation mode diameter increased from 17 to 58 nm (the number mean diameter increased from 25 to 62 nm). The highest number concentration of large particles more than 300 nm was observed at 700 °C, which is consistent with the highest PM2.5 mass EF and the appearance of additional mass mode (2.2 μm) in mass size distribution, as shown in in the SI. Bimodal mass size distributions were observed at all burning temperatures, as shown in in the SI. The number EF (the total number of particles from 10 nm to 2.5 μm) ranged from 9.3 × 10¹⁴ to 3.2 × 10¹⁵ particles/kg, and the highest number EF was found at a burning temperature of 900 °C.
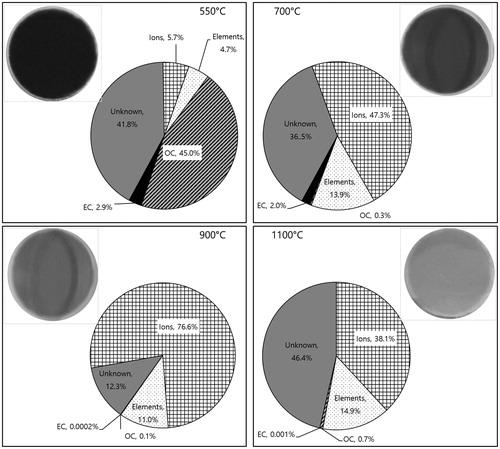
shows mass fractions of major chemical components (ions, elements, OC, and EC) in PM2.5 at different coal burning temperatures. Also included in are the colors of the samples collected on filters. The OC fraction was the highest (45%) at 550 °C. The devolatilization and incomplete combustion of volatile matter (tar) were significant at 550 °C, contributing to the formation of carbonaceous particles from organic vapors via the gas-to-particle conversion process (Chen et al. Citation2009; Wang et al. Citation2013). At 700 °C, the OC fraction decreased significantly, while the fractions of ions and elements increased, suggesting that the initial volatile matter was mostly oxidized. At 900 °C and 1,100 °C, both the OC and EC fractions disappeared (i.e. oxidized). At 900 °C, the ionic species became the most dominant fraction in PM2.5 and decreased again at 1,100 °C. It has been reported that the ionic species in PM2.5 from residential coal combustion (i.e. at a low combustion temperature) are much lower than those from industrial coal combustion (at a high combustion temperature) (Zhang et al. Citation2008). The sum of elements (Al, As, Ba, Cd, Co, Cu, Fe, Mn, Ni, Pb, Sr, Ti, V, and Zn) increased at temperatures higher than 550 °C, possibly due to ash formation. The highest emission of elements (Al, As, Ba, Cd, Co, Cu, Fe, Mn, Ni, Pb, Sr, Ti, V, and Zn) as well as the highest fractions of Fe (56%) and Al (38%) were observed at 700 °C.The residence time and excess air ratio in the furnace reactor might also affect the formation of carbonaceous and mineral/ionic particles (Dacombe et al. Citation1999; Hammond Citation2003; Wang et al. Citation2013; Gao et al. Citation2016). As shown in , the colors of the samples collected on filters were consistent with the chemical data. Black and a dark color found at 550 °C originated from the carbonaceous species (OC and EC) and unburned coal particles (Sidhu, Graham, and Striebich Citation2001; Chang et al. Citation2017). Although the chemical composition of the nucleation mode particles was not measured, we speculate that the nucleation mode particles might have originated from organic vapors during the devolatilization process, which was pronounced at 550 °C (Wang et al. Citation2013). The color changed from black to tan or yellow as the temperature increased from 550 °C to 1,100 °C, which is consistent with the tendency of the EC fraction to decrease with an increase in temperature. Sun et al. (Citation2017) reported that brown carbon (light absorbing organic carbon) emitted from residential coal combustion ranged from 0.16 to 8.59 g/kg and that bituminous coal combustion emitted a higher amount of brown carbon than anthracite coal. Brown carbon was also observed in biomass burning particles (Hegglin et al. Citation2002; Andreae and Gelencsér Citation2006; Gustafsson et al. Citation2009). Although it was not measured in this study, we can surmise it is included in the OC influencing the brownish color of the filter samples.
Figure 2. Mass fractions of ions, elements, OC, and EC in PM2.5 and the colors of the samples collected on filters at different coal burning temperatures.
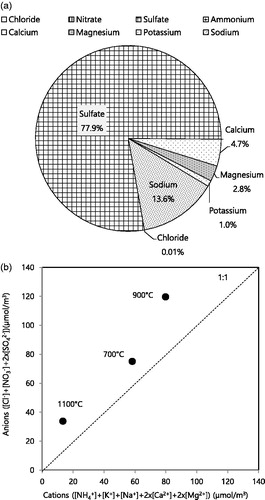
shows the mass fractions of individual ionic species at 900 °C, where the highest fraction of total ions in PM2.5 was observed. Sulfate was found to be the most dominant ionic species, followed by sodium, calcium, and magnesium. The sulfur content in coal (up to 5%) (Yoo et al. Citation2006) contributed to the formation of sulfate. Sulfur vaporization and its subsequent condensation and reaction could be the most dominant pathways for sulfate formation (40–70 wt% in submicrometer ash) (Buhre et al. Citation2005). compares the anions (Cl–, NO3–, and SO42–) and cations (NH4+, K+, Na+, Ca2+, and Mg2+) at different burning temperatures (Saxena et al. Citation2017). The ionic balance showed the deficit of cations relative to anions at elevated burning temperatures (700 °C, 900 °C, and 1,100 °C). These data cannot be used to determine the acidity of aerosols. However, it has been reported that coal combustion particles could be acidic (Hennigan et al. Citation2015; Saxena et al. Citation2017). The oxidation of pyrite sulfur, which is abundant in bituminous coal, could lead to high acidity in aerosols produced by coal combustion (Stanger and Wall Citation2011; Deng et al. Citation2015). Acidic aerosols from the coal combustion process have been of interest owing to their adverse health effects and corrosiveness in coal power plants (Raask Citation1985; Weber et al. Citation2016).
Figure 3. (a) Mass fractions of ionic species at a burning temperature of 900 °C and (b) the relationship between the sum of anions (Cl-, NO3-, and SO42-) and the sum of cations (NH4+, K+, Na+, Ca2+, and Mg2+).
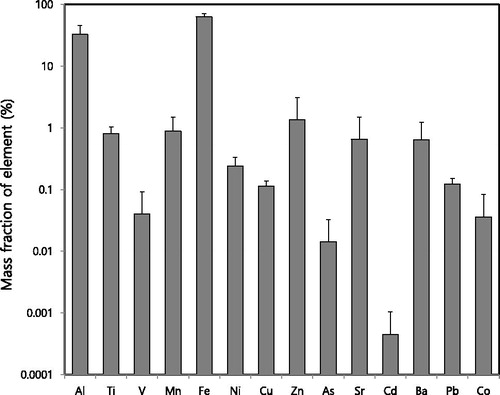
shows the mass fractions of elements (Al, As, Ba, Cd, Co, Cu, Fe, Mn, Ni, Pb, Sr, Ti, V, and Zn) at 1,100 °C, where the highest fractions of elements in PM2.5 were observed, with Fe being the highest, followed by Al, Zn, Mn, Sr, and Ba. It was reported that bituminous coal contains 0.2%–1.1% Fe, 0.7%–0.8% Al, and 1.2%–1.8% Si (Yoo et al. Citation2006). Na, K, and Ca could exist in sulfate forms in coal combustion particles (Gao et al. Citation2016). For super-micrometer ash, which is produced after char burnout, Si, Al, and Fe could exist as SiO2, Al2O3, and Fe2O3, respectively (Buhre et al. Citation2005). Unfortunately, Si was not measured in this study. It was reported that high-temperature combustion favors the formation of (Na, K, Ca)O·SiO2, Al2O3, and FeO, while relatively low-temperature combustion leads to the formation of (Na, K, Ca)SO4, SiO2, Al2O3, and Fe2O3 (Raask Citation1985).
Figure 4. Mass fractions (%) of elements at the burning temperature of 1,100 °C.
Major organic groups (PAHs, hopanes, n-alkanes, and n-alkanoic acids) were also measured at different burning temperatures as reported in our previous paper (Chang et al. Citation2017). The n-alkanes and n-alkanoic acids were detected at all temperatures. The fraction of n-alkanoic acids in OC was the highest among organic groups. The PAHs and hopanes which are water-insoluble organic carbons were detected only at a low burning temperature (550 °C). Perylene, benzo[b]fluornathene, and benzo[a, e]pyrene were the dominant PAHs in PM2.5, consistent with previous results (Zhang et al. Citation2008).
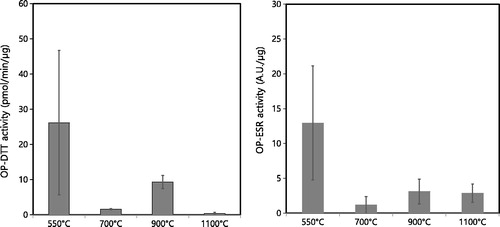
The mass-normalized OP-DTT and OP-ESR activities of coal combustion particles at different burning temperatures are shown in . The highest OP-DTT activity (pmol/min/μg) was found for particles produced at a burning temperature of 550 °C. The amounts of OC and PAHs in PM2.5 were also the highest at 550 °C, possibly contributing to the highest OP-DTT activity. The DTT assay is known to be highly sensitive to redox active compounds such as quinones and transition metal ions in particles (Charrier and Anastasio Citation2012; Yang et al. Citation2014). The correlation data suggest that the PAHs and some metals can be used as an indicator. PAHs are not redox active compounds, but they can be transformed to quinones, which significantly affect the OP-DTT (Li, Wyatt, and Kamens Citation2009; Charrier and Anastasio Citation2012). The OP-DTT activity of coal combustion particles at 550 °C was comparable to that of particles obtained by burning rice straw and pine stem (biomasses) and lower than that of diesel-engine exhaust particles, as described in our other paper (Park et al. Citation2018). The mass-normalized OP-ESR activity was also found to be the highest at 550 °C, at which the highest emissions of Co, V, and Zn were obtained. The OP-ESR is known to correlate with EC and with various elements such as Al, Br, Cu, Fe, K, Mn, and Zn (Yang et al. Citation2014). By considering the emitted PM2.5 mass concentration, the volume-normalized OP activity can also be obtained. The volume-normalized OP activities were also the highest at 550 °C, as shown in in the SI, even though the PM2.5 mass concentration was the lowest at that temperature. The analysis of variance (ANOVA) test was conducted to see if there was a significant difference in OP activity at the different temperatures, with the result that significant differences in both OP activities (p < 0.05) were found between 550 °C and 1,100 °C. Our data suggest that coal combustion particles produced at low temperatures (e.g. residential coal combustion) should have high potential for ROS generation, which could hold adverse health implications.
Figure 5. OP-DTT and OP-ESR activities (i.e., mass-normalized intrinsic OP activities) of coal combustion particles at different burning temperatures.
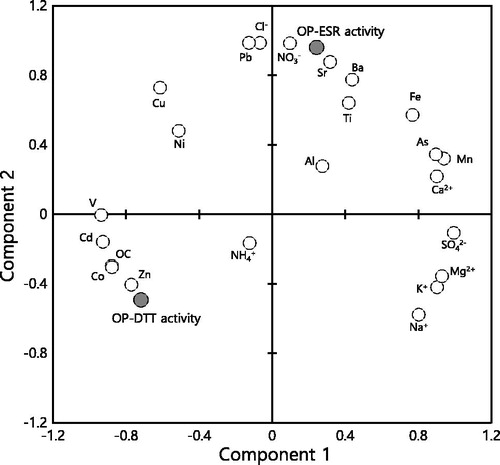
A principal component analysis (PCA) method with 26 variables was applied to elucidate the relationship between the mass-normalized OP activities and the mass fractions of the chemical components in PM2.5. As shown in , the OP-DTT and OP-ESR activities were clearly separated by components 1 and 2. The OP-DTT activity showed negative loadings, while the OP-ESR activity showed positive loadings for both components 1 and 2. The OP-DTT activity was grouped with carbonaceous compounds (OC and EC) and several elements (Cd, Co, V, and Zn). Lippmann et al. (Citation2006) reported that mortality risk was significantly affected by Ni, V, EC, Zn, SO42–, Cu, Pb, and OC, and Cd and Co were classified as hazardous air pollutants by the Clean Air Act Amendments (US EPA). The chemical components grouped together with the OP-DTT activity were considered toxic compounds (Lippmann et al. Citation2006; Li et al. Citation2016c). The OP-ESR activity was grouped with chloride, nitrate, and elements such as Ba, Pb, Sr, and Ti. Sulfate was grouped with most of the cations (Ca2+, K+, Mg2+, and Na+), suggesting that the formation of (Ca, K, Mg, and Na) SO4 occurred during ash formation (Seames Citation2003; Gao et al. Citation2016). The PCA result can provide correlation and similarity of variables or samples, but it does not prove causation of variables (Parsons, Cooper, and Albertson Citation2009; Bloomer and Rehm Citation2014; Lenz et al. Citation2016). In addition, the correlation analysis could not elucidate any compounding effects among chemical components.
Figure 6. PCA results for the mass-normalized OP activities and the mass fractions of the chemical components in PM2.5; components 1 and 2 explain 60.2% and 27.9% of the variance, respectively.
Conclusions
Fine coal combustion particles were produced from a laboratory-scale pulverized-coal burning system, and their physical properties (mass concentration and number size distributions), chemical components (OC, EC, organic compounds [PAHs, hopanes, n-alkanes, and n-alkanoic acids]), ionic species (chloride, nitrate, sulfate, ammonium, calcium, magnesium, potassium, and sodium), elements (Al, As, Ba, Cd, Co, Cu, Fe, Mn, Ni, Pb, Sr, Ti, V, and Zn), and OP activities (DTT and ESR assays) for water soluble components of PM2.5 at different burning temperatures (550 °C, 700 °C, 900 °C, and 1,100 °C) were investigated. Nucleation mode particles less than 100 nm were responsible for the number concentration of fine particles from coal combustion, while a bimodal mass size distribution was observed at all tested burning temperatures. The devolatilization and incomplete combustion of volatile matter (tar) were strong at 550 °C, where a significant OC emission was found. A significant number of nanoparticles were also found at 550 °C, suggesting that the formation of particles from semi-volatile organic vapors via a gas-to-particle conversion process was strong at the low burning temperature. The fractions of ions and elements increased when the burning temperature was higher than 550 °C owing to ash formation. Sulfate and Fe were the highest among measured ions and elements, respectively. The intrinsic OP-DTT and OP-ESR activities (mass-normalized) at 550 °C were found to be higher than those at other burning temperatures, possibly due to higher levels of redox active compounds in the fine particles from coal combustion. The data suggest that fine particles from coal combustion produced at low burning temperatures have more potential for adverse health effects on humans than those produced at high burning temperatures.
Supplemental Material
Download Zip (916.3 KB)Disclosure statement
No potential conflict of interest was reported by the authors.
Additional information
Funding
Related Research Data
References
- Andreae, M. O., and A. Gelencsér. 2006. Black carbon or brown carbon? The nature of light-absorbing carbonaceous aerosols. Atmos. Chem. Phys. 6 (10):3131–48.
- Bates, J. T., R. J. Weber, J. Abrams, V. Verma, T. Fang, M. Klein, M. J. Strickland, S. E. Sarnat, H. H. Chang, J. A. Mulholland, et al. 2015. Reactive oxygen species generation linked to sources of atmospheric particulate matter and cardiorespiratory effects. Environ. Sci. Technol. 49:13605–12.
- Batjargal, T., E. Otgonjargal, K. Baek, and J. S. Yang. 2010. Assessment of metals contamination of soils in Ulaanbaatar, Mongolia. J. Hazard. Mater. 184:872–76.
- Batmunkh, T., Y. J. Kim, J. S. Jung, K. Park, and B. Tumendemberel. 2013. Chemical characteristics of fine particulate matters measured during severe winter haze events in Ulaanbaatar, Mongolia. J. Air Waste Manage. Assoc. 63 (6):659–70.
- Bejarano, P. A., and Y. A. Levendis. 2008. Single-coal-particle combustion in O2/N2 and O2/CO2 environments. Combust. Flame 153:270–87.
- Biswas, P., W. N. Wang, and W. J. An. 2011. The energy-environment nexus: Aerosol science and technology enabling solutions. Front. Environ. Sci. Eng. China 5 (3):299–312.
- Bloomer, C., and G. Rehm. 2014. Using principal component analysis to find correlation and patterns at diamond light source. Proceedings of IPAC 2014, Dresden, Germany.
- Bond, T. C., D. S. Covert, J. C. Kramlich, T. V. Larson, and R. J. Charlson. 2002. Primary particle emissions from residential coal burning: Optical properties and size distributions. J. Geophys. Res. Atmos. 107 (D21):ICC 9-1–14.
- Buhre, B. J. P., J. T. Hinkley, R. P. Gupta, T. F. Wall, and P. F. Nelson. 2005. Submicron ash formation from coal combustion. Fuel 84 (10):1206–14.
- Cao, G. L., X. Y. Zhang, and F. C. Zheng. 2006. Inventory of black carbon and organic carbon emissions from China. Atmos. Environ. 40:6516–27.
- Cao, J., Q. Wang, J. C. Chow, J. G. Watson, X. Tie, Z. Shen, P. Wang, and Z. An. 2012. Impacts of aerosol compositions on visibility impairment in Xi’an, China. Atmos. Environ. 59:559–66.
- Chang, Y. W., H. S. Joo, K. Park, and J. Y. Lee. 2017. Characteristics of chemical composition in carbonaceous aerosol of PM2.5 collected at smoke from coal combustion. J. Korean Soc. Atmos. Environ. 33 (3):265–76.
- Charrier, J. G., and C. Anastasio. 2012. On dithiothreitol (DTT) as a measure of oxidative potential for ambient particles: Evidence for the importance of soluble transition metals. Atmos. Chem. Phys. 12 (19):9321–33.
- Chen, Y., G. Sheng, X. Bi, Y. Feng, B. Mai, and J. Fu. 2005. Emission factors for carbonaceous particles and polycyclic aromatic hydrocarbons from residential coal combustion in China. Environ. Sci. Technol. 39:1861–1867.
- Chen, Y., G. Zhi, Y. Feng, D. Liu, G. Zhang, J. Li, G. Sheng, and J. Fu. 2009. Measurements of black and organic carbon emission factors for household coal combustion in China: Implication for emission reduction. Environ. Sci. Technol. 43 (24):9495–500.
- Dacombe, P., M. Pourkashanian, A. Williams, and L. Yap. 1999. Combustion-induced fragmentation behavior of isolated coal particles. Fuel 78 (15):1847–57.
- Deng, J., X. Ma, Y. Zhang, Y. Li, and W. Zhu. 2015. Effects of pyrite on the spontaneous combustion of coal. Int. J. Coal Sci. Technol. 2 (4):306–11.
- Dockery, D. W., and C. A. Pope. 1994. Acute respiratory effects of particulate air pollution. Annu. Rev. Public Health 15:107–32.
- Fang, T., H. Guo, V. Verma, R. E. Peltier, and R. J. Weber. 2015. PM2.5 water-soluble elements in the southeastern United States: Automated analytical method development, spatiotemporal distributions, source apportionment, and implications for heath studies. Atmos. Chem. Phys. 15 (20):11667–82.
- Furuya, K., Y. Miyajima, T. Chiba, and T. Kikuchi. 1987. Elemental characterization of particle size-density separated coal fly ash by spectrophotometry, inductively coupled plasma emission spectrometry, and scanning electron microscopy-energy dispersive X-ray analysis. Environ. Sci. Technol. 21:898–903.
- Gao, Q., S. Li, Y. Yuan, Y. Zhao, and Q. Yao. 2016. Role of minerals in the evolution of fine particulate matter during pulverized coal combustion. Energy Fuels 30 (3):1815–21.
- Gilmour, M. I., S. O’Connor, C. A. J. Dick, C. A. Miller, and W. P. Linak. 2004. Differential pulmonary inflammation and in vitro cytotoxicity of size-fractionated fly ash particles from pulverized coal combustion. Air Manage. Assoc. 54 (3):286–95.
- Gustafsson, Ö., M. Kruså, Z. Zencak, R. J. Sheesley, L., Granat, E. Engström, P. S. Praveen, P. S. Rao, C. Leck, and H. Rodhe. 2009. Brown clouds over South Asia: Biomass or fossil fuel combustion? Science 323 (5913):495–8.
- Hammond, C. R. 2003. Physical constants of inorganic compounds. In CRC handbook of chemistry and physics, ed. D. R. Lide, 39–96. 84th ed., Ch. 4. Boca Raton, FL: CRC.
- Hegglin, M. I., U. K. Krieger, T. Koop, and T. Peter. 2002. Organics induced fluorescence in Raman studies of sulfuric acid aerosols. Aerosol Sci. Tech. 36 (4):510–12.
- Hellack, B., A. Yang, F. R. Cassee, N. A. H. Janssen, R. P. F. Schins, and T. A. J. Kuhlbusch. 2014. Intrinsic hydroxyl radical generation measurements directly from sampled filters as a metric for the oxidative potential of ambient particulate matter. J. Aerosol Sci. 72:47–55.
- Hennigan, C. J., J. Izumi, A. P. Sullivan, R. J. Weber, and A. Nenes. 2015. A critical evaluation of proxy methods used to estimate the acidity of atmospheric particles. Atmos. Chem. Phys. 15 (5):2775–15.
- Hensley, K., K. A. Robinson, S. P. Gabbita, S. Salsman, and R. A. Floyd. 2000. Reactive oxygen species, cell signaling, and cell injury. Free Radic. Biol. Med. 28 (10):1456–62.
- IPCC 2014. Climate change 2014: Impacts, adaptation, and vulnerability. Part A: Global and sectoral aspects. Contribution of working group II to the fifth assessment report of the intergovernmental panel on climate change. Cambridge University Press, Cambridge and New York.
- Janhäll, S., M. O. Andreae, and U. Pöschl. 2010. Biomass burning aerosol emissions from vegetation fires: Particle number and mass emission factors and size distributions. Atmos. Chem. Phys. 10 (3):1427–39.
- Kelly, F. J., and J. C. Fussell. 2016. Health effects of airborne particles in relation to composition, size and source. In Airborne particulate matter, ed. R. E. Hester and R. M. Harrison, 344–82. Cambridge: Royal Society of Chemistry.
- Kim, M., C. Cho, Y. Jeon, J. Yang, H. Sin, and E. C. Jeon. 2016. Domestic bituminous coal’s calorific value trend analysis (2010–2014) and carbon emission factor development. J. Clim. Change Res. 7 (4):513–20.
- Kuhns, H. D., C. Mazzoleni, H. Moosmüller, D. Nikolic, R. E. Keislar, P. W. Barber, Z. Li, V. Etyemezian, and J. G. Watson. 2004. Remote sensing of PM, NO, CO and HC emission factors for on-road gasoline and diesel engine vehicles in Las Vegas, NV. Sci. Total Environ. 322 (1–3):123–37.
- Lee, K. Y., T. Batmunkh, H. S. Joo, and K. Park. 2018. Comparison of the physical and chemical characteristics of fine road dust at different urban sites. J. Air Waste Manage. Assoc. 68 (8):812–23.doi: 10.1080/10962247.2018.1443855.
- Lenz, M., F. J. Müller, M. Zenke, and A. Schuppert. 2016. Principal components analysis and the reported low intrinsic dimensionality of gene expression microarray data. Sci. Rep. 6:25696. doi:10.1038/srep25696.
- Li, S., S. Guo, X. Huang, T. Huang, I. Bibi, F. Muhammad, G. Xu, Z. Zhao, L. Yu, Y. Yan, et al. 2016c. Research on characteristics of heavy metals (As, Cd, Zn) in coal from southwest China and prevention method by using modified calcium-based materials. Fuel 186:714–25.
- Li, Q., J. Jiang, Q. Zhang, W. Zhou, S. Cai, L. Duan, S. Ge, and J. Hao. 2016a. Influences of coal size, volatile matter content, and additive on primary particulate matter emissions from household stove combustion. Fuel 182:780–7.
- Li, Q., X. Li, J. Jiang, L. Duan, S. Ge, Q. Zhang, J. Deng, S. Wang, and J. Hao. 2016b. Semi-coke briquettes: Towards reducing emissions of primary PM2.5, particulate carbon, and carbon monoxide from household coal combustion in China. Sci. Rep. 6 (1):19306.
- Li, Q. F., A. Wyatt, and R. M. Kamens. 2009. Oxidant generation and toxicity enhancement of aged-diesel exhaust. Atmos. Environ. 43 (5):1037–42.
- Lind, T., E. I. Kauppinen, W. Maenhaut, A. Shah, and F. Huggins. 1996. Ash vaporization in circulating fluidized bed coal combustion. Aerosol Sci. Technol. 24 (3):135–50.
- Lippmann, M., K. Ito, J.-S. Hwang, P. Maciejczyk, and L.-C. Chen. 2006. Cardiovascular effects of nickel in ambient air. Environ. Health Perspect. 114 (11):1662–9.
- Makino, H., and H. Matsuda. 2002. Improvement for pulverized coal combustion technology for power generation. Yokosuka, Japan: Central Research Institute of Electric Power Industry (CRIEPI), Yokosuka Research Laboratory. CRIEPI Rev. 46.
- Nickel, C., H. Kaminski, B. Hellack, U. Quass, A. John, O. Klemm, and T. A. J. Kuhlbusch. 2013. Size resolved particle number emission factors of motorway traffic differentiated between heavy and light duty vehicles. Aerosol Air Qual. Res. 13:450–61.
- Ohara, T., H. Akimoto, J. Kurokawa, N. Horii, K. Yamaji, X. Yan, and T. Hayasaka. 2007. An Asian emission inventory of anthropogenic emission sources for the period 1980–2020. Atmos. Chem. Phys. 7:4419–44.
- Oros, D., and B. Simoneit. 2000. Identification and emission rates of molecular tracers in coal smoke particulate matter. Fuel 79 (5):515–36.
- Park, M., H. S. Joo, K. Lee, M. Jang, S. D. Kim, I. Kim, L. J. S. Borlaza, H. Lim, H. Shin, K. H. Chung, et al. 2018. Differential toxicities of fine particulate matters from various sources. In preparation (submitted to Scientific Report).
- Parsons, K. J., W. J. Cooper, and R. C. Albertson. 2009. Limits of principal components analysis for producing a common trait space: Implications for inferring selection, contingency, and chance in evolution. PLoS One 4 (11):e7957. doi:10.1371/journal.pone.0007957.
- Peters, A., H. E. Wichmann, T. Tuch, J. Heinrich, and J. Heyder. 1997. Respiratory effects are associated with the number of ultrafine particles. Am. J. Respir. Crit. Care Med. 155 (4):1376–83.
- Philip, M., D. A. Rowley, and H. Schreiber. 2004. Inflammation as a tumor promoter in cancer induction. Semin. Cancer Biol. 14 (6):433–9.
- Popescu, F., and I. Ionel. 2010. Anthropogenic air pollution sources, air quality. In InTech, ed. A. Kumar. doi: 10.5772/9751. Accessed August 18, 2010. https://www.intechopen.com/books/air-quality/anthropogenic-air-pollution-sources
- Raask, E. 1985. Mineral impurities in coal combustion - Behaviour, problems and remedial measures. Washington, DC: Hemisphere Publishing Corp.
- Saxena, M., A. Sharma, A. Sen, P. Saxena, Y. Saraswati, T. K. Mandal, S. K. Sharma, and C Sharma. 2017. Water soluble inorganic species of PM10 and PM2.5 at an urban site of Delhi, India: Seasonal variability and sources. Atmos. Environ. 184:112–25.
- Seames, W. S. 2003. An initial study of the fine fragmentation fly ash particle mode generated during pulverized coal combustion. Fuel Process. Technol. 81 (2):109–25.
- Shen, G., S. Tao, S. Wei, Y. Zhang, R. Wang, B. Wang, W. Li, H. Shen, Y. Huang, Y. Chen, H., et al. 2012. Emissions of parent, nitro, and oxygenated polycyclic aromatic hydrocarbons from residential wood combustion in rural China. Environ. Sci. Technol. 46 (15):8123–30.
- Shen, Z., J. Cao, R. Arimoto, Y. Han, C. Zhu, J. Tian, and S. Liu. 2010. Chemical characteristics of fine particles (PM1) from Xi’an, China. Aerosol Sci. Technol. 44 (6):461–72.
- Shim, C., and J. Seo. 2013. Air quality issues associated with future domestic coal power planning and emission projection of East Asia. Policy report 2013–2014, Korea Environment Institute, Sejong, Korea.
- Sidhu, S., J. Graham, and R. Striebich. 2001. Semi-volatile and particulate emissions from the combustion of alternative diesel fuels. Chemosphere 42 (5–7):681–90.
- Solomon, P. R., T. H. Fletcher, and R. J. Pugmire. 1993. Progress in coal pyrolysis. Fuel 72 (5):587–97.
- Stanger, R., and T. Wall. 2011. Sulphur impacts during pulverised coal combustion in oxy-fuel technology for carbon capture and storage. Prog. Energy Combust. Sci. 37:69–88.
- Streets, D. G., T. C. Bond, G. R. Carmichael, S. D. Fernandes, Q. Fu, D. He, Z. Klimont, S. M. Nelson, N. Y. Tsai, M. Q. Wang, et al. 2003. An inventory of gaseous and primary aerosol emissions in Asia in the year 2000. J. Geophys. Res. 108 (D21):8809.
- Streets, D. G., S. Gupta, S. T. Waldhoff, M. Q. Wang, T. C. Bond, and B. Yiyun. 2001. Black carbon emissions in China. Atmos. Environ. 35 (25):4281–96.
- Sun, J., G. Zhi, R. Hitzenberger, Y. Chen, C. Tian, Y. Zhang, Y. Feng, M. Cheng, Y. Zhang, J. Cai, et al. 2017. Emission factors and light absorption properties of brown carbon, from household coal combustion in China. Atmos. Chem. Phys. 17 (7):4769–80.
- Taylor, D. D., and R. C. Flagan. 1981. The influence of combustor operation on fine particles from coal combustion. Aerosol Sci. Technol. 1 (1):103–17.
- Tuet, W. Y., S. Fok, V. Verma, M. S. Tagle Rodriguez, A. Grosberg, J. A. Champion, and N. L. Ng. 2016. Dose-dependent intracellular reactive oxygen and nitrogen species (ROS/RNS) production from particulate matter exposure: comparison to oxidative potential and chemical composition. Atmos. Environ. 144:335–344.
- Wang, F., Z. Guo, T. Lin, and N. L. Rose. 2016b. Seasonal variation of carbonaceous pollutants in PM2.5 at an urban ‘supersite’ in Shanghai, China. Chemosphere 146:238–44.
- Wang, F. F., C. M. Geng, W. D. Hao, Y. D. Zhao, Q. Li, H. M. Wang, and Y. Qian. 2016a. The cellular toxicity of PM2.5 emitted from coal combustion in human umbilical vein endothelial cells. Biomed. Environ. Sci. 29 (2):107–16.
- Wang, P., B. Pan, H. Li, Y. Huang, X. Dong, F. Ai, L. Liu, M. Wu, and B. Xing. 2018. The overlooked occurrence of environmentally persistent free radicals in an area with low-rank coal burning, Xuanwei, China. Environ. Sci. Technol. 52 (3):1054–61.
- Wang, X., B. J. Williams, X. Wang, Y. Tang, Y. Huang, L. Kong, X. Yang, and P. Biswas. 2013. Characterization of organic aerosol produced during pulverized coal combustion in a drop tube furnace. Atmos. Chem. Phys. 13 (21):10919–32.
- Wang, Y., P. K. Hopke, D. C. Chalupa, and M. J. Utell. 2011. Effect of the shutdown of a coal-fired power plant on urban ultrafine particles and other pollutants. Aerosol Sci. Technol. 45 (10):1245–9.
- Watson, J. G. 2002. Visibility: Science and regulation. J. Air Waste Manag. Assoc. 52 (6):628–713.
- Weber, R. J., H. Guo, A. G. Russell, and A. Nenes. 2016. High aerosol acidity despite declining atmospheric sulfate concentrations over the past 15 years. Nature Geosci. 9 (4):282–5.
- World Energy Council. 2013. World energy resources: 2013 survey. London: World Energy Council.
- Yang, A., B. Hellack, D. Leseman, B. Brunekreef, T. A. J. Kuhlbusch, F. R. Cassee, G. Hoek, and N. A. H. Janssen. 2015. Temporal and spatial variation of the metal-related oxidative potential of PM2.5 and its relation to PM2.5 mass and elemental composition. Atmos. Environ. 102:62–9.
- Yang, A., A. Jedynska, B. Hellack, I. Kooter, G. Hoek, B. Brunekreef, T. A. J. Kuhlbusch, F. R. Cassee, and N. A. H. Janssen. 2014. Measurement of the oxidative potential of PM2.5 and its constituents: The effect of extraction solvent and filter type. Atmos. Environ. 83:35–42.
- Yoo, J. I., W. P. Linak, C. T. Shinagawa, H. N. Jang, M. I. Gilmour, and J. O. L. Wendt. 2006. Design and characterization of an ultrafine coal ash aerosol generator for direct animal exposure studies. In A and WM. 25th Annual International Conference on Incineration and Thermal Treatment Technologies, Savannah, GA, May 15–19, IT3(2):637-649.
- Zhang, Y., J. J. Schauer, Y. Zhang, L. Zeng, Y. Wei, Y. Liu, and M. Shao. 2008. Characteristics of particulate carbon emissions from real-world Chinese coal combustion. Environ. Sci. Technol. 42 (14):5068–73.
- Zhang, Y., and S. Tao. 2009. Global atmospheric emission inventory of polycyclic aromatic hydrocarbons (PAHs) for 2004. Atmos. Environ. 43 (4):812–9.
- Zhi, G., Y. Chen, Y. Feng, S. Xiong, J. Li, G. Zhang, G. Sheng, and J. Fu. 2008. Emission characteristics of carbonaceous particles from various residential coal-stoves in China. Environ. Sci. Technol. 42 (9):3310–5.
- Zhou, W., J. Jiang, L. Duan, and J. Hao. 2016. Evolution of submicrometer organic aerosols during a complete residential coal combustion process. Environ. Sci. Technol. 50 (14):7861–9.