
Abstract
Black carbon (BC)-containing particles are the most strongly light absorbing aerosols in the atmosphere. Measurements of BC are challenging because of its semi-empirical definition based on physical properties and not chemical structure, the complex and continuously changing morphology of the corresponding particles, and the effects of other particulate components on its absorption. In this study, we compare six available commercial continuous instruments measuring BC using biomass burning aerosol. The comparison involves a Soot Particle Aerosol Mass Spectrometer (SP-AMS), a Single-Particle Soot Photometer (SP2), an aethalometer, a Multiangle Absorption Photometer (MAAP), and a blue and a green photoacoustic extinctiometer (PAX). An SP-AMS collection efficiency equal to 0.35 was measured for this aerosol system. The corrected SP-AMS BC mass measurements agreed within 6% with the SP2 refractory BC mass values. Two regimes of behavior were identified for the optical instruments corresponding to high and low organic/BC ratio. The mass absorption cross-sections (MAC) measured varied from 26% to two times the instrument default values depending on the instrument and the regime. The presence of high organic aerosol concentration in this system can lead to overestimation of the BC mass by the optical instruments by as much as a factor of 2.7. In general, the discrepancy among the BC measurements increased as the organic carbon content of the BC-containing particles increased.
© 2018 American Association for Aerosol Research
EDITOR:
1. Introduction
Black carbon (BC)-containing particles are emitted in the atmosphere from a wide variety of combustion processes. Sources that emit high concentrations of BC include diesel engines, industrial processes, residential solid fuel combustion, open burning, etc. (Bond et al. Citation2013). BC is characterized by its ability to absorb light and is refractory with vaporization temperature near 4000 K (Schwarz et al. Citation2006). The fresh emitted BC-containing particles have aggregate morphology (Medalia and Heckman Citation1969), are hydrophobic (Weingartner et al. Citation1997) and are covered by organic compounds usually co-emitted with them. Bond et al. (Citation2013) showed that biomass burning is the largest contributor to global BC.
The effect of BC on human health and climate remains uncertain (Seinfeld Citation2008). BC exerts significant radiative forcing and is believed to be the second most important global warming agent after carbon dioxide (Ramanathan and Carmichael Citation2008; Bond et al. Citation2013). However, its importance for the radiative balance of our planet might be even more significant because BC particles also contain other components like organics, sulfates, and nitrates (Jacobson Citation2001; Adachi, Chung, and Buseck Citation2010) which can enhance their absorption, though the magnitude of this enhancement remains controversial (Cappa et al. Citation2012; Lack et al. Citation2012; Liu et al. Citation2015).
The measurement of the BC concentration in the atmosphere is complicated because there is no clear chemical definition of the species. It is also challenging because of the non-spherical, complex morphology of the BC-containing particles (Chakrabarty et al. Citation2006) which changes as the particles evolve in the atmosphere. The varying thickness of coatings that can be formed through condensation of secondary aerosol components on BC-containing particles presents an additional challenge for the measurement of BC.
Petzold et al. (Citation2013) proposed a terminology for the BC based on the method used for its measurement. A number of commercial instruments (aethalometer, Photoacoustic Extinctiometer-PAX, Multiangle Absorption Photometer-MAAP, Particle Soot/Absorption Photometer-PSAP, Photoacoustic Soot Spectrometer-PASS, Photoacoustic Spectrometer-PAS, continuous soot monitoring system-COSMOS) for the measurement of BC mass calculate the equivalent BC (eBC) mass concentration by measuring the absorption coefficient (babs) of the particles. The aerosol mass absorption cross-section (MAC) is then used to convert the measured babs to the eBC mass concentration. Other instruments (Soot Particle Aerosol Mass Spectrometer-SP-AMS, Single-Particle Soot Photometer-SP2) measure the refractory BC (rBC) mass concentration by heating the particles with an infrared laser (Melton Citation1984; Stephens, Turner, and Sandberg Citation2003; Snelling et al. Citation2005; Schwarz et al. Citation2006; Chan et al. Citation2011). In the SP2 the BC-containing particles are heated to the point of incandescence and the incandescent light emission is measured. In the SP-AMS the BC-containing particles are vaporized with the use of a laser. The resulting vapor is ionized and the ions are detected by a high–resolution mass spectrometer (DeCarlo et al. Citation2006). These instruments are calibrated relating their signal to the rBC mass with the help of BC proxies like Aquadag (Aqueous Deflocculated Acheson Graphite, Achenson Inc.) or fullerene soot (Alfa Aesar) or regal black (REGAL 400 R pigment black Cabot Corp.). Thermal-optical analysis of filter-based samples to measure elemental carbon (EC) has been used for more than 50 years (Huntzicker et al. Citation1982; Watson et al. Citation2005; Subramanian, Khlystov, and Robinson Citation2006; Petzold et al. Citation2013) and will not be further considered in the present work.
Several inter-comparisons of BC-measuring instruments have been previously conducted. Chirico et al. (Citation2010) compared measurements of eBC mass concentration in diesel exhaust by an aethalometer and a MAAP. The aethalometer eBC mass concentration was calculated using a MAC of 16.6 m2 g−1 at λ = 880 nm and a multiple scattering correction (Weingartner et al. Citation2003). The eBC mass concentration measured by the aethalometer was higher than that of the MAAP by a factor of 1.46 ± 0.05. This study found that the MAAP measurements were in a better agreement with the total mass of aerosol.
Slowik et al. (Citation2007) compared an SP2, a PAS, and a MAAP using emissions from the combustion of ethylene. A MAC of 6.2 m2 g−1 at λ = 870 nm was used for the PAS, and a MAC of 6.6 m2 g−1 at λ = 670 nm for the MAAP. For uncoated soot (OA/BC = 0.1–0.7), the average ratio of eBC mass concentration measured by the MAAP to the rBC mass concentration measured by the SP2 was 1.36. Moreover, the ratio of the PAS to the SP2 BC mass concentration measurements was 0.91. This study also tested the instruments at higher OA/BC ratios by using oleic acid and anthracene. Two different soot coatings were used: a 50 nm oleic acid coating and a 60 nm thick coating of anthracene. For the 50 nm coating the ratio of the MAAP to the SP2 BC mass concentration was 1.15, while the ratio of the PAS to the SP2 BC mass concentration was 0.77. For the 60 nm coating the ratio of the MAAP to the SP2 increased to 1.8, while the ratio of the PAS to the SP2 increased to 1.6. Finally, the same authors compared the instruments by sampling glassy carbon spheres with a known density. In these tests they found ±60% differences among the various BC mass concentration measurements.
Holder et al. (Citation2014) compared an SP2, a PASS-3 and an aethalometer during on-road and near road measurements The PASS-3 measures the babs at λ = 405, 532, and 781 nm. For the aethalometer measurements a MAC = 16.6 m2 g−1 at 880 nm was used and a MAC = 7.5 m2 g−1 at 550 nm for the PASS-3. For the inter-comparison they used 2 and 10 s averaged measurements. For the 10 s averages the slope of the regression line relating the PASS to the aethalometer measurements ranged from 0.89 to 1.07 with an intercept ranging from –0.17 to 0.21 μg m−3. The slope of the SP2 as a function of the PASS measurements ranged from 0.52 to 0.64 with an intercept ranging from 0.02 to 0.15 μg m−3.
Onasch et al. (Citation2012) compared the SP-AMS with an MAAP using ambient measurements in an urban area. The two instruments were correlated with R2 = 0.76. Massoli et al. (Citation2015) compared the rBC mass concentration measurements of an SP-AMS and an SP2 during the CalNex 2010 field campaign. The SP-AMS measurements were approximately 55% (20–100%) of the rBC mass reported by the SP2. In addition, Collier et al. (Citation2018) recently compared the SP-AMS and SP2 using ambient measurements in Fresno, CA. They reported that the SP-AMS rBC (CE = 1) was 0.37 times the SP2 rBC mass concentration.
Cross et al. (Citation2010) used six different types of particles: nascent soot, dioctyl sebacate coated soot, sulfuric acid coated soot as well as their thermo-denuded equivalents. The coating thickness ranged from 0.5 to 200 nm. They showed that the coating of fresh soot can cause the structural collapse of the particle. The SP2 measurements of rBC mass were independent of particle shape and the type and thickness of the coating. On the other hand, they found that the PASS and PAS indicated a 2 to 2.25 increase in the measurement of absorption, or eBC mass, for a coating thickness of 100 nm. Ahern et al. (Citation2016) showed that rBC mass can be underestimated by the SP-AMS, due to the aggregate morphology of the particles. They found that organic coating of fresh rBC particles changes their aggregate morphology to more spherical, narrows the particle beam in the SP-AMS focusing it better on the vaporizer, which leads to an increase of the SP-AMS rBC signal.
Despite the above studies there are still outstanding questions related to the performance of different BC mass concentration measurement techniques. These include the effect of the non-BC to BC ratio on the BC mass concentration measurements of especially the optical eBC techniques, the MAC values that should be used, and the performance of the newly developed SP-AMS.
In this study, we evaluate the SP-AMS and for the first time compare it with five other BC instruments using biomass burning emissions. The inter-comparison involves an SP-AMS, a blue PAX (λ = 405 nm), a green PAX (λ = 532 nm), a MAAP, an aethalometer, and an SP2. Unlike the previous studies with the SP-AMS in particular, our experiments were conducted under controlled conditions, by injecting biomass burning emissions into a smog chamber. Two regimes of high and low organic to BC concentration were examined to investigate the effect of the OA mass concentration on the measurement of the eBC mass concentration.
2. Experimental setup
The experiments took place in the smog chamber facility of the Center for Atmospheric Particle Studies (CAPS) at Carnegie Mellon University. The smog chamber is a 12 m3 Teflon reactor (Welch Fluorocarbons) inside a temperature-controlled room. Prior to each experiment, the chamber was flushed with purified air for 12–48 h. Air was passed through HEPA and activated carbon filters to remove particles and gas-phase organics, respectively, and silica gel to reduce relative humidity. All the experiments were carried out at a constant temperature of 20 ± 2 °C and at RH < 10%.
BC-containing particles were generated by the combustion of white birch using an environmentally efficient cook stove (G3 rocketstove, Envirofit). The emissions were injected in the smog chamber using two Dekati diluters (DI-1000) in a parallel configuration.
The BC instruments used can be separated into two categories: instruments that measure the eBC concentration and instruments that measure the rBC concentration. The instruments of each type used in our study are described below.
2.1. eBC measurements
A seven wavelength aethalometer (AE31, Magee Scientific) was used to measure the eBC in seven wavelengths (370, 470, 520, 590, 660, 880, and 950 nm). The instrument collects particles on a quartz filter and simultaneously measures the attenuation of light through the filter at various wavelengths. The AE-31 measures the babs and assuming MAC (m2 g−1) = 14625/λ (nm) it calculates the eBC mass concentration. The aethalometer is a filter-based instrument and has multiple artifacts. These artifacts are associated with the absorption enhancement due to multiple scattering in the collection filter (Weingartner et al. Citation2003) and the decrease of the aethalometer response due to scattering of aerosols embedded in the filter or due to some particles being shadowed by others (Kirchstetter and Novakov Citation2007). Finally, there are artifacts due to the light absorbing particles accumulating in the filter (Cappa et al. Citation2008; Lack et al. Citation2008). Our measurements were corrected for the scattering and multiple scattering artifacts following Saleh et al. (Citation2014) and Tasoglou et al. (Citation2017) using the corrections suggested by Weingartner et al. (Citation2003) and Kirchstetter and Novakov (Citation2007). The corrections showed that the instrument was overestimating the eBC by a factor of 1.75–1.8. In our analysis the corrected measurements were used.
The MAAP (5012, Thermo Scientific) is also a filter-based instrument in which the particles are deposited on a quartz fiber filter (Petzold, Kramer, and Schönlinner Citation2002; Petzold and Schönlinner Citation2004; Petzold et al. Citation2005). It uses a 670 nm visible light source and measures both light attenuation and scattering at two angles from particles collected on the filter. It calculates the aerosol light absorption by quantifying the change of the radiation field caused by the deposited particles and removes the scattering effects that can interfere with optical absorption methods. Using a MAC = 6.6 m2 g−1 it calculates the eBC mass concentration. The multi-angle absorption photometer quantifies the change of the radiation field caused by deposited particles in the front and the back of a glass-fiber filter, and removes the scattering effects that can interfere with optical absorption methods. Due to this approach the artifacts of the instrument are lower compared to other filter-based instruments (Petzold, Kramer, and Schönlinner Citation2002; Petzold and Schönlinner Citation2004; Petzold et al. Citation2005). The PAX (Droplet Measurement Techniques) uses photoacoustic spectroscopy to measure the optical properties of aerosol (Arnott et al. Citation1999). It uses a modulated diode laser to simultaneously measure light scattering and absorption. The modulated laser light illuminates the sample and heats any absorbing particles. The particles heat the surrounding air and cause a pressure/sound wave. The amplitude of this sound wave can be used for a quantitative determination of the babs. The PAX does not have any filter-related artifacts and has an uncertainty of less than 5% for the aerosol absorption measurement (Lack et al. Citation2006). The eBC mass concentration can then be calculated using an assumed MAC (MAC =7.75 m2 g−1 at λ = 532 nm and MAC =10.18 m2 g−1 at λ = 405 nm). The light scattering coefficient (bscat) is measured by a wide-angle integrating reciprocal nephelometer. In our experiments a green (λ = 532 nm) and a blue (λ = 405 nm) PAX were used. Fullerene soot (Alfa Aesar, stock 40971, lot L20W054) and PSL spheres were used to calibrate the absorption and the scattering signals, respectively. An activated carbon denuder was placed in front of the PAXs to remove NO2.
2.2. rBC measurements
The SP2 (Droplet Measurement Techniques) measures the rBC mass in individual aerosol particles. An intra-cavity, continuous Nd: YAG laser beam (1064 nm) is used to heat the rBC particles to their boiling point or vaporization temperature, emitting thermal (incandescent) radiation. The energy emitted during this incandescence is measured, and a quantitative determination of the rBC mass is made. The SP2 also includes a scattering detector, which detects single-particle light scattering at 1064 nm (Stephens, Turner, and Sandberg Citation2003; Schwarz et al. Citation2006). When sampling at high concentrations (>10,000 particles cm−3) particle coincidence can be a significant measurement artifact. The data were corrected for coincidence using the approach of Holder et al. (Citation2014) leading to a 1–15% increase of the BC mass. The BC particle size range that can be detected is 70–500 nm mass-equivalent diameter assuming a BC density of 1.8 g cm−3. The SP2 was calibrated for the BC measurements using fullerene soot (Alfa Aesar, stock 40971, lot L20W054). The calibration of the SP2 was verified in separate experiments using a centrifugal particle mass analyzer (CPMA, Cambustion; Olfert and Collings Citation2005). For the verification experiments, size-selected and denuded (using a thermo-denuder operating at 250 °C) emissions from the combustion of white birch under flaming conditions were used. Good agreement (slope of 1.1 and R2 = 0.99) between the SP2 rBC mode mass and the CPMA mode mass was observed. A detailed description of these results can be found in Saliba et al. (Citation2016). The data were analyzed using the Probe Analysis Package for Igor (PAPI). The scattering measurement was calibrated using monodisperse polystyrene latex (PSL) spheres.
The SP-AMS (Aerodyne Inc.) is an instrument similar to the HR-ToF-AMS with the addition of an intra-cavity laser vaporizer. This instrument can provide information about the size distribution and the chemical composition of both the non-refractory (organics, nitrate, ammonium, sulfate, chloride), and refractory components of the particles (Onasch et al. Citation2012). The SP-AMS uses a laser beam in order to vaporize the refractory mass of the particles into neutral carbon clusters. The vaporized species are then ionized and detected in the ToF-MS. Even though the detection of the refractory material by the SP2 and the SP-AMS is different, the particles are exposed to similar temperatures in both instruments. For this reason, the detected refractory material from both instruments is referred as rBC. Onasch et al. (Citation2012) showed that as the refractory material heats, the incandescence signal monitored by the SP2 is rising and simultaneously, the material vaporizes into neutral carbon clusters that are ionized and detected by the SP-AMS.
In contrast to all the previously mentioned instruments, the SP-AMS measurements of rBC mass concentration can be affected significantly by particle shape (Willis et al. Citation2014). The particle collection efficiency (CE) of the SP-AMS depends on the particle transmission through the lens (EL), the fraction of particles focusing on the vaporizer (ES), and the fraction of particles vaporized (Eb) (Huffman et al. Citation2005). When the SP-AMS uses only the tungsten vaporizer the CE of the non-refractory species for 60–600 nm particles is mostly affected by the Eb (Huffman et al. Citation2005; Matthew, Middlebrook, and Onasch Citation2008; Middlebrook et al. Citation2012; Docherty et al. Citation2013). When using the laser vaporizer, the CE is mostly affected by the ES (Willis et al. Citation2014). The SP-AMS is equipped with a beam-width probe which allows the calculation of the ES (Huffman et al. Citation2005; Willis et al. Citation2014). The SP-AMS includes ion optics for two modes of operation, referred to as V and W modes similar to the previous generation of AMS instruments. The V mode is a standard reflectron time-of-flight mass spectrometer (ToF-MS) configuration in which ions follow a trajectory from the extraction region into the reflectron and back to the multichannel plate detector. In the W-mode ions exiting the reflectron are directed into a hard mirror which focuses them back into the reflectron for a second pass before traveling to the detector (DeCarlo et al. Citation2006). The SP-AMS was operated in two modes: V mode with the tungsten vaporizer on and V mode with both the tungsten and the laser vaporizer on. The measurement time for each mode was 1 min. For the SP-AMS data analysis SQUIRREL 1.54B and PIKA 1.13B were used. In our analysis we used the fragmentation table suggested by Aiken et al. (Citation2008).
The estimated concentration uncertainty for the filter-based instruments, aethalometer and MAAP, was ±25% (Petzold and Schönlinner 2004; Bond et al. Citation2013). The estimated measurement uncertainties for the OA and rBC (SP-AMS and SP2) mass concentrations were ±40%, while for the PAX measurements we assumed a 10% error at 405 nm and a 5% error at 532 nm similar to the photoacoustic aerosol absorption spectrometer (Lack et al. Citation2012).
2.3. Additional measurements
A number of additional instruments were deployed during these experiments in order to provide complementary information about the systems investigated. A Scanning Mobility Particle Sizer (SMPS, TSI classifier model 3080, CPC model 3772 or 3010) was used for the measurement of the number distribution of the particles. A suite of gas monitors was also used. The concentration of ozone (O3) was measured using a continuous O3 analyzer (Dasibi 1008-PC) and of nitrogen oxides (NOx) using a Teledyne chemiluminescent NO/NO2/NOx analyzer Model 200 A. Also, a carbon dioxide (CO2) gas analyzer (LI-820, LI-Cor Biosciences) and a carbon monoxide (CO) gas analyzer (model 300 A, API-Teledyne) were used. Gas-phase instruments were calibrated before each experiment.
3. Experimental results and discussion
In a typical experiment the emissions from biomass burning were injected in the smog chamber during the flaming phase of combustion. The injection lasted approximately 5 min. Six BC-measuring instruments were compared in 15 experiments (). The results of Experiments 1–3 were used for the estimation of the Es of the rBC measured by the SP-AMS which was the only instrument used. In Experiments 4–8, the rBC mass concentration was measured by the SP2 and the SP-AMS allowing the estimation of the rBC CE of the latter. Finally, in Experiments 9–15, the CE-corrected rBC mass measured by the SP-AMS was compared to eBC mass concentration measured by the Aethalometer, PAXblue, and PAXgreen. In Experiments 9–12, a MAAP was also added to the suite of the optical instruments. summarizes aerosol concentrations and composition in the beginning of all experiments.
Table 1. Initial concentrations of the biomass burning emissions.
3.1. SP-AMS collection efficiency
In the SP-AMS, the aerodynamic lens focuses the particles in a narrow particle beam (Heberlein et al. Citation2001), however the beam slightly broadens due to imperfect aerodynamic focusing and Brownian motion. Spherical particles beams are narrow, while beams of irregularly-shaped particles are broader (Liu et al. Citation1995; Schreiner et al. Citation1998; Jayne et al. Citation2000; Kane and Johnston Citation2000; Tobias et al. Citation2000). A fraction of the wide beam of non-spherical particles misses the vaporizer, leading to an underestimation of the mass concentration (Ahern et al. Citation2016).
The SP-AMS is equipped with a beam-width probe, that moves horizontally, for the detection of the particle beam-width. The probe’s width is 0.41 mm, and it is placed 97 mm in front of the laser vaporizer and around 101 mm from the tungsten vaporizer (Huffman et al. Citation2005; Onasch et al. Citation2012). The intensity of the laser vaporizer has been measured by Willis et al. (Citation2014) to have a Gaussian distribution with a standard deviation approximately equal to 0.18 mm. Any mismatch in overlap between the particle and laser beam due to the narrow width of the latter occurs along the vertical axis of the instrument.
In Experiments 1–3, rBC mass concentration measurements were made with the SP-AMS using a beam-width-probe while the instrument was sampling in the laser-on mode. The positions of the probe with respect to the center of the tungsten vaporizer were –1.02, –0.51, 0, 0.51, and 1.02 mm (supplementary information [SI] ). The sampling lasted for 1.5 h during each experiment. For the data analysis a mathematical model was used that assumes that the particle number concentration in the beam can be represented by a Gaussian probability density function. The Es is a function of the particle beam-width at the vaporizer relative to the vaporizer radius. More specifically, Es is equal to the cumulative Gaussian probability density function for a distance equal to the radius of the vaporizer (Huffman et al. Citation2005). The particle beam-width in the experiments ranged from 0.34 to 0.4 mm, indicating similar particle morphology. Massoli et al. (Citation2015) calculated as average particle beam-width of 0.45 ± 0.03 mm for fresh thinly-coated roadside emissions. The resulting Es ranged from 0.34 to 0.35. Assuming that the CE of the rBC for the SP-AMS is mostly affected by the shape of the particles (CE≈Es) (Willis et al. Citation2014), an average SP-AMS CE for rBC equal to 0.35 was estimated and was used for our analysis in the rest of the work. The estimated SP-AMS CE for rBC mass concentration that is used in this study is in agreement with the value calculated using the method recently presented by Collier et al. (Citation2018) that assumes that coating thickens of BC particles affects their morphology and hence the SP-AMS CE (Willis et al. Citation2014; Massoli et al. Citation2015; Ahern et al. Citation2016)
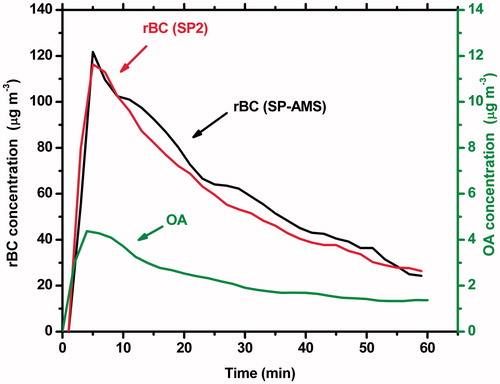
Figure 1. rBC concentration measurements by the SP-AMS and the SP2 and OA measured by the SP-AMS during Experiment 4. A CE =0.35 is assumed for rBC and CE =1 for the OA.
Hennigan et al. (Citation2011) performed laboratory experiments studying emissions from biomass burning. They found a CE =1 for the Quadrupole-AMS (Q-AMS) by comparing measurements of a SMPS and the Q-AMS. Eriksson et al. (Citation2014) studied the organic particulate matter emissions from biomass burning. They estimated a CE equal to 1 for the HR-ToF-AMS by comparing its measurements with a GC-MS. Both Q-AMS and HR-ToF-AMS use the same focusing system of lens and tungsten vaporizer as the SP-AMS when it was operated in the laser-off mode to measure the non-refractory components of the particles. Thus, in this study a CE =1 is assumed for the OA following the above studies as well as Ortega et al. (Citation2013), Bruns et al. (Citation2015), and Tasoglou et al. (Citation2017).
3.2. Inter-comparison of BC instruments
The measured rBC and OA mass concentrations during Experiment 4 are shown in . At time zero the emissions were injected into the chamber. The initial number concentration of the particles inside the chamber was 32,000 particles cm−3. According to the CE-corrected SP-AMS mass measurements the OA/rBC ratio varied from 0.04 to 0.05 during this experiment. Initially the concentration of the OA was 4.5 μg m−3, while the corrected rBC mass concentrations measured by the SP-AMS and by the SP2 were 122 μg m−3 and 116 μg m−3, respectively.
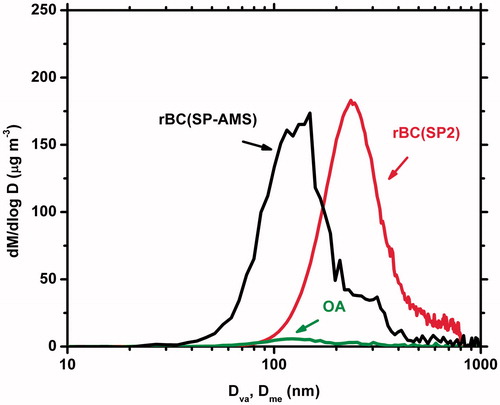
shows the average mass size distributions measured by the SP2 and the SP-AMS for Experiment 4 from t = 2 min to t = 32 min. The OA mass distribution according to the SP-AMS had a mode vaccum aerodynamic diameter (Dva) equal to 123 nm, while the corresponding rBC mode was at 149 nm. The mode mass-equivalent diameter (Dme) for the rBC based on the SP2 was at 235 nm. SI Table S1 shows the average mode diameters for the distributions retrieved from each instrument. For a non-spherical particle the relationship between the equivalent diameters depends on the shape of the particle and its density (DeCarlo et al. Citation2004). Combustion emissions, rich in BC, are expected to mostly include particles with aggregate morphology (Katrinak et al. Citation1993). In the experiments presented in this work the OA/rBC ≪ 1, which suggests aggregate morphology. The size distributions from the SMPS, SP-AMS and SP2 as a result peak in different sizes.
Figure 2. Average size distributions of the biomass burning particles during the first 30 min of the measurements during Experiment 4. The SP-AMS distributions (rBC and OA) are functions of the aerodynamic diameter (Dva) while the SP2 distribution is with respect to the mass-equivalent diameter (Dme).
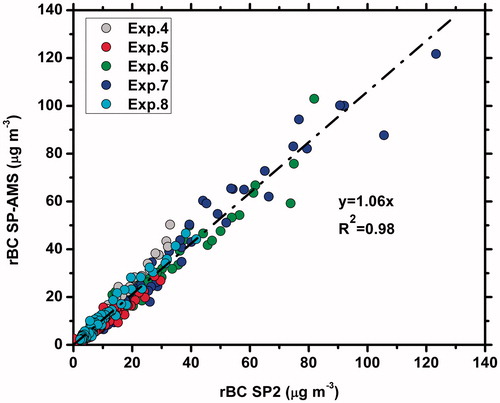
The corrected rBC mass concentration measured by the SP-AMS and the rBC mass concentration from the SP2 for Experiments 4–8 are compared to each other in . The OA/rBC ranged from 0.02 to 0.33. For individual experiments the SP-AMS corrected rBC mass concentration was 0.9–1.32 times the SP2 rBC mass with R2 = 0.94–0.97. On average the corrected rBC mass concentration by the SP-AMS was 6% higher than that of the SP2. Since a CE=Es has been used to correct the rBC mass concentration measured by the SP-AMS, the agreement between the two instruments suggests that the rBC mass measurements of the SP-AMS are indeed mostly affected by the shape of the particles.
Figure 3. Inter-comparison of the measurements of the rBC by the SP2 and the SP-AMS for Experiments 4–8.
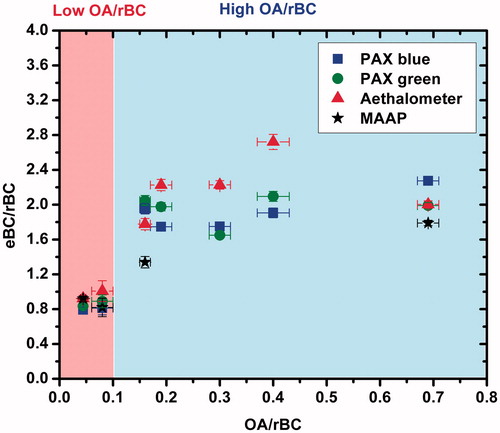
The comparisons between the eBC mass measured by the four optical instruments and the corrected rBC mass measured by the SP-AMS are shown in . The concentration of NOx and O3 in all experiments was low (<10 ppb), thus no interferences are expected in the measurements of the optical instruments. For low OA/rBC (OA/rBC < 0.1) (Experiments 9 and 10) the ratio of the eBC mass to the corrected rBC mass ranged from 0.8 to 1 depending on the optical instrument used. On the other hand, for the high OA/rBC (0.1 < OA/rBC < 0.7) (Experiments 11–15) the ratio of the eBC mass to the corrected rBC mass ranged from 1.34 to 2.72 (). As expected, the measurements of the eBC were closer to the corrected rBC mass measurements for low OA/rBC. The presence of high OA mass concentrations in the system can lead to overestimation of the eBC mass values by as much as a factor of 2.7, even at these relatively low OA/rBC ratios.
Figure 4. The ratio of the eBC as measured by the optical instruments over the rBC measured by the SP-AMS (CE = 0.35), as a function of the OA/rBC composition of the particles. Also shown the two regimes Low OA/rBC (OA < 0.1) and High OA/rBC (0.1 < OA < 0.7). The error bars represent the uncertainty of the measurements.
The MAC values were calculated for this system using the babs from the corresponding optical instrument and the corrected rBC mass concentration of the SP-AMS. For low OA/rBC (OA/rBC < 0.1) the MAC values for the PAXblue, PAXgreen, aethalometer and MAAP were 8.1, 6.5, 4.4 and 5.3 m2 g−1, respectively. For high OA/rBC (0.1 < OA/rBC < 0.7) the MAC values for the PAXblue, PAXgreen, aethalometer, and MAAP were 20.9, 15.2, 9.8, and 9 m2 g−1, respectively. There is a substantial increase of the MAC values for high OA/rBC compared to values of low OA/rBC. More specifically, the MAC values at high OA/rBC for the PAXblue and PAXgreen were 2.6 and 2.3 times the values at low OA/rBC, respectively. Also at high OA/rBC the MAC values of the MAAP and the aethalometer were 1.7 and 2.2 times the values at low OA/rBC. The increase of the OA mass concentration in the system has a strong effect on the measurements of the optical instruments, probably due to the increase of the thickness of the OA coating of the BC core or due to the existence of absorbing OA (brown carbon). The Absorption Angström exponent (AAE) calculated from the aethalometer data ranged from 0.9 to 1.4 across the experiments, which does not support the presence of brown carbon (BrC), but does not exclude it either (Lack and Cappa Citation2010). These results also show that the factory-default MAC values used to report the aethalometer, MAAP, and PAX measurements are not representative of the biomass burning emissions studied here. For high OA/rBC the MAC values were 0.6 to 2 times the default values depending on the instrument. For low OA/rBC the MAC values were 0.3 to 0.8 times the default MAC values.
We also compared the instruments that measure the eBC mass using the optical properties of the particles, at high and low OA/rBC using the results of Experiments 9–15 (). For low OA/rBC (Experiments 9 and 10) the average discrepancies ranged from 2 to 15%, with the aethalometer giving the highest values and the PAXblue the lowest measurements of eBC. For high OA/rBC (Experiments 11–15) the discrepancies increased varying from 4 to 46%, with the aethalometer measuring the highest and the MAAP the lower eBC mass. Thus, for low OA/rBC there is, as expected, better agreement among the optical instruments. The increase of the OA mass concentration led to significant discrepancies among the eBC mass measurements of the optical instruments reaching more than 40%.
Table 2. Comparison of eBC measurements.
The instrument comparisons in have been based on the assumption of a zero intercept. We repeated these comparisons relaxing this constraint and the results are summarized in . In all low OA/rBC cases the changes in the slopes of the corresponding regressions were less than 5% when a non-zero intercept was allowed. The changes were a little higher for the high OA/rBC comparisons not involving the MAAP. For the comparisons of the MAAP with the other instruments in the high OA/rBC regime the changes in the slopes were around 30% suggesting the existence of non-linearity in the response of the instruments.
4. Comparison with previous studies
The ratio of MAAP eBC to the rBC for low OA/rBC was 37% lower than the ratio for the uncoated soot measured by Slowik et al. (Citation2007). The ratio of eBC from the MAAP to the rBC for 0.1 < OA/BC < 0.7 that they reported was similar (7% lower) than the ratio that we measured for similar conditions.
The ratio of eBC mass measured by the aethalometer to the eBC mass measured by the MAAP for high OA/rBC in this study was also consistent (14% higher) with the ratio for diesel exhaust with OA/BC = 0.1–0.4 reported by Chirico et al. (Citation2010).
Massoli et al. (Citation2015) reported a ratio of the ambient rBC mass concentration measured by the SP-AMS to the SP2 of 0.55 (range 0.2–1) assuming CErBC=1 for a campaign average of non-rBC coating to rBC mass ratio (Non-rBC/rBC) equal to 10. Collier et al. (Citation2018) reported an SP-AMS to SP2 ratio of 0.37, for CErBC=1 for a campaign average of Non-rBC/rBC equal to 0.42. In this study the SP-AMS values, assuming CErBC=1, were 37% of the SP2 ones for a Non-rBC/rBC = OA/rBC (OA mass is based on SP-AMS measurements and rBC mass is based on SP2 measurements) ranging from 0.02 to 0.36.
5. Conclusions
The objective of this study is the inter-comparison of commercial BC instruments that are used widely for atmospheric measurements in a relatively well constrained yet complex laboratory environment using biomass burning emissions with OA/rBC < 0.7.
A CE of 0.35 was estimated for the SP-AMS rBC by using the beam-width probe analysis. The corrected SP-AMS rBC mass concentration measurements were compared with the SP2 measurements. The two instruments agreed within 6% suggesting that the CE of the SP-AMS for the BC mass measurements was affected mainly by the shape of the particles.
The eBC mass concentration measured by the optical instruments was compared with the corrected rBC mass concentration measured by the SP-AMS during high and low OA/rBC experiments. For the high OA/rBC experiments the ratio of eBC mass to the corrected rBC mass was higher (ratios ranging from 1.34 to 2.72) than for the experiments in which OA/rBC was low (ratios ranging from 0.8 to 1). The presence of high OA concentrations in this system can lead to an overestimation of the eBC mass by a factor of 2.7.
New MAC values were calculated for the two OA/rBC regimes for all optical instruments. At high OA/rBC ratios the MAC values were higher (MAC = 9–20.9 m2 g−1) than at low OA/rBC (MAC = 4.4–8.1 m2 g−1). The OA/rBC ratio has a significant effect on the measurements of the optical instruments, due to the increase of the thickness of the OA coating of the BC core or to existence of absorbing activity of OA (BrC).
For the low OA/rBC regime the measurements of eBC mass of the optical instruments were more consistent (slope ranging from 0.85 to 0.98) than for the high OA/rBC conditions (slope ranging from 0.74 to 1.46). For low OA/rBC the aethalometer gave the highest measurements and the PAXblue the lowest measurements of eBC mass, while for high OA/rBC the aethalometer gave the highest measurements and the MAAP the lowest measurements of eBC.
Supplemental Material
Download Zip (425.2 KB)Additional information
Funding
Related Research Data
References
- Adachi, K., S. H. Chung, and P. R. Buseck. 2010. Shapes of Soot Aerosol Particles, and Implications for Their Effects on Climate. J. Geophys. Res. 115 (D15):D15206. doi:10.1029/2009JD012868.
- Ahern, A. T., R. Subramanian, G. Saliba, E. M. Lipsky, N. M. Donahue, and R. C. Sullivan. 2016. Effect of Secondary Organic Aerosol Coating Thickness on the Real-Time Detection and Characterization of Biomass-Burning Soot by Two Particle Mass Spectrometers. Atmos. Meas. Tech. 9 (12):6117–37. doi:10.5194/amt-9-6117-2016.
- Aiken, A. C., P. F. DeCarlo, J. H. Kroll, D. R. Worsnop, J. A. Huffman, K. S. Docherty, I. M. Ulbrich, C. Mohr, J. R. Kimmel, D. Sueper, Y. Sun, Q. Zhang, A. Trimborn, M. Northway, P. J. Ziemann, M. R. Canagaratna, T. B. Onasch, M. R. Alfarra, A. S. H. Prevot, J. Dommen, J. Duplissy, A. Metzger, U. Baltensperger, and J. L. Jimenez. 2008. O/C and OM/OC Ratios of Primary, Secondary, and Ambient Organic Aerosols with High-Resolution Time-of-Flight Aerosol Mass Spectrometry. Environ. Sci. Technol. 42 (12):4478–85. doi:10.1021/es703009q.
- Arnott, W. P., H. Moosmüller, C. F. Rogers, T. Jin, and R. Bruch. 1999. Photoacoustic Spectrometer for Measuring Light Absorption by Aerosol: Instrument Description. Atmos. Environ. 33 (17):2845–52. doi:10.1016/S1352-2310(98)00361-6.
- Bond, T. C., S. J. Doherty, D. W. Fahey, P. M. Forster, T. Berntsen, B. J. DeAngelo, M. G. Flanner, S. Ghan, B. Kärcher, D. Koch, S. Kinne, Y. Kondo, P. K. Quinn, M. C. Sarofim, M. G. Schultz, M. Schulz, C. Venkataraman, H. Zhang, S. Zhang, N. Bellouin, S. K. Guttikunda, P. K. Hopke, M. Z. Jacobson, J. W. Kaiser, Z. Klimont, U. Lohmann, J. P. Schwarz, D. Shindell, T. Storelvmo, S. G. Warren, and C. S. Zender. 2013. Bounding the Role of Black Carbon in the Climate System: A Scientific Assessment. J. Geophys. Res. Atmos. 118 (11):5380–552. doi:10.1002/jgrd.50171.
- Bruns, E. A., M. Krapf, J. Orasche, Y. Huang, R. Zimmermann, L. Drinovec, G. Močnik, I. El-Haddad, J. G. Slowik, J. Dommen, U. Baltensperger, and A. S. H. Prévôt. 2015. Characterization of Primary and Secondary Wood Combustion Products Generated Under Different Burner Loads. Atmos. Chem. Phys. 15 (5):2825–41. doi:10.5194/acp-15-2825-2015.
- Cappa, C. D., D. A. Lack, J. B. Burkholder, and A. R. Ravishankara. 2008. Bias in Filer-Based Aerosol Light Absorption Measurements due to Organic Aerosol Loading: Evidence from Laboratory Measurements. Aerosol. Sci. Tech. 42 (12):1022–32. doi:10.1080/02786820802389285.
- Cappa, C. D., T. B. Onasch, P. Massoli, D. R. Worsnop, T. S. Bates, E. S. Cross, P. Davidovits, J. Hakala, K. L. Hayden, B. T. Jobson, K. R. Kolesar, D. A. Lack, B. M. Lerner, S.-M. Li, D. Mellon, I. Nuaaman, J. S. Olfert, T. Petäjä, P. K. Quinn, C. Song, R. Subramanian, E. J. Williams, and R. A. Zaveri. 2012. Radiative Absorption Enhancements due to the Mixing State of Atmospheric Black Carbon. Science 337 (6098):1078–81. doi:10.1126/science.1223447.
- Chakrabarty, R. K., H. Moosmüller, M. A. Garro, W. P. Arnott, J. W. Walker, R. A. Susott, R. E. Babbitt, C. E. Wold, E. N. Lincoln, and W. M. Hao. 2006. Emissions from the Laboratory Combustion of Wildland Fuels: Particle Morphology, and Size. J. Geophys. Res. 111 (D7):D07204. doi:10.1029/2005JD006659.
- Chan, T. W., J. R. Brook, G. J. Smallwood, and G. Lu. 2011. Time-Resolved Measurements of Black Carbon Light Absorption Enhancement in Urban and Near-Urban Locations of Southern Ontario, Canada. Atmos. Chem. Phys. 11 (20):10407–32. doi:10.5194/acp-11-10407-2011.
- Chirico, R., P. F. DeCarlo, M. F. Heringa, T. Tritscher, R. Richter, A. S. H. Prevôt, J. Dommen, E. Weingartner, G. Wehrle, M. Gysel, M. Laborde, and U. Baltensperger. 2010. Impact of After Treatment Devices on Primary Emissions and Secondary Organic Aerosol Formation Potential From in-use Diesel Vehicles: Results from Smog Chamber Experiments. Atmos. Chem. Phys. 10 (23):11545–63. doi:10.5194/acp-10-11545-2010.
- Collier, S., L. R. Williams, T. B. Onasch, C. D. Cappa, X. Zhang, L. M. Russell, C.-L. Chen, K. J. Sanchez, D. R. Worsnop, and Q. Zhang. 2018. Influence of Emissions and Aqueous Processing on Particles Containing Black Carbon in a Polluted Urban Environment: Insights from a Soot Particle—Aerosol Mass Spectrometer. J. Geophys. Res. Atmos. 123 (12):6648. doi: 10.1002/2017JD027851.
- Cross, E. S., T. B. Onasch, A. Ahern, W. Wrobel, J. G. Slowik, J. Olfert, D. A. Lack, P. Massoli, C. D. Cappa, J. P. Schwarz, J. R. Spackman, D. W. Fahey, A. Sedlacek, A. Trimborn, J. T. Jayne, A. Freedman, L. R. Williams, N. L. Ng, C. Mazzoleni, M. Dubey, B. Brem, G. Kok, R. Subramanian, S. Freitag, A. Clarke, D. Thornhill, L. C. Marr, C. E. Kolb, D. R. Worsnop, and P. Davidovits. 2010. Soot Particle Studies—Instrument Inter-Comparison—Project Overview. Aerosol Sci. Technol. 44 (8):592–611. doi:10.1080/02786826.2010.482113.
- DeCarlo, P. F., J. G. Slowik, D. R. Worsnop, P. Davidovits, and J. L. Jimenez. 2004. Particle Morphology and Density Characterization By Combined Mobility and Aerodynamic Diameter Measurements. Part 1: Theory. Aerosol Sci. Technol. 38 (12):1185–205. doi:10.1080/027868290903907.
- DeCarlo, P. F., J. R. Kimmel, A. Trimborn, M. J. Northway, J. T. Jayne, A. C. Aiken, M. Gonin, K. Fuhrer, T. Horvath, K. S. Docherty, D. R. Worsnop, and J. L. Jimenez. 2006. Field-Deployable, High-Resolution, Time-of-Flight Aerosol Mass Spectrometer. Anal. Chem. 78 (24):8281–9. doi:10.1021/ac061249n.
- Docherty, K. S., M. Jaoui, E. Corse, J. L. Jimenez, J. H. Offenberg, M. Lewandowski, and T. E. Kleindienst. 2013. Collection Efficiency of the Aerosol Mass Spectrometer For Chamber-Generated Secondary Organic Aerosols. Aerosol. Sci. Tech. 47 (3):294–309. doi:10.1080/02786826.2012.752572.
- Eriksson, A. C., E. Z. Nordin, R. Nystrom, E. Pettersson, E. Swietlicki, C. Bergvall, R. Westerholm, C. Boman, and J. H. Pagels. 2014. Particulate PAH Emissions from Residential Biomass Combustion: Time-Resolved Analysis with Aerosol Mass Spectrometry. Environ. Sci. Technol. 48 (12):7143–50. doi:10.1021/es500486j.
- Heberlein, J., O. Postel, S. Girshick, P. McMurry, W. Gerberich, D. Iordanoglou, F. Di Fonzo, D. Neumann, A. Gidwani, M. Fan, and N. Tymiak. 2001. Thermal Plasma Deposition of Nanophase Hard Coatings. Surface Coatings Technol. 142-144: 265–71. doi:10.1016/S0257-8972(01)01138-0.
- Hennigan, C. J., M. A. Miracolo, G. J. Engelhart, A. A. May, A. A. Presto, T. Lee, A. P. Sullivan, G. R. McMeeking, H. Coe, C. E. Wold, W. M. Hao, J. B. Gilman, W. C. Kuster, J. de Gouw, B. A. Schichtel, J. L. Collett, Jr., S. M. Kreidenweis, and A. L. Robinson. 2011. Chemical and Physical Transformations of Organic Aerosol from the Photo-Oxidation of Open Biomass Burning Emissions in an Environmental Chamber. Atmos. Chem. Phys. 11 (15):7669–86. doi:10.5194/acp-11-7669-2011.
- Holder, A. L., G. S. W. Hagler, T. L. B. Yelverton, and M. D. Hays. 2014. On-Road Black Carbon Instrument Intercomparison and Aerosol Characteristics by Driving Environment. Atmos. Environ. 88: 183–91. doi:10.1016/j.atmosenv.2014.01.021.
- Huffman, J., J. T. Jayne, F. Drewnick, A. C. Aiken, T. B. Onasch, D. R. Worsnop, and J. Jimenez. 2005. Design, Modeling, Optimization, and Experimental Tests of a Particle Beam Width Probe for the Aerodyne Aerosol Mass Spectrometer. Aerosol. Sci. Tech. 39 (12):1143–63. doi:10.1080/02786820500423782.
- Huntzicker, J. J., R. L. Johnson, J. J. Shah, and R. A. Cary. 1982. Analysis of Organic and Elemental Carbon in Ambient Aerosols by a Thermal-Optical Method. In Particulate Carbon: Atmospheric Life Cycle, eds. G. T. Wolff and R. L. Klimisch, 79–88. Boston, MA: Springer.
- Jacobson, M. Z. 2001. Strong Radiative Heating Due to the Mixing State of Black Carbon in Atmospheric Aerosols. Nature 409 (6821):695–7. doi:10.1038/35055518.
- Jayne, J. T., D. C. Leard, X. F. Zhang, P. Davidovits, K. A. Smith, C. E. Kolb, and D. R. Worsnop. 2000. Development of an Aerosol Mass Spectrometer for Size and Composition Analysis of Submicron Particles. Aerosol. Sci. Technol. 33 (1-2):49–70. doi:10.1080/027868200410840.
- Kane, D. B., and M. V. Johnston. 2000. Size and Composition Biases on the Detection of Individual Ultrafine Particles by Aerosol Mass Spectrometry. Environ. Sci. Technol. 34 (23):4887–93. doi:10.1021/es001323y.
- Katrinak, K. A., P. Rez, P. R. Perkes, and P. R. Buseck. 1993. Fractal Geometry of Carbonaceous Aggregates from an Urban Aerosol. Environ. Sci. Technol. 27 (3):539–47. doi:10.1021/es00040a013.
- Kirchstetter, T. W., and T. Novakov. 2007. Controlled Generation of Black Carbon Particles from a Diffusion Flame and Applications in Evaluating Black Carbon Measurement Methods. Atmos. Environ. 41 (9):1874–88. doi:10.1016/j.atmosenv.2006.10.067.
- Lack, D. A., J. M. Langridge, R. Bahreini, C. D. Cappa, A. N. Middlebrook, and J. P. Schwarz. 2012. Brown Carbon and Internal Mixing in Biomass Burning Particles. Proc. Natl. Acad. Sci. USA 109 (37):14802–7. doi:10.1073/pnas.1206575109.
- Lack, D. A., and C. D. Cappa. 2010. Impact of Brown and Clear Carbon on Light Absorption Enhancement, Single Scatter Albedo and Absorption Wavelength Dependence of Black Carbon. Atmos. Chem. Phys. 10 (9):4207–20. doi:10.5194/acp-10-4207-2010.
- Lack, D. A., C. D. Cappa, D. S. Covert, T. Baynard, P. Massoli, B. Sierau, T. S. Bates, P. K. Quinn, E. R. Lovejoy, and A. R. Ravishankara. 2008. Bias in Filter-Based Aerosol Light Absorption Measurements Due to Organic Aerosol Loading: Evidence from Ambient Measurements. Aerosol. Sci. Tech 42 (12):1033–41. doi:10.1080/02786820802389277.
- Lack, D. A., E. R. Lovejoy, T. Baynard, A. Pettersson, and A. R. Ravishankara. 2006. Aerosol Absorption Measurement Using Photoacoustic Spectroscopy: Sensitivity, Calibration, and Uncertainty Developments. Aerosol. Sci. Tech. 40 (9):697–708. doi:10.1080/02786820600803917.
- Liu, S., A. C. Aiken, K. Gorkowski, M. K. Dubey, C. D. Cappa, L. R. Williams, S. C. Herndon, P. Massoli, E. C. Fortner, P. S. Chhabra, W. A. Brooks, T. B. Onasch, J. T. Jayne, D. R. Worsnop, S. China, N. Sharma, C. Mazzoleni, L. Xu, N. L. Ng, D. Liu, J. D. Allan, J. D. Lee, Z. L. Fleming, C. Mohr, P. Zotter, S. Szidat, and A. S. H. Prevot. 2015. Enhanced Light Absorption by Mixed Source Black and Brown Carbon Particles in UK Winter. Nat. Commun. 6 (1):8435–5. doi:10.1038/ncomms9435.
- Liu, P., P. J. Ziemann, D. B. Kittelson, and P. H. McMurry. 1995. Generating Particle Beams of Controlled Dimensions and Divergence. 2. Experimental Evaluation of Particle Motion in Aerodynamic Lenses and Nozzle Expansions. Aerosol Sci. Technol. 22 (3):293–324. doi:10.1080/02786829408959748.
- Massoli, P., T. B. Onasch, C. D. Cappa, I. Nuamaan, J. Hakala, K. Hayden, S.-M. Li, D. T. Sueper, T. S. Bates, P. K. Quinn, J. T. Jayne, and D. R. Worsnop. 2015. Characterization of Black Carbon-Containing Particles from Soot Particle Aerosol Mass Spectrometer Measurements on the R/V Atlantis during CalNex 2010. J. Geophys. Res. Atmos. 120 (6):2575–93. doi:10.1002/2014JD022834.
- Matthew, B. M., A. M. Middlebrook, and T. B. Onasch. 2008. Collection Efficiencies in an Aerodyne Aerosol Mass Spectrometer as a Function of Particle Phase or Laboratory Generated Aerosols. Aerosol. Sci. Tech. 42 (11):884–98. doi:10.1080/02786820802356797.
- Medalia, A. I., and F. A. Heckman. 1969. Morphology of Aggregates—II. Size, and Shape Factors of Carbon Black Aggregates from Electron Microscopy. Carbon 7 (5):567–82. doi:10.1016/0008-6223(69)90029-3.
- Melton, L. A. 1984. Soot Diagnostics Based on Laser Heating. Appl. Opt. 23 (13):2201–8.
- Middlebrook, A. M., R. Bahreini, J. L. Jimenez, and M. R. Canagaratna. 2012. Evaluation of Composition-Dependent Collection Efficiencies for the Aerodyne Aerosol Mass Spectrometer Using Field Data. Aerosol. Sci. Tech. 46 (3):258–71. doi:10.1080/02786826.2011.620041.
- Olfert, J., and N. Collings. 2005. New Method for Particle Mass Classification: The Couette Centrifugal Particle Mass Analyzer. J. Aerosol Sci. 36 (11):1338–52. doi:10.1016/j.jaerosci.2005.03.006.
- Onasch, T. B., A. Trimborn, E. C. Fortner, J. T. Jayne, G. L. Kok, L. R. Williams, P. Davidovits, and D. R. Worsnop. 2012. Soot Particle Aerosol Mass Spectrometer: Development, Validation, and Initial Application. Aerosol. Sci. Tech. 46 (7):804–17. doi:10.1080/02786826.2012.663948.
- Ortega, A. M., D. A. Day, M. J. Cubison, W. H. Brune, D. Bon, J. A. de Gouw, and J. L. Jimenez. 2013. Secondary Organic Aerosol Formation and Primary Organic Aerosol Oxidation from Biomass Burning Smoke in a Flow Reactor during FLAME-3. Atmos. Chem. Phys. 13 (22):11551–71. doi:10.5194/acp-13-11551-2013.
- Park, K., D. B. Kittelson, M. R. Zachariah, and P. H. McMurry. 2004. Measurement of Inherent Material Density of Nanoparticle Agglomerates. J. Nanopart. Res. 6(2/3):267–72. doi:10.1023/B:NANO.0000034657.71309.e6.
- Petzold, A., H. Kramer, and M. Schönlinner. 2002. Continuous Measurement of Atmospheric Black Carbon Using a Multi-Angle Absorption Photometer. Environ. Sci. Pollut. Res. 4:78–82.
- Petzold, A., and M. Schönlinner. 2004. Multi-Angle Absorption Photometry––A New Method for the Measurement of Aerosol Light Absorption and Atmospheric Black Carbon. J. Aerosol Sci. 35 (4):421–41. doi:10.1016/j.jaerosci.2003.09.005.
- Petzold, A., H. Schloesser, P. Sheridan, W. Arnott, J. Ogren, and A. Virkkula. 2005. Evaluation of Multiangle Absorption Photometry for Measuring Aerosol Light Absorption. Aerosol. Sci. Tech. 39 (1):40–51. doi:10.1080/027868290901945.
- Petzold, A., J. A. Ogren, M. Fiebig, P. Laj, S.-M. Li, U. Baltensperger, T. Holzer-Popp, S. Kinne, G. Pappalardo, N. Sugimoto, C. Wehrli, A. Wiedensohler, and X.-Y. Zhang. 2013. Recommendations for the Interpretation of “Black Carbon” Measurements. Atmos. Chem. Phys. 13 (16):8365–79. doi:10.5194/acp-13-8365-2013.
- Ramanathan, V., and G. Carmichael. 2008. Global and Regional Climate Changes Due to Back Carbon. Nature Geosci. 1 (4):221–7. doi:10.1038/ngeo156.
- Saleh, R., E. S. Robinson, D. S. Tkacik, A. T. Ahern, S. Liu, A. C. Aiken, R. C. Sullivan, A. A. Prest, K. D. Manvendra, R. J. Yokelson, N. M. Donahue, and A. L. Robinson. 2014. Brownness of Organics in Aerosols from Biomass Burning Linked to their Black Carbon Content. Nature Geosci. 7 (9):647–50. doi:10.1038/ngeo2220.
- Saliba, G., R. Subramanian, R. Saleh, A. Ahern, E. Lipsky, A. Tasoglou, R. Sullivan, J. Bhandari, C. Mazzoleni, and A. L. Robinson. 2016. Optical Properties of Black Carbon in Cook Stove Emissions Coated with Secondary Organic Aerosols: Measurements and Modeling. Aerosol Sci. Tech. 50 (11):1264–76. doi:10.1080/02786826.2016.1225947.
- Schreiner, J., C. Voigt, K. Mauersberger, P. McMurry, and P. Ziemann. 1998. Aerodynamic Lens System for Producing Particle Beams at Stratospheric Pressures. Aerosol Sci. Technol. 29 (1):50–56. doi:10.1080/02786829808965550.
- Schwarz, J. P., R. S. Gao, D. W. Fahey, D. S. Thomson, L. A. Watts, J. C. Wilson, J. M. Reeves, M. Darbeheshti, D. G. Baumgardner, G. L. Kok, S. H. Chung, M. Schulz, J. Hendricks, A. Lauer, B. Kärcher, J. G. Slowik, K. H. Rosenlof, T. L. Thompson, A. O. Langford, M. Loewenstein, and K. C. Aikin. 2006. Single-Particle Measurements of Midlatitude Black Carbon and Light-Scattering Aerosols from the Boundary Layer to the Lower Stratosphere. J. Geophys. Res. 111 (D16):D16207. doi:10.1029/2006JD007076.
- Seinfeld, J. H. 2008. Black Carbon, and Brown Clouds. Nature Geosci. 1 (1):15–16. doi:10.1038/ngeo.2007.62.
- Slowik, J. G., E. S. Cross, J.-H. Han, P. Davidovits, T. B. Onasch, J. T. Jayne, L. R. Williams, M. R. Canagaratna, D. R. Worsnop, R. K. Chakrabarty, H. Moosmüller, W. P. Arnott, J. P. Schwarz, R.-S. Gao, D. W. Fahey, G. L. Kok, and A. Petzold. 2007. An Inter-Comparison of Instruments Measuring Black Carbon Content of Soot Particles. Aerosol. Sci. Tech. 41 (3):295–314. doi:10.1080/02786820701197078.
- Snelling, D. R., G. J. Smallwood, F. Liu, Ö. L. Gülder, and W. D. Bachalo. 2005. A Calibration-Independent Laser-Induced Incandescence Technique for Soot Measurement by Detecting Absolute Light Intensity. Appl. Optics 44 (31):6773–85. doi:10.1364/AO.44.006773.
- Stephens, M., N. Turner, and J. Sandberg. 2003. Particle Identification by Laser-Induced Incandescence in a Solid-State Laser Cavity. Appl. Opt. 42 (19):3726–36.
- Subramanian, R., A. Y. Khlystov, and A. L. Robinson. 2006. Effect of Peak Inert-Mode Temperature on Elemental Carbon Measured Using Thermal-Optical Analysis. Aerosol Sci. Technol. 40 (10):763–780. doi:10.1080/02786820600714403.
- Tasoglou, A., Saliba, G. Subramanian R., and S. N. Pandis. 2017. Absorption of Chemically Aged Biomass Burning Carbonaceous Aerosol. J. Aerosol. Sci. 113: 141–52. doi: 10.1016/j.jaerosci.2017.07.011.
- Tobias, H. J., P. M. Kooiman, K. S. Docherty, and P. J. Ziemann. 2000. Real-Time Chemical Analysis of Organic Aerosols Using a Thermal Desorption Particle Beam Mass Spectrometer. Aerosol. Sci. Technol. 33 (1-2):170–90. doi: 10.1080/027868200410912.
- Watson, J. G., J. C. Chow, and L.-W. A. Chen. 2005. Summary of Organic and Environmental Carbon/Black Carbon Analysis Methods and Intercomparisons. Aerosol Air Qual. Res. 5 (1):65–102. doi:10.4209/aaqr.2005.06.0006.
- Weingartner, E., H. Saathoff, M. Schnaiter, N. Streit, B. Bitnar, and U. Baltensperger. 2003. Absorption of Light by Soot Particles: Determination of the Absorption Coefficient by Means of Aethalometers. J. Aerosol. Sci. 34 (10):1445–63. doi:10.1016/S0021-8502(03)00359-8.
- Weingartner, E., H. Burtscher, and U. Baltensperger. 1997. Hygroscopic Properties of Carbon and Diesel Soot Particles. Atmos. Environ. 31 (15):2311–27. doi:10.1016/S1352-2310(97)00023-X.
- Willis, M. D., A. K. Lee, Y. T. B. Onasch, E. C. Fortner, L. R. Williams, A. T. Lambe, D. R. Worsnop, and J. P. D. Abbatt. 2014. Collection Efficiency of the Soot-Particle Aerosol Mass Spectrometer (SP-AMS) for Internally Mixed Particulate Black Carbon. Atmos. Meas. Tech. 7:4507–4516. doi:10.5194/amt-7-4507-2014.