
Abstract
Particle deposition and reentrainment experiments were performed in a two-stage electrostatic precipitator (ESP), consisting of positive corona precharger and collecting electrode sections. Attention was focused on studying the indoor air pollution deposition and reentrainment into six size ranges from 0.3 to >10 μm. Tests were performed in an office room (200 m3) for airflow velocities from 1.4 to 8 m/s. The effect of airflow velocity on the collection efficiency of the ESP was investigated both experimentally and analytically to study reentrainment phenomena in a turbulent flow. A stationary two-dimensional analytical model was carried out by modeling the particle transport. The boundary conditions for charged particles on collecting and repelling electrodes were determined by physical considerations, including chaotic and drift motions, the reflection of charged particles from a surface, and the reentrainment of charged particles. A decrease in the experimental collection efficiency for large particle diameters (≥0.5 μm), as compared to the theoretical prediction, was interpreted as the reentrainment of particles. The size-resolved dust reentrainment fluxes from the collecting electrode were evaluated in two limiting cases, considering that either the reentrained particles are not charged or that they are charged as the particles in the deposition flux. Dimensional analysis is applied to these results, introducing the wall friction velocity as a universal parameter that determines the flow character. In general, the particles with diameters <5 μm and >5 μm exhibit different reentrainment behavior.
Copyright © 2018 American Association for Aerosol Research
Editor:
1. Introduction
Inhalation of airborne particles smaller than 10 μm in diameter may adversely affect human health (Pope Citation2000). The electrostatic precipitators (ESP) are commonly used to remove particles in residential, commercial, and medical indoor premises. They can handle large gas volumes and efficiently collect a wide range of particle sizes, including various pathogenic microorganisms that can be present indoor (Verdier et al. Citation2014; Liu et al. Citation2015). However, the collection efficiency in ESP often decreases for particles larger than 1 μm (Zukeran et al. Citation1999; Yasumoto et al. Citation2008; Kawakami et al. Citation2011; Abdel-Salam et al. Citation2015). The cause of the decrease in the collection efficiency is explained by the reentrainment of particles during ESP operation. It is also important to keep in mind that the reentrainment is a secondary source of pollutants and pathogenic microorganisms, which can remain viable (Abramova et al. Citation2006) and, possibly, may mutate under the corona discharge conditions. The particle size is important for the reentrainment rate across all tested conditions. Although differences exist in reentrainment and resuspension rates depending on the types of particles and the indoor surface characteristics, the resuspension rate usually increases for particle sizes in the range of 0.5–10 μm (Salimifard et al. Citation2017). This trend has been observed in several other previous studies (Gomes, Freihaut, and Bahnfleth Citation2007; Qian and Ferro Citation2008; Qian, Peccia, and Ferro Citation2014).
To study the particle reentrainment behavior of airborne dust particles, the ESP (Islamov and Krishtafovich Citation2013) consisting of a positive corona precharger section and a collecting electrode section wherein the distribution of the electric field is uniform and the ionic space charge is absent was used. When the adhesion between the collected particles and the collecting electrodes is not strong enough, the collected particles could reenter into the environment due to passing airflow, erosion, and external disturbances such as air puffs or vibrations.
Simple geometry of the ESP tested makes it possible to use a stationary two-dimensional analytical model of the particle transport by assuming a constant (but not necessarily isotropic) turbulent diffusivity depending on the friction velocity and the size of the channel. The principal advantage of analytical models is the simplicity and the total absence of the computational diffusion. The turbulent diffusivity and the charge of dust particles are key factors for the efficiency of the ESPs. Particle charging was described by both field and diffusion charging.
Despite an abundance of experimental and theoretical work on the electrostatic precipitation process in the literature, the particle reentrainment from the collecting electrodes of ESPs has been rarely discussed. The present article considers two cases of the size-resolved particle reentrainment: from clean and dust-loaded collecting electrodes. In the steady-state regime, the reentrainment of particles occurs simultaneously with the deposition of particles, when properties of the upper (latest) dust deposit may be considered as unaltered. An analytical convection diffusion model with the boundary conditions including the reentrainment of charged particles is used to calculate the spatial particle distribution and to analyze factors influencing the experimental ESP collection efficiency.
2. Materials and methods
2.1. Experimental setup and measurements
The tested office room is on the third floor, and its volume is about 200 m3 (6.0 × 6.7 × 5.0 m3). There was neither forced ventilation or air conditioning system in use nor particle-generating activity indoors, and the particle concentrations were relatively stable. Air infiltration through leaky doors and windows was the dominant source of indoor particles.
All experiments were carried out at ambient temperature, using a two-stage ESP with co-flow, wire-rod precharger combined with parallel-plate collecting electrodes schematically shown in . The experimental widetype ESP includes a plurality of corona-forming wire electrodes (or, more properly, the corona parts of a unified wire) and a plurality of ion collecting electrodes and is of the regular type with a geometry unbounded crosswise. The electrode system consists of the nine equidistant parallel 100-μm wire electrodes in a plane, the ten equidistant parallel plate collecting electrodes of aluminum, each of length l along the flow direction, and the nine plate repelling electrodes of aluminum, each between two collecting electrodes. The portion of the plate electrodes nearest corona electrodes is in the form of a cylindrical solid with a diameter of 5 mm (see ). Specific to this design are the precharger's passive electrodes mounted at the up-stream edges of the collecting electrodes. This electrode system is connected to a dc high-voltage source. A positive corona discharge was used to charge particles in the precharger, since positive ionization results in lower O3 and N2O emissions compared to the negative corona discharge (Brandvold, Martinez, and Dogruel Citation1989). The corona discharge current was set to 0.68⋅10−3 A (the corona voltage Δφ ≈ 17600 V). The wire anodes are spaced apart at the distance s and the discharge gap is set to w = 19 mm. The plate positive ion (and dust) collecting cathodes have identical sizes with an active discharge width of B ≈ 0.193 m oriented transverse to the flow. A positive repelling voltage of Δϕ = 5900 V was applied between the collecting and repelling electrodes. The charging and collection sections are set in a rectangular plastic measuring duct with an inner cross-sectional area of 0.193 m × 0.123 m. The long outlet after the electrode system is selected in order to provide the uniform airflow over the cross-section at the end of the duct. In the described ESP, two "identical" separable collection sections (a) with "clean" (that is, initially not exposed) and (b) "dust-loaded" (exposed about 62 h of total ESP operating time before investigation) collecting electrodes were used to study the particle reentrainment. The dust load on these dust-loaded collecting electrodes was evaluated after the experiments, using gravimetric analysis, and the average surface load was about 1.5 g/m2 with a moisture content of 13%. The moisture content was calculated from the difference in weight of a portion of the dust from the surfaces of the collecting electrodes immediately after the precipitation test and drying for 24 h at 54 °C.
Figure 1. Schematic representation of the ESP consisting of nine wire anodes, ten plate cathode electrodes with rods, and nine plate repelling electrodes. An applied dc gap voltage and a variable speed fan drive produce the measured wind V (→). The constructive and flow parameters are given in .
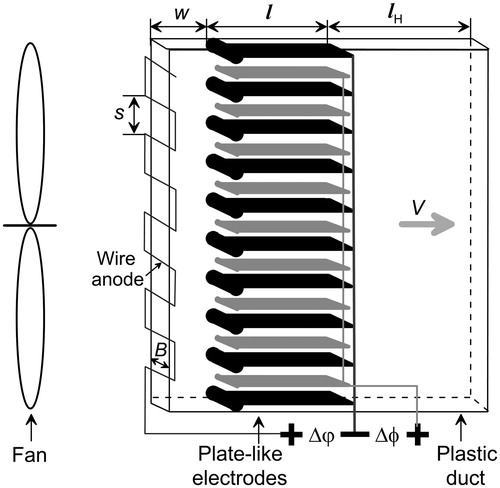
Table 1. Parameters of the ESP (see ).
The electrostatic kilovoltmeter C196 with the accuracy of 1% was used for measuring the discharge and repelling voltages. The total corona current was measured using a digital multimeter (MS8265, Precision Mastech Enterprises Co., Kowloon, Hong Kong) and was additionally monitored directly with the analog microammeter M24. The airflow velocity was measured by a thermo-anemometer (LV110, KIMO, Montpon, France), 100 mm diameter vane probe, in the centerline at the end cross-section of the duct and all the data were averaged over ten measurements. The airborne particle concentration was measured approximately at the center of the measuring duct using an optical particle counter (Handheld 3016 IAQ, Lighthouse Worldwide Solutions, Fremont, USA). The used model was capable of classifying dust particles into six different size ranges (0.3–0.5, 0.5–1.0 1.0–3.0, 3.0–5.0, 5.0–10.0, and ≥10.0 μm). Scheduled inspection of the used HANDHELD 3016 showed that in accordance with the Russian standard R 50.2.047-2005 the limits of the permissible relative error in measuring the counting concentration of aerosol particles were within ±5% in all six size ranges. In the mode selected, the particle counter took a specific sample volume 1 liter every half-minute. The temperature and relative humidity of the flow were also recorded by the Handheld 3016. The ambient temperature was 18.3 °C (standard deviation (s.d.) 0.3 °C) and the air relative humidity (RH) was 18.9% (s.d. 0.4%). At these temperature and humidity (≈2.8 g H2O/m3 air), the values of the air density ρa and air kinematic viscosity νf were taken to be, respectively 1.210 kg/m3 and 1.50·10−5 m2/s (Tsilingiris Citation2008).
2.2. Analytical model
2.2.1. Convective diffusion equation
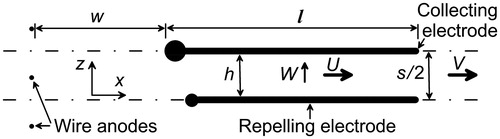
Due to the ESP’s symmetry, only a portion of the ESP was considered in the present computation of dust collection (see ). The convective diffusion equation, derived by time-averaging the steady-state particle continuity equation, is used to model the precipitator shown in and is given as
(1)
where N(x,z) is the number concentration of the particles of diameter d, K and L represent, respectively, the longitudinal and the transverse particle diffusion coefficients, U = u + Wx is the full average particle velocity in the x direction, u is the airflow velocity, and Wx and W ≡ Wz are particle migration velocities in the x and z directions, respectively. The parameters U, W, K, and L are assumed spatially homogeneous. The diffusion coefficient is the sum of the Brownian and turbulent diffusion coefficients. The Brownian diffusion coefficient may be neglected because it is extremely small compared with the turbulent diffusion coefficient for the operating conditions of typical ESPs (Leonard, Mitchner, and Self Citation1980).
Figure 2. Calculation domain of the ESP.
2.2.2. Boundary conditions
Although convective diffusion EquationEquation (1)(1) is popular in precipitator studies, the boundary conditions are still set with some degree of arbitrariness. The types of the boundary conditions are determined by corresponding closure mechanisms used for the particles.
The inlet and outlet boundary conditions for particles are typically given as follows:
(2)
(3)
The boundary conditions for charged particles on the collecting and repelling electrodes can be determined by physical considerations, including the chaotic and drift motions, the charged-particle reflection from the surface, the reentrainment of particles, etc. In the drift-diffusion approximation for the momentum-transfer equations (Huxley and Crompton Citation1974) the charged-particle flux in the z direction Γz has the form
(4)
The impermeability condition for the particle flux Γz = 0 are usually set on the repelling electrode of the precipitator as
(5)
The deposition flux of the particles with fixed charges may be written as the difference of the partial fluxes to and from the surface of the collecting electrode (Huxley and Crompton Citation1974, chapter 5; Islamov Citation1991):
(6)
(7)
(8)
where N+(h) and N–(h) are the concentrations of the dust particles with a respectively positive and negative velocity component vz in the z direction (N = N+ + N–), vT is their mean chaotic velocity. Then, assuming that for the particle velocity distribution function fv in the immediate vicinity of the anode surface is true (Granovskii Citation1952)
(9)
where p is the probability of elastic specular reflection of the charged particles, we obtain that
(10)
In the case when the convection velocity is much slower than the mean chaotic velocity vT of dust particles due to turbulent and thermal motions, we have
(11)
and on the surface of the collecting electrode this gives
(12)
The concentration of dust particles in the immediate vicinity of the collecting electrode surface is actually unknown. The turbulent diffusion coefficient falls to zero through the laminar sublayer (White Citation1999). Leonard, Mitchner, and Self (Citation1980) assumed an uniform turbulent diffusion coefficient up to the wall and used a zero concentration gradient boundary condition for the collecting electrode, that is, Γz = WN. Instead, we have employed boundary condition
(13)
(14)
and hence
(15)
that, in the absence of reflection (p = 0), is equivalent to
used by Leonard, Mitchner, and Self (Citation1980). EquationEquation (15)
(15) coincides with the boundary condition
used by Cooperman (Citation1984), if the factor P in (15) may be considered as equivalent to the reentrainment effect factor fr from Cooperman (Citation1984).
When air flows through the channel, an aerodynamically generated lift and drag forces on the surface may reentrain dust particles deposited on the surface of the collecting electrode. Taking into consideration the reentrainment of particles with fixed charges the boundary condition (13) in the immediate vicinity of the collecting electrode surface can be modified as
(16)
and hence
(17)
where M is the reentrainment flux of the charged particles.
2.2.3. Particular solution of the convective diffusion equation
EquationEquation (1)(1) with the boundary conditions (5) and (17) has a particular solution
(18)
where Pe = hW/L is an electrical Peclet number (Leonard, Mitchner, and Self Citation1980). The average value of the particular solution (18) is then given by
(19)
where ups is introduced as a "particular solution velocity" by the formula
(20)
The general solution N is the general solution Ñ of EquationEquation (1)(1) with the boundary conditions (3), (5), (15), and
(21)
plus the particular solution NM:
(22)
Considering the precipitator with an arbitrary inlet concentration profile Ñ0(z), the following expression for the concentration at any point is derived (Cooperman Citation1984)
(23)
(24)
(25)
where eigenvalues si are determined from the boundary conditions (5) and (15) to be an increasing sequence of all strictly positive roots of the transcendental equation (Cooperman Citation1984)
(26)
Here the functions {Qi, i = 1, 2, …} form a complete orthonormal set of functions. Constants Ai are determined by integrating the Ñ(x, z) defined in EquationEquation (23)(23) at the inlet boundary condition (21):
(27)
In the special case P = 1, using Maple program, we found an extra imaginary eigenvalue from the boundary conditions (5) and (15), namely s* = ±I Pe/2. Then the real complete orthonormal set of functions {Qi, i = 1, 2, …} may be given as
(28)
The analytical expressions (23) for the concentration at any point were easily performed by Maple 7 (Waterloo Maple Inc., Waterloo, Canada). 3000 eigenvalues were used in all calculations.
2.2.4. Particle diffusivities
The major difficulty in the practical use of EquationEquation (1)(1) is in that it involves the particle diffusion or mixing coefficient L in the transverse (z) direction, which may be a function of gas velocity and depend on the large-scale eddies' effects, among other things. The flow patterns in precipitators may be quite complicated (Robinson Citation1976; Yamamoto and Velkoff Citation1981; Cooperman Citation1984), and the coefficients L and K should probably be considered as empirical parameters in order to absorb the effects of inertial mechanisms, large-scale eddies, and secondary flows caused by the complex geometry (see, e.g., ) and the ionic wind (Cooperman Citation1984). The large eddies in the core region and the small variation in turbulent intensity in the central region make the eddy viscosity (Mizushina and Ogino Citation1970; Slaiman, Abu-Khader, and Hasan Citation2007) and so particle diffusivity to be constant (Sehmel Citation1970).
Absence of strong heat sources and an almost uniform electric field between parallel collecting and repelling electrodes allow to neglect the thermal diffusion of particles and their dielectric activity. In surface temperature profile measurements of the corona wire by using a real-time IR thermoimage processing system, it is observed (Ohkubo et al. Citation1990) that the heat generated by corona discharge itself increases the surface temperature of the corona wire by a mere several degrees Centigrade.
Both theory and experiments show that the diffusivity found for the central region and nondimensionalized by the friction velocity and the size of the channel is practically independent of all flow parameters (Mizushina and Ogino Citation1970; Sehmel Citation1970; Nokes and Wood Citation1988; Slaiman, Abu-Khader, and Hasan Citation2007). In the present analysis, it is accepted that the particle diffusivity L in a narrow channel could be calculated by a correlation proposed by Yoo, Lee, and Oh (Citation1997) (see supplementary information [SI] Section S2 for details) and the longitudinal particle diffusion coefficient K = L.
2.2.5. Particle charging and motion models
The charge of dust particles is a key factor for the efficiency of the ESPs. An increase in this charge results in the higher migration velocity in the dust collection section of the precipitator and a better collection of particles. The particle charging system consists of the nine discharge wires and ten parallel cylindrical electrodes (see ). The particles entering into the inlet discharge region "w" were assumed to be neutral in charge. Dust particles flow with air in the positive corona discharge at a velocity V in the x-direction and they will become positively charged. In these theoretical analyses, the combined field and diffusion charging model developed by Lawless (Citation1996) was used to estimate the charge of particles and their migration velocity (see SI Section S3 for details).
2.2.6. Inlet concentration profile for the dust collection section
The inlet particle concentration profile for the dust collection section is provided by the outlet dust flux from the dust charging section. Particles entering the precipitator were assumed to be neutral in charge and uniformly distributed across the channel. These particles travel in the x direction with the gas velocity Vaver and are forced by the average electric field Ez = Δφ/(s2+w2)1/2·s/4/w, assumed constant, to migrate towards the symmetric surface (z = s/2) at the electric migration velocity Wz in the calculation area (z = 0÷s/2) (see ). This migration velocity is a function of the number of elementary charges per particle np depending on the particle diameter and residence time (It is defined in SI Section S3). The Wz is the monotonically increasing function of x achieving the maximum value of Ww at the outlet the charging section.
For a fixed value of the migration velocity Wz, the particle concentration is given as a sum of functions in EquationEquation (23)(23) . In the dust charging section the particle diffusivity Lw is mainly large and so, for a uniform inlet particle concentration profile and impermeability boundary conditions (i.e., with (5) and (15) when formally P = 1), only one dominant mode (the first term) remains in this sum already at a distance Δx considerably smaller than the discharge gap w. It was also found that only this mode has nonzero value of the integral over the particle flux. Thus, the inlet particle concentration profile for the dust collection section is given as
(29)
where the electrical Peclet number Pew corresponds to the outlet of the dust charging section (Pew = (s/2)Ww/Lw) and, of course,
(30)
It should be mentioned that the refinement of the inlet particle concentration profile by EquationEquation (29)(29) only slightly influenced on the ESP collection efficiency because in the used ESP the Peclet number Pew was small at the end of the precharger section and therefore N(x = 0, z) ≈ N0.
3. Results and discussion
3.1. Indoor particle size distribution
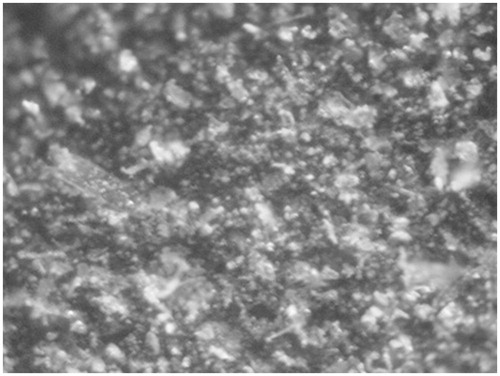
Particle deposition on the electrode surface increased with operating time of the ESP. So the two cases were considered: with the initially clean collecting electrodes and the dust-loaded (62 h of total ESP operating time, about 1.5 g/m2) ones. An image of particles on the dust-loaded electrode is shown in . The particle deposition rate depended on several experimental factors including the particle concentration, air velocity, particle diameter, and electrical ESP parameters.
Figure 3. Typical image of the collecting electrode surface. The transverse size of the image is about 1 mm.
The concentration of the airborne particles was measured in the center of the measuring duct and in the office room at a distance of 1 m before the ESP using the same optical particle counter. A second optical particle counter was also used, but mostly only to control the stability of the airborne particle concentration. When the airflow velocity V = 0 (i.e. the ESP was turned off), the results were statistically identical in all three cases: just before the experimental set up (in front) and before (in front) and after (in duct) the test with the highest airflow velocity (V = 7.42 m/s), excluding the size range >10 μm. The measured concentration of particles with sizes above 10 μm in the center of the measuring duct was significantly lower. shows the averaged cumulative size distributions of the indoor dust particles measured in front of the ESP just before the experimental set up. The size distributions were averaged over the 14 consecutive 30-s measurements.
Figure 4. Cumulative particle size distribution of the indoor dust, together with the 95% standard deviation bars.
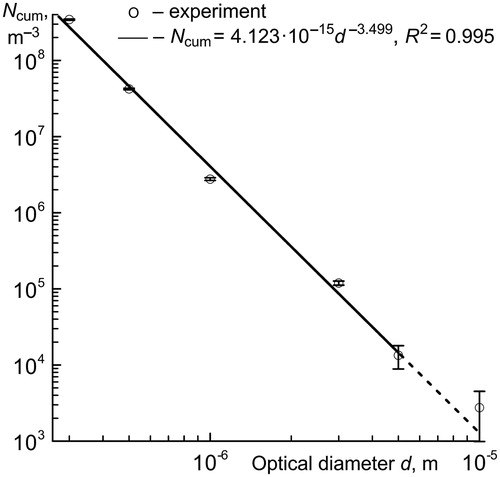
The exact values of the particle concentration in the above-mentioned six size ranges and a rough estimation of the mass fractions are listed in . The particle number concentration above 10 μm is relatively low, and the main fraction of particles is in the size range below 5 μm. The straight line in this double-log graph represents a power fit. Since the particle size distribution function f(d) and cumulative particle size distribution Ncum are formally related by equality the distribution function can be found as f(d) = –dNcum/dd. Hence, the size distribution can still be approximated well by a power function given as
(31)
where the d is in m and f in m−4. The average particle diameters dsi given in were estimated as a weighted average over the particle size range defined by di and di+1 into the six size ranges i = 1 ÷ 6:
(32)
Table 2. Data for the particle size distribution.
3.2. Effect of airflow velocity on the reentrainment and the collection efficiency of the ESP
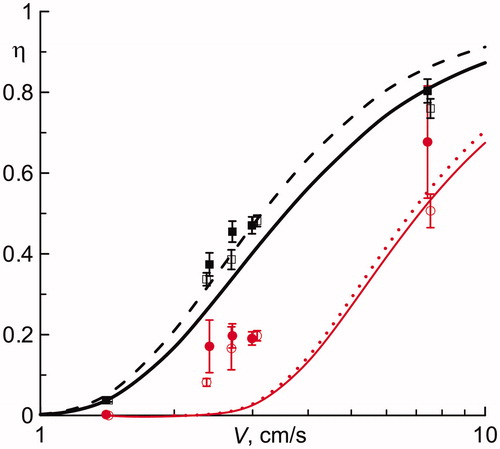
shows the comparison of the particle penetration (one minus the collection efficiency, estimated by comparing the particle size distribution measurements in the upstream and downstream ESP regions) between the analytic predictions and the experimental data. In general, the ESP with the dust-loaded electrodes has a slightly lower collection efficiency than that with the clean electrodes. For the particle size range 0.3–0.5 μm, comparison between the analytical and experimental values shows reasonable agreement (see the corresponding curves for p = 0 and p = 0.24 in ). However, the predictions disagreed with the experimental data for the particle size range 1–3 μm (see the corresponding curves for p = 0 and p = 0.11 in ). The particle reflection coefficients p = 0.24 and p = 0.11 were used from a Monte-Carlo simulation with aerodynamic entrainment forces only (Harris and Davidson Citation2009) for particle diameters about 0.359 and 1.361 microns, respectively. The correction due to the particle reflection coefficient from Harris and Davidson (Citation2009) is insignificant for the particle diameters of 1–20 μm. The aerodynamic entrainment and the momentum transfer from saltating particles becomes important with increasing the friction velocity (Shao Citation2008), and they can provide a noticeable increase in the penetration of particles larger than about 1 μm.
Figure 5. Comparison of the particle penetration between the analytic predictions (lines) and the experimental data with the standard deviation bars for the particle size ranges respectively 0.3–0.5 μm (square symbols) and 1.0–3.0 μm (circle symbols) at the various airflow velocities for the clean (open symbols) and dust-loaded (filled symbols) collecting electrodes. Analytical predictions of particle penetration for the probability of reflection of charged particles p = 0 are shown by solid lines and for the probabilities p = 0.24 and p = 0.11 calculated by Harris and Davidson (Citation2009) for particle diameters about 0.359 and 1.361 microns are shown by dashed and dotted lines, respectively.
Aerodynamic entrainment is initiated by wind detachment, that is, when wind velocity exceeds a certain critical value deposited particles are directly lifted by wind shear stress. The reentrainment flux of detached particles may be written as (Shao Citation2008)
(33)
where u*t is the threshold friction velocity at the surface and the dimensionless constant ζ should be considered to be an adjustable parameter (Shao Citation2008). Shao and Lu (Citation2000) recommended a simple expression for the u*t for particles loosely spread over a horizontal dry bare surface:
(34)
where AN is around 0.0123, σp = ρp/ρa, ρp and ρa are the particle and air densities (in kg/m3), respectively, g = 9.81 m/s2 is the gravitational acceleration, and the values of γ range between 1.65·10−4 and 5·10−4 kg/s2. For multiple-sized soils, Shao, Raupach, and Leys (Citation1996) and Shao (2008) assumed that the dependence of the mass transport on u* and u*t for one particle-size range is not significantly altered by the presence of other particle sizes.
However, the threshold friction velocity depends on many factors, such as dust load, surface roughness, crust formation, aggregate size distribution, moisture conditions, etc. The experimental results (Wu, Davidson, and Russell Citation1992; Zukeran et al. Citation1999; Yasumoto et al. Citation2008; Kawakami et al. Citation2011) show that the reentrainment from dust-loaded electrodes occurred at significantly lower velocities compared with the u*t evaluated from EquationEquation (34)(34) . Model (33)–(34) is useful for evaluating the reentrainment of large particles (d ≥ 5 μm), but for small particles (d < 5 μm) existing models have to be extended to include new features to reproduce these and other experimental results.
shows the variations of the fractional particle penetration as a function of the diameter of the particles for various values of the airflow velocity V. The symbols for the experimental data refer to the mean diameter of the six size ranges. The results show a strong effect of the velocity V on penetration. As mentioned above, the analytical predictions disagreed with the experimental data for larger particles. Decreasing in the experimental collection efficiency for larger particle diameters (>0.5 μm) against the theoretical prediction was interpreted as the reentrainment of particles.
Figure 6. Comparison of the particle penetration between the analytic predictions (lines) and the experimental data, with the standard deviation bars, at the various airflow velocities V for the clean (open symbols) and dust-loaded (solid symbols) collecting electrodes. ––– – the particle reentrainment is missing; - - - - – the particle reentrainment flux is defined by Equations (Equation35(35) ) and (Equation37
(37) ).
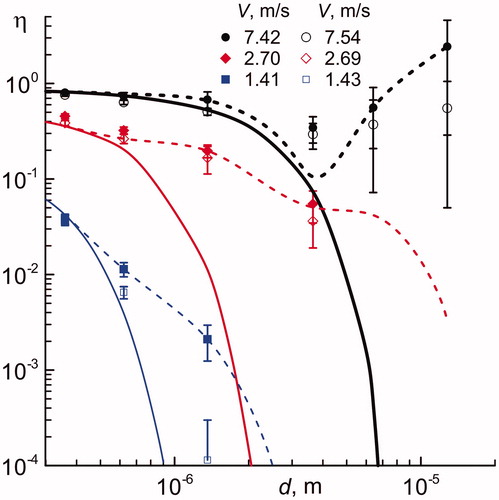
The reentered conductive particles may be completely discharged because they physically touch the metal collecting electrode. Most of these particles will not be collected. The dashed lines in correspond to accounting the reentrainment flux of particles that are assumed fully discharged.
When immediately after the test with the highest airflow velocity (V = 7.42 m/s) the ESP was only turned off, the measured concentration of particles in the center of the measuring duct increased as expected, except for the size range >10 μm. The measured concentration of particles with sizes above 10 μm in the center of the measuring duct shows a statistically significant decrease. Therefore, in the case of the dust-collecting electrodes, the penetration of such particles is indeed greater than 1 at the airflow velocity V = 7.42 m/s (see ). For continuous processes, the particle reentrainment can occur simultaneously with particle deposition. Deposited particles may accumulate on the surface, forming larger particle aggregates (Zukeran et al. Citation1999; Yasumoto et al. Citation2008; Kawakami et al. Citation2011; Abdel-Salam et al. Citation2015), which will likely enhance the reentrainment flux of larger particles. This is compatible with the fact that the collection efficiency for particles larger than 1 ÷ 2 μm was negative in these experimental works.
The ESP in the standard mode (with the purely ionic wind V = 1.41 m) had the high collection efficiency (> 96% for particle sizes >0.3 μm, estimated by comparison of particle size distribution measurements in the upstream and downstream ESP regions). Therefore, the size distribution of the deposited particles should be similar to the size distribution of the airborne dust particles. Also, using digital image analysis, Matsusaka (Citation2015) showed that in turbulent channel flows the resuspension flux is likely to be correlated with the deposition flux. The ratio of the reentrainment flux to the particle concentration (hereunder referred to as the particle reentrainment velocity) is one of the essential characteristics of particle reentrainment. Particle reentrainment fluxes will be evaluated for two simple charging conditions for the reentered particles: fully discharged (zero charge) and fully charged (charged as precharged particles in the deposition flux). The reentrainment flux of the fully discharged particles in the i-th range with the average particle diameter dsi may be estimated as a weighted average of reentrainment velocity over the particle size range defined by di and di+1
(35)
and the cumulative reentrainment flux is
(36)
where F is the dimensionless reentrainment velocity and d7 is chosen equal to 20·10−6 m (see ). Here the reentrainment velocity is nondimensionalized by the friction velocity u*. Since u* is related to the wall shear stress, this velocity is more relevant to reentrainment and makes it possible to compare results from experiments with different flow configurations (Loosmore Citation2003).
In the case of the dust-loaded collecting electrodes the dimensionless reentrainment velocity F for the fully discharged particles is obtained by regression analysis of data for V = 7.42, 2.70, and 1.41 m/s (total 13 points in ) using the model (35):
(37)
(38)
where the d is in m,
is the friction velocity (in m/s) for the collecting electrode section “h,” and fh is the Darcy friction factor (S8) in the SI (It was assumed that the wall-roughness height=0). A scaling function for the F was developed by combining the relationship (33) (neglecting the gravitation term in the threshold friction velocity (34)) for the particle sizes larger than about 5 μm and a scaling relationship for the smaller particle diameters determined by trial and error that best predicts the observed particle penetration η.
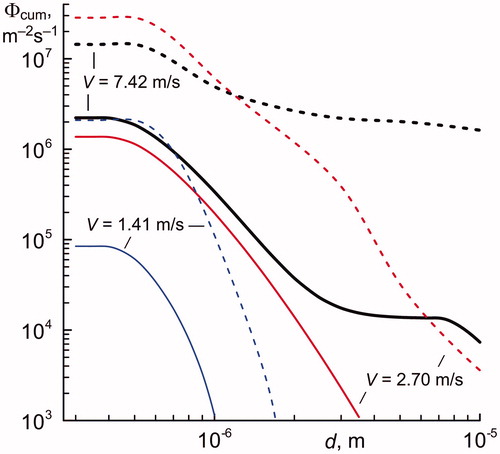
Solid lines in show the corresponding cumulative reentrainment fluxes that were estimated by EquationEquation (36)(36) with the F used in the prediction of the penetration η. The empirical formula (37) allows to describe the experimental penetration η (total 13 points in ) with the coefficient of determination R2 =0.997. A comparison of the particle penetration between the clean and dust-loaded collecting electrodes shows that the reentrainment flux depended only slightly on the dust loading level of the collecting electrodes for the airflow velocity higher than about 2 m/s and the particle sizes less than about 5 μm (see ).
Figure 7. Estimations of the cumulative reentrainment fluxes from the dust-loaded electrode surface under two extreme assumptions: reentrained particles are not charged (solid lines) and they are charged as precharged particles in the deposition flux (dashed lines).
In the case when the dust layer on the collecting plates has a weak electrical conductivity the reentered particles should remain partially charged. Many of these charged particles that enter the gaps are recollected, because the electric field drives these partially charged particles toward the collecting electrode. Nevertheless, for example, under the extreme assumption that reentrained particles are charged as precharged particles in the deposition flux, the outlet concentration cannot be less than the average value of the particular solution (19). So the reentrainment flux of fully charged particles of diameter d needed for the prediction of the experimental results will be described in (17) as
(39)
where F is also the dimensionless reentrainment velocity, but it is nondimensionalized with the help of the particular solution velocity ups defined by EquationEquation (20)
(20) .
The reentrainment flux of the charged particles in the i-th range with the average particle diameter dsi may be estimated as a weighted average over the particle size range defined by di and di+1
(40)
and the cumulative reentrainment flux is
(41)
For comparison, in the cumulative reentrainment fluxes are also shown on the assumption that particles are fully charged and the reentrainment flux M in the boundary condition (17) is determined by (41) with
(42)
The predicted penetration calculated by using EquationEquation (40)(40) is almost the same as for the fully discharged reentrained particles and is not shown in .
It should be noted that very different resuspension fluxes have been measured in different flow and charging conditions (Fairchild and Tillery Citation1982; Fromentin Citation1989; Wen and Kasper Citation1989).
3.2.1. Dependence of the reentrainment velocity F on the particle size and air speed
shows the dimensionless velocities F used to estimate the reentrainment fluxes in . The figure shows that the particle reentrainment velocity strongly depends on the particle diameter and the airflow velocity. When the airflow velocity exceeded about 6 m/s the reentrainment velocity sharply increased for the particle sizes larger than about 5 μm. The corresponding threshold friction velocity, u*t, at which the reentrainment velocity is sharply increased, is consistent with the simple expression (34) for the u*t recommended by Shao and Lu (Citation2000).
Figure 8. The dimensionless velocity F(d) for the reentrainment flux of fully discharged (solid lines – Equation (37)) and fully charged particles (dashed lines – Equation (42)) from the dust-loaded electrode surface. (a) – u* = 0.730 m/s (V = 7.42 m/s), (b) – u* = 0.316 m/s (V = 2.70 m/s), and (c) – u* = 0.211 m/s (V = 1.41 m/s).
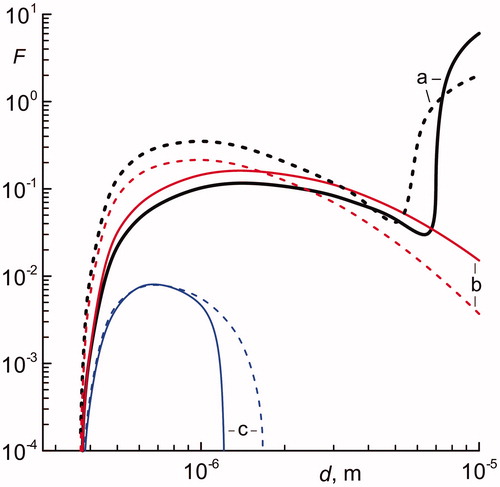
The reentrainment fluxes take place into all six particle size ranges for the airflow velocity higher than about 2 m/s. It should be noted that the local minima (or their absence) of the curves in for the reentrainment velocity correlate with the experimental penetration of particles (see ). In the case of the fully discharged particles the particle reentrainment velocity has highs at the particle diameter of 0.65, 1.44, and 1.48 μm for the airflow velocity of respectively 1.41, 2.70, and 7.42 m/s (see ). In the case of the fully charged particles the reentrainment velocity (dashed lines on ) has local extremes at the smaller particle diameters (0.96 and 5 μm) than for the fully discharged particles at the same airflow velocity of 7.42 m/s.
3.3. Limitation of current work
Theoretically, we can calculate particle reentrainment rate once we obtain the necessary input parameters for the model. However, we acknowledge that it is difficult to obtain or confirm some of the parameters. For instance, the charge of the reentered particle is unknown. Even by the advanced experimental equipment, the discharging process of particle on dust-loaded collecting electrode would also be difficult to monitor. The actual value of the reentrainment flux turns out to be dependent on the charge of reentrained particles. So the reentrainment flux has been estimated under two simple extreme assumptions: reentrained particles are not charged and they are charged as precharged particles in the deposition flux. The experimental observations give the higher reentrainment flux under the assumption that the reentrained particles are charged. Probably, the charge of reentrained particles may depend on moisture, porosity, electrical conductivity of the dust layer, relative permittivity, etc. The reentrained particle diameter values for dielectric particles are smaller than those for metal ones (Abdel-Salam et al. Citation2015). Zukeran et al. (Citation1999) noted that the reentrainment of particles with low resistivity markedly reduces the collection efficiency. More experimental data is needed to determine the exact value of the charge of reentrained particles before a more general conclusion can be made about the actual value of the reentrainment flux.
Spherical particles used in modeling do not necessarily represent particles found in the indoor environment, which may vary considerably in their shapes, surface characteristics, and material compositions. However, they provide a basis for comparing the penetration of particles between measured data and analytical predictions.
The optical particle counter used for the present airborne measurements of aerosol size distributions optically discriminates particle size with the light intensity scattered from each particle illuminated by the laser. Polystyrene latex spheres (the complex refractive index =1.595 + 0.0⋅I for visible light) of several sizes are used by the manufacturer as calibration particles, so that the observed particle size corresponds to the size equivalent to the polystyrene latex sphere (here called the particle optical diameter). Different refractive index effects and nonsphericity of airborne dust particles can reduce the sizing accuracy of the optical particle counter used.
Reentrainment depends on many factors, such as dust load, surface roughness, crust formation, aggregate size distribution, moisture conditions, etc. Particles from the canopy layer of a multilayer deposit resuspend at lower airflow velocities relative to particles in layers closer to the surface (Lazaridis and Drossinos Citation1998; Friess and Yadigaroglu Citation2001; Boor, Siegel, and Novoselac Citation2013). A wind tunnel study by Boor, Siegel, and Novoselac (Citation2013) found that resuspension for 1–20 μm particles occurs at significantly lower velocities for the multilayer deposits (the dust loads of 6.23–20.25 g/m2) than for the monolayer deposits (the dust loads <0.001 g/m2). Resuspension from multilayer deposits achieves the same levels at 5 m/s as those observed for monolayer deposits at 50 m/s. The extending of existing models is needed to include new features to capture these and other experimental results. In this investigation, the reentrainment flux model (33)–(34) developed by Shao (Citation2008) has been extended to analyze the variation of dust reentrainment with the particle diameter d and friction velocity u* for the fully discharged (EquationEquation (37)(37) ) and fully charged particles (EquationEquation (42)
(42) ), respectively. However, EquationEquations (37)
(37) and Equation(42)
(42) are obtained only for a single value of the absolute humidity of the air (≈2.8 g H2O/m3 air), whereas moisture can noticeable change adhesive forces due to capillarity effects.
4. Summary and conclusions
The present study examined the size-resolved airborne-dust reentrainment fluxes containing the particles in the 0.3–≈20 μm size range and induced in the ESP by the airflow. The effect of airflow velocity on the collection efficiency of the ESP was investigated both experimentally and analytically to study the reentrainment phenomena in a turbulent flow. A stationary two-dimensional analytical model was carried out by modeling the particle transport. The charging process was based on the combined field and diffusion charging model. For the collection stage, the particle transfer model included eddy diffusion, turbulent flow, and migration. The boundary conditions for charged particles on the collecting and repelling electrodes were determined by physical considerations, including the chaotic and drift motions, the reflection of charged particles from the surface, and the reentrainment of charged particles.
The reentrainment flux has been estimated under two simple extreme assumptions: reentrained particles are not charged and they are charged as precharged particles in the deposition flux. The decrease in the collection efficiency was interpreted to be caused by reentrainment of particles from the collecting electrodes. When the airflow velocity exceeded about 6 m/s, the particle reentrainment flux sharply increased in the range of sizes larger than about 5 μm. The concentration of downstream particles with large diameters was larger than that upstream of the ESP. In other words, the reentrainment flux of particles with a diameter d[m] larger than ≈4·10−6/(u*[m/s])2 increases sharply, and the collection efficiency can become negative for the 10 μm particles already at a friction velocity u* of about 0.6 ÷ 0.7 m/s. The collection efficiency and the reentrainment flux for ESP operation in the stationary state depends only slightly on the dust loading level of the collecting electrodes for the airflow velocity higher than about 2 m/s and the particle diameter less than about 5 μm. Nevertheless, the collecting electrodes and corona wires should be regularly cleaned to prevent an increase in the corona current and the spark or back discharge ignition at the higher dust loading levels. In the case of the dust loading of 1.5 g/m2 the particle reentrainment velocity for ESP has the highs at the particle diameters of 0.65, 1.44, and 1.48 μm for the airflow velocities of respectively 1.41, 2.70, and 7.42 m/s. In order to make a more general conclusion about the actual value of the reentrainment flux in the ESP more data is needed on the value of the charge of reentrained particles.
| Nomenclature | ||
| B | = | cross-stream active discharge width of the collecting cathodes (m) |
| DH,h | = | hydraulic diameter (m) |
| d | = | particle diameter, optical particle diameter (m) |
| dsi | = | weighted average optical particle diameter over the particle size range defined by di and di+1 (m) |
| E | = | electric field strength (V/m) |
| F | = | dimensionless reentrainment velocity |
| f | = | particle size distribution function (m−4) |
| fh | = | Darcy friction factor for the collecting electrode section "h" |
| fr | = | Cooperman's reentrainment factor (–) |
| fv | = | particle velocity distribution function (s3/m3) |
| g | = | gravitational acceleration (= 9.81 m/s2) |
| H | = | duct height (m) |
| h | = | air-gap between the collecting and repelling electrodes (m) |
| I | = | unit imaginary number |
| K | = | diffusion or mixing coefficient in the x direction (m2/s) |
| L | = | diffusion or mixing coefficient in the z direction (m2/s) |
| l | = | length of the collecting electrodes in the x direction (m) |
| lH | = | length of the outlet part of the measuring duct (m) |
| M | = | reentrainment flux of the charged particles (1/m2/s) |
| N | = | number concentration of the particles of diameter d (1/m3) |
| Ñ | = | general solution of EquationEquation (1) |
| N0 | = | particle number concentration at inlet (x = 0) (1/m3) |
| N± | = | concentration of particles with a positive (+) or negative (–) velocity component vz in the z direction (1/m3) |
| NM | = | particular solution of EquationEquation (1) |
| np | = | number of elementary charges per particle |
| P | = | dimensionless factor (= 2p/(1+p)) |
| Pe | = | electrical Peclet number (–) |
| p | = | elastic specular reflection probability of charged particles (–) |
| {Qi} | = | complete orthonormal set of functions |
| R2 | = | coefficient of determination (–) |
| Re | = | Reynolds number (–) |
| s | = | wire center-to-center spacing, spacing between collecting electrodes (m) |
| si | = | eigenvalues of the complete orthonormal set of functions {Qi, i = 1, 2, …} |
| U | = | full average particle velocity in the x direction (= u + Wx) (m/s) |
| u | = | average airflow velocity (m/s) |
| u* | = | friction velocity (m/s) |
| u*t | = | threshold friction velocity (m/s) |
| ups | = | particular solution velocity (m/s) |
| V | = | measured outlet airflow velocity (m/s) |
| vT | = | mean thermal (chaotic) velocity of charged particles (m/s) |
| vz | = | velocity of charged particles in the z direction (m/s) |
| W | = | particle migration velocity in the z direction due to electrostatic forces (W ≡ Wz) (m/s) |
| Wconv | = | convection velocity of charged particles in the z direction (m/s) |
| Wx | = | particle migration velocity in the x direction due to electrostatic forces (m/s) |
| w | = | corona gap (m) |
| x | = | streamwise coordinate (m) |
| z | = | cross-stream coordinate (m) |
| Φ | = | reentrainment flux (1/m2/s) |
| Γz | = | charged-particle flux in the z direction (1/m2/s) |
| = | partial flux to (+) or (–) from the surface of the collecting electrode (1/m2/s) | |
| η | = | particle penetration through the ESP (–) |
| Δφ | = | applied corona voltage (V) |
| Δϕ | = | repelling voltage (V) |
| νf | = | kinematic viscosity of air (m2/s) |
| ρa | = | air density (kg/m3) |
| ρp | = | particle density (kg/m3) |
| σp | = | dimensionless particle density (σp = ρp/ρa) |
| Subscripts | ||
| aver | = | related to the average value |
| cum | = | related to the cumulative particle size distribution |
| H | = | related to the duct region “H” |
| h | = | related to the collecting electrode section “h” |
| w | = | related to the discharge region “w” |
| x | = | related to the x direction |
| z | = | related to the z direction |
Supplemental Material
Download Zip (41.7 KB)Related Research Data
References
- Abdel-Salam, M., M. T. El-Mohandes, H. Wedaa, S. K. El-Deen, and N. Zouzou. 2015. Particles' re-entrainment in electrostatic precipitators. In 2015 IEEE Jordan Conference on Applied Electrical Engineering and Computing Technologies (AEECT), IEEE, 1–4. doi:10.1109/AEECT.2015.7360588.
- Abramova, I. M., I. A. Krishtafovich, I. Krishtafovich, E. M. Rysina, M. G. Shandala, and V. G. Iuzbashev. 2006. Indoor air decontamination by the ionic wind technology. Gig. Sanit. 4:81–85. PMID: 17729450.
- Boor, B. E., J. A. Siegel, and A. Novoselac. 2013. Wind tunnel study on aerodynamic particle resuspension from monolayer and multilayer deposits on linoleum flooring and galvanized sheet metal. Aerosol Sci. Technol. 47(8):848–57. doi:10.1080/02786826.2013.794929.
- Brandvold, D. K., P. Martinez, and D. Dogruel. 1989. Polarity dependence of N2O formation from corona discharge. Atmos. Environ. 23(9):1881–83. doi:10.1016/0004-6981(89)90513-1.
- Cooperman, G. 1984. A unified efficiency theory for electrostatic precipitators. Atmos. Environ. (1967) 18(2):277–85. doi:10.1016/0004-6981(84)90101-X.
- Fairchild, C. I., and M. I. Tillery. 1982. Wind tunnel measurements of the resuspension of ideal particles. Atmos. Environ. (1967) 16(2):229–38. doi:10.1016/0004-6981(82)90437-1.
- Friess, H., and G. Yadigaroglu. 2001. A generic model for the resuspension of multilayer aerosol deposits by turbulent flow. Nucl. Sci. Eng. 138(2):161–76. doi:10.13182/NSE01-A2207.
- Fromentin, A. 1989. Time dependent particle resuspension from a multi-layer deposit by turbulent flow. J. Aerosal Sci. 20(8):911–14. doi:10.1016/0021-8502(89)90724-6.
- Gomes, C., J. Freihaut, and W. Bahnfleth. 2007. Resuspension of allergen-containing particles under mechanical and aerodynamic disturbances from human walking. Atmos. Environ. 41(25):5257–70. doi:10.1016/j.atmosenv.2006.07.061.
- Granovskii, V. L. 1952. The electric current in a gas. Vol. 1. General problems of gas electrodynamics [in Russian]. Moscow–Leningrad: Gos. Izd. Tekh.-Teor. Lit.
- Harris, A. R., and C. I. Davidson. 2009. A Monte Carlo model for soil particle resuspension including saltation and turbulent fluctuations. Aerosal Sci. Tech. 43(2):161–73. doi:10.1080/02786820802538071.
- Huxley, L. G. H., and R. W. Crompton. 1974. The diffusion and drift of electrons in gases. New York: Wiley.
- Idelchik, I. E., and E. Fried. 1986. Handbook of hydraulic resistance. New York: Hemisphere.
- Islamov, R. S., and Y. A. Krishtafovich. 2013. Erosion and lifetime of tungsten, gold, and nichrome wire anodes in an ultracorona in air. IEEE Trans. Plasma. Sci. 41(7):1787–93. doi:10.1109/TPS.2013.2263513.
- Islamov, R. S. 1991. Simulation of the formation of the anode spot in the self-sustained glow discharge. Sov. Phys. Tech. Phy. (English Translation) 36(7):725–27. Accessed September 20, 2018. http://journals.ioffe.ru/articles/viewPDF/24659.
- Kawakami, H., A. Zukeran, K. Yasumoto, M. Kuboshima, Y. Ehara, and T. Yamamoto. 2011. Diesel exhaust particle reduction using electrostatic precipitator. Int. J. Environ. Sci. Tech. 5(2):179–83.
- Lawless, P. A. 1996. Particle charging bounds, symmetry relations, and an analytic charging rate model for the continuum regime. J. Aerosal Sci. 27(2):191–215. doi:10.1016/0021-8502(95)00541-2.
- Lazaridis, M., and Y. Drossinos. 1998. Multilayer resuspension of small identical particles by turbulent flow. Aerosal Sci. Tech. 28(6):548–560. doi:10.1080/02786829808965545.
- Leonard, G., M. Mitchner, and S. A. Self. 1980. Particle transport in electrostatic precipitators. Atmos. Environ. (1967) 14(11):1289–99. doi:10.1016/0004-6981(80)90230-9.
- Liu, Z., Z. Zhu, Y. Zhu, W. Xu, and H. Li. 2015. Investigation of dust loading and culturable microorganisms of HVAC systems in 24 office buildings in Beijing. Energ. Buildings 103:166–174. doi:10.1016/j.enbuild.2015.06.056.
- Loosmore, G. A. 2003. Evaluation and development of models for resuspension of aerosols at short times after deposition. Atmos. Environ. 37(5):639–647. doi:10.1016/S1352-2310(02)00902-0.
- Matsusaka, S. 2015. High-resolution analysis of particle deposition and resuspension in turbulent channel flow. Aerosal Sci. Tech. 49(9):739–46. 10.1080/02786826.2015.1066752.
- Mizushina, T., and F. Ogino. 1970. Eddy viscosity and universal velocity profile in turbulent flow in a straight pipe. J Chem. Eng. Japan 3(2):166–70. doi:10.1252/jcej.3.166.
- Nokes, R. I., and I. R. Wood. 1988. Vertical and lateral turbulent dispersion: some experimental results. J. Fluid. Mech. 187(1):373–394. doi:10.1017/S0022112088000473.
- Ohkubo, T., S. Hamasaki, Y. Nomoto, J. S. Chang, and T. Adachi. 1990. The effect of corona wire heating on the downstream ozone concentration profiles in an air-cleaning wire-duct electrostatic precipitator. IEEE Trans. Ind. App. 26(3):542–49. doi:10.1109/28.55962.
- Pope, C. A. III, 2000. Epidemiological basis for particulate air pollution health standards. Aerosal Sci. Tech. 32(1):4–14. doi:10.1080/027868200303885.
- Qian, J., and A. R. Ferro. 2008. Resuspension of dust particles in a chamber and associated environmental factors. Aerosal Sci. Tech. 42(7):566–78. doi:10.1080/02786820802220274.
- Qian, J., J. Peccia, and A. R. Ferro. 2014. Walking-induced particle resuspension in indoor environments. Atmos. Environ. 89 :464–81. doi:10.1016/j.atmosenv.2014.02.035.
- Robinson, M. 1976. Effects of the corona discharge on electric-wind convection and eddy diffusion in an electrostatic precipitator (No. HASL-301). New York: Energy Research and Development Administration, Health and Safety Lab.
- Salimifard, P., D. Rim, C. Gomes, P. Kremer, and J. D. Freihaut. 2017. Resuspension of biological particles from indoor surfaces: effects of humidity and air swirl. Sci. Tot. Environ. 583:241–47. doi:10.1016/j.scitotenv.2017.01.058.
- Sehmel, G. A. 1970. Particle deposition from turbulent air flow. J. Geophys. Res. 75(9):1766–81. doi:10.1029/JC075i009p01766.
- Shao, Y. 2008. Physics and modelling of wind erosion. Vol. 37. Berlin: Springer.
- Shao, Y., and H. Lu. 2000. A simple expression for wind erosion threshold friction velocity. J. Geophys. Res. Atmos. 105(D17):22437–43. doi:10.1029/2000JD900304.
- Shao, Y. P., M. R. Raupach, and J. F. Leys. 1996. A model for predicting Aeolian sand drift and dust entrainment on scales from paddock to region. Australian J. Soil Res. 34(3):309–42. doi:10.1071/SR9960309.
- Slaiman, Q. J., M. M. Abu-Khader, and B. O. Hasan. 2007. Prediction of heat transfer coefficient based on eddy diffusivity concept. Chem. Eng. Res. Des. 85(4):455–64. doi:10.1205/cherd06002.
- Tsilingiris, P. T. 2008. Thermophysical and transport properties of humid air at temperature range between 0 and 100 C. Energy Convers. Manage. 49(5):1098–10. doi:10.1016/j.enconman.2007.09.015.
- Verdier, T., M. Coutand, A. Bertron, and C. Roques. 2014. A review of indoor microbial growth across building materials and sampling and analysis methods. Build. Environ. 80:136–49. doi:10.1016/j.buildenv.2014.05.030.
- Wen, H. Y., and G. Kasper. 1989. On the kinetics of particle reentrainment from surfaces. J. Aerosal Sci. 20(4):483–498. doi:10.1016/0021-8502(89)90082-7.
- White, F. M. 1999. Fluid mechanics. 4th ed. New York: WCB.
- Wu, Y. L., C. I. Davidson, and A. G. Russell. 1992. Controlled wind tunnel experiments for particle bounceoff and resuspension. Aerosal Sci. Tech. 17(4):245–262. doi:10.1080/02786829208959574.
- Yamamoto, T., and H. R. Velkoff. 1981. Electrohydrodynamics in an electrostatic precipitator. J. Fluid Mech. 108(1):1–18. doi:10.1017/S002211208100195X.
- Yasumoto, K., A. Zukeran, Y. Takagi, Y. Ehara, T. Takahashi, and T. Ito. 2008. Suppression of particle deposition onto downstream wall in an AC electrostatic precipitator with neutralisation. Int. J. Environ. Waste Manage. 2(4/5):399–411. doi:10.1504/IJEWM.2008.021781.
- Yoo, K. H., J. S. Lee, and M. D. Oh. 1997. Charging and collection of submicron particles in two-stage parallel-plate electrostatic precipitators. Aerosal Sci. Tech. 27(3):308–23. doi:10.1080/02786829708965476.
- Zukeran, A., Ikeda, Y. Y. Ehara, M. Matsuyama, T. Ito, T. Takahashi, H. Kawakami, T. Takamatsu. and T. 1999. Two-stage-type electrostatic precipitator re-entrainment phenomena under diesel flue gases. IEEE Trans. ind. Appl. 35(2):346–51. doi:10.1109/28.753627.