
Abstract
Routine calibrations of online aerosol chemical composition analyzers are important for assessing data quality during field measurements. The combination of a differential mobility analyzer (DMA) and condensation particle counter (CPC) is a reliable, conventional method for calibrations. However, some logistical issues arise, including the use of radioactive material, quality control, and deployment costs. Herein, we propose a new, simple calibration method for a particle mass spectrometer using polydispersed aerosol particles combined with an optical particle sizer. We used a laser-induced incandescence–mass spectrometric analyzer (LII-MS) to test the new method. Polydispersed aerosol particles of selected chemical compounds (ammonium sulfate and potassium nitrate) were generated by an aerosol atomizer. The LII section was used as an optical particle sizer for measuring number/volume size distributions of polydispersed aerosol particles. The calibration of the MS section was performed based on the mass concentrations of polydispersed aerosol particles estimated from the integration of the volume size distributions. The accuracy of the particle sizing for each compound is a key issue and was evaluated by measuring optical pulse height distributions for monodispersed ammonium sulfate and potassium nitrate particles as well as polystyrene latex particles. A comparison of the proposed method with the conventional DMA-CPC method and its potential uncertainties are discussed.
Copyright © 2018 American Association for Aerosol Research
EDITOR:
1. Introduction
Online measurements of aerosol chemical composition provide useful insights into the sources and formation processes of ambient aerosols (e.g., Zhang et al. Citation2007; Jimenez et al. Citation2009; Kroll et al. Citation2011; Ortega et al., Citation2016). Currently available online or semi-continuous instruments include an Aerodyne aerosol mass spectrometer (AMS) or aerosol chemical speciation monitor (ACSM) (Jayne et al. Citation2000; Canagaratna et al. Citation2007; Crenn et al. Citation2015), a particle-into-liquid sampler coupled with an ion chromatograph (PILS-IC) (Weber et al. Citation2001), and a Sunset Laboratory thermal–optical elemental and organic carbon (EC/OC) analyzer (Birch and Cary, Citation1996). Routine calibrations of online aerosol instruments are important for assessing the performance of those instruments, and the quality of data during field measurements and laboratory experiments. The calibration of PILS-IC and EC/OC is performed by directly injecting authentic standard materials into the analyzer. The calibration of AMS, or other particle mass spectrometers, is often performed using aerosol particles generated with known size and composition, because the collection/detection efficiency of particles is a key issue for online particle mass spectrometry. The chemical composition and size distributions of calibration particles should be carefully selected and optimized with respect to each instrument, depending on the detection methods and size-dependent particle collection efficiency of the instruments. The combination of a differential mobility analyzer (DMA) with a condensation particle counter (CPC) is a reliable, conventional method for calibrations. However, the use of a radioactive source (85Kr and 210Po in US and 241Am in Japan) as a neutralizer requires special care when deploying a DMA in field conditions. The quality control of a DMA and CPC could be an important issue for field measurements because calibration results strongly depend on the accuracy of the DMA sizing and CPC counting efficiency, which may not be regularly evaluated by users. The deployment costs could be another important issue in some cases.
The laser-induced incandescence–mass spectrometric analyzer (LII-MS) is a novel instrument for online measurements of aerosol chemical composition classified by the mixing state with black carbon (BC) (Miyakawa et al. Citation2014). The LII-MS system consists of an LII vaporizer/detector with a near-infrared laser cavity (Nd:YVO4, wavelength of 1,064 nm), which is similar to LII systems presented by earlier studies (e.g., Stephens et al. Citation2003; Moteki and Kondo Citation2007), and a particle trap laser desorption mass spectrometer (PT-LDMS; Takegawa et al. Citation2012). The LII section measures number size distributions of total and BC particles, and the MS section quantifies the chemical composition of particles.
Here, we propose a new method to calibrate the MS section without a DMA and CPC. The LII section is used as an optical particle sizer for measuring the number/volume size distributions of polydispersed aerosol particles. This article presents and discusses the comparison of this method with the conventional DMA-CPC method in the laboratory and its potential uncertainties.
2. Experimental
The basic concept of the LII-MS is given by Miyakawa et al. (Citation2014), and only key details relevant to this study are described here. Light scattering (LS) signals from individual particles are detected using an avalanche photodiode (APD) and photodiode (PD). LS signals from the APD or PD are processed by two amplifiers with different gains (high and low). Using these four channels (APD-high/low and PD-high/low), the LII section can detect aerosol particles with diameters ranging from ∼140 to ∼2100 nm. Note that data from smaller particle diameters (<∼160 nm) are not used because the detection efficiency rapidly decreases around these diameters. In addition, data from larger diameters (>∼700 nm) are not used for the present analysis because of the nonmonotonic response of LS signals to particle diameters.
There are two operation modes to collect data from the LII section. For normal operation mode, the data acquisition system does not record individual optical pulse heights from aerosol particles but counts the number of pulses according to predetermined size bins with an interval of Δlogdp = 0.06, where dp is the PSL-equivalent diameter. To measure pulse height distributions of LS signals, the operation mode is temporarily changed so that individual pulse heights can be recorded. This enables high-resolution measurements of optical pulses compared to normal operation mode.
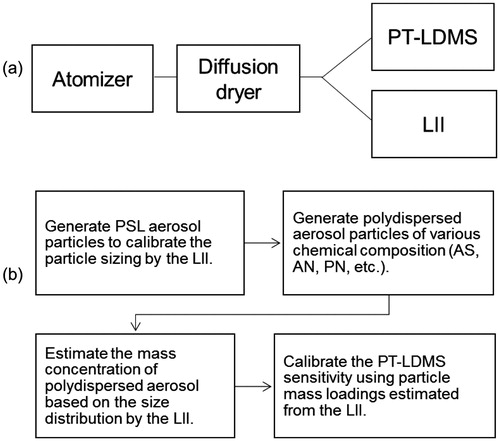
shows a schematic diagram and operation procedure of the calibration method proposed in this study. The main components include an aerosol atomizer with an air compressor (Model 220, TOPAS), diffusion dryer, and flow controllers. The aerosol atomizer was used for generating calibration particles with various chemical compounds, including polystyrene latex (PSL), ammonium sulfate (AS), ammonium nitrate (AN), and potassium nitrate (PN). Although AN is more relevant than PN in ambient aerosols, we do not use AN for routine calibrations because the sensitivity for AN could be affected by evaporative loss of AN particles during particle collection. The interpretation of the sensitivity for AN particles is now ongoing and will be presented elsewhere. The number size distributions of polydispersed aerosol particles introduced to the LII and MS sections were measured based on the optical particle sizing in the LII section. The accuracy of the optical particle sizing was regularly checked by measuring pulse height distributions of LS signals from PSL particles (254 ± 3 and 402 ± 6 nm, JSR Corporation, Japan). The optimization of the size distributions of polydispersed AS and PN particles is a key component of the current system. The peak diameter of volume size distributions should fall within the size range detected by the LII and below the upper size limit of the aerodynamic lens of the PT-LDMS. Care was taken to keep the total number concentration of calibration particles detected by the LII at ∼1,000 cm−3 to reduce coincidence effects in the particle sensing volume and to obtain sufficient particle counting statistics. The optimization was performed by adjusting the solution concentrations, and flow rates of both compressed air and dilution air. To account for the smaller and larger size ranges that were not quantified in the LII section, the mass concentrations of AS and PN particles were determined by lognormal fitting of the volume size distributions derived from LS signals. The estimated mass concentration was used to calculate the MS sensitivity, which is defined as the ratio of the integrated ion signal at a selected mass-to-charge (m/z) ratio (Qm/z) to mass loadings for each compound (Takegawa et al. Citation2012; Ozawa et al. Citation2016). The ion signals were normalized by the reference signal at m/z 14 (N+) to account for possible changes in the detector response over time. For normal operation mode, the time resolution of the LII data acquisition was 2 min and that of the MS section was 15 min (7 min for particle collection and 8 min for analysis and cooling).
Figure 1. (a) Schematic diagram and (b) operation procedure of the calibration method proposed in this study. The main components include an aerosol atomizer with an air compressor, diffusion dryer, and flow controllers for particle generation and dilution (the compressor and flow controllers are not shown).
We used a DMA (Model 3080, TSI Inc., Shoreview, MN, USA) and CPC (Model 3022 A, TSI Inc.) to generate monodispersed aerosol particles (hereafter referred to as the monodisperse test) and also to measure the size distribution of polydispersed aerosol particles (polydisperse test). The apparatus for monodisperse tests is conceptually the same as the conventional calibration method used in previous studies (e.g., Takegawa et al. Citation2005). The LII and MS sections were operated separately (parallel mode). We tested another atomizer (Model 3076, TSI, Inc.) for comparison and no significant difference was found except that the optimal solution concentration was slightly different.
For monodisperse tests, the DMA was used to classify the size of aerosol particles and the CPC was used to measure the number concentration of monodispersed aerosol particles. The total sample flowrate was 0.4–0.5 L min−1 (∼0.3 L min−1 for the CPC and 0.1–0.2 L min−1 for the LII-MS) and the sheath flow of the DMA was set at 4.0 L min−1. We mainly used a mobility diameter of 250 nm for this experiment. We also measured the number concentration at the mobility diameter corresponding to doubly charged particles (∼414 nm). Details of the correction used for multiply charged particles are given by Ozawa et al. (Citation2016). For polydisperse tests, the DMA and CPC were combined as a scanning mobility particle sizer (SMPS) to measure the size distributions of polydispersed aerosol particles. The sheath and sample flow rates for the SMPS were set at 3.0 and 0.3 L min−1, respectively.
The comparison of monodisperse and polydisperse tests for homogeneous composition particles is the major focus of this study. To reduce possible uncertainties associated with a drift in the MS sensitivity, these tests were sequentially performed within a relatively short period of time (∼half a day). The dynamic range of aerosol number concentrations for polydisperse tests was limited by the optimal condition of the operation as described earlier. The diameter and number concentrations of monodispersed aerosol particles were varied by adjusting the DMA setting and the dilution flow rate upstream of the DMA. We performed the experiments three times (experiments 1–3) with an interval of ∼2 weeks each, to check the reproducibility.
3. Results and discussion
3.1. Calibration of optical particle sizing
shows an example of pulse height distributions of PSL, AS, and PN particles for a mobility diameter of 254 nm classified by the DMA. The absolute values of pulse heights do not have a physical meaning because they include the settings of the detector and analog-to-digital converter. The shape of the pulse height distribution was asymmetric; it is characterized by a broad tail at the left-hand side of the peak and a sharp decrease at the right-hand side. This is primarily due to broadening of the laser beam and the aerosol particle jet generated by a sheath-air nozzle. The structure of the sheath-air nozzle is illustrated by Miyakawa et al. (Citation2014) and the flowrate balance of the sample and sheath air is given in the Supplemental Information. The peak of the pulse heights corresponds to LS signals from particles located in the center of the aerosol jet and passing near the center of the laser beam. The tail corresponds to LS signals from particles located at the edge of the aerosol jet and passing off the center of the laser beam.
Figure 2. Pulse height distributions of LS signals of PSL (shaded), ammonium sulfate (AS, solid), and potassium nitrate (PN, dashed) particles classified by a DMA at a mobility diameter of 254 nm.
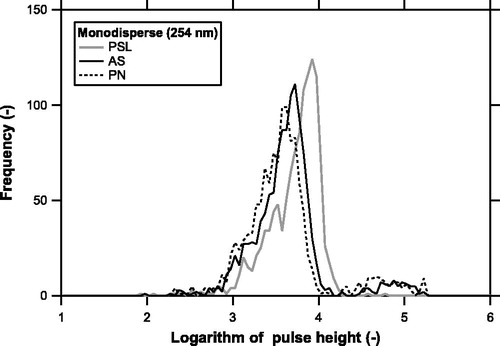
A slight but non-negligible difference in the peak position and shape was found between PSL and AS/PN particles. The right-hand side of the pulse height distribution appears less steep for AS/PN particles than PSL particles. Possible factors affecting the peak position and shape of the pulse height distributions include the refractive index, the shape of particles, and the width of the particle sizes classified by the DMA (10% of the center diameter). Assuming a dynamic shape factor of unity (i.e., volume-equivalent diameters can be approximated by mobility diameters), an empirical correction factor for the conversion from optical to volume-equivalent diameters can be derived. We repeated the measurements several times and determined the correction factors to be 1.06 and 1.12 for AS and PN, respectively. The uncertainties in these factors were estimated to be ∼2%. These correction factors are important for estimating the volume concentration of polydispersed aerosol particles (volume correction factors of 1.063 = 1.19 and 1.123 = 1.40 for AS and PN, respectively).
3.2. Quantification of size distributions of polydispersed aerosol particles
shows a comparison of the number size distribution of polydispersed AS particles derived from LS signals and that from the SMPS obtained during experiment 3. It should be noted that the data in the LS size bins of 247 and 429 nm were systematically lower than the data in the neighboring size bins (the lower size bin appeared as a “dip”). These “dip” bins correspond to the boundaries of APD-high/low and APD-low/PD-high gains. Since these features were not found in the raw data obtained by the pulse height measurement mode (not shown), this is likely due to systematic errors related to the classification of LS signals near the boundaries. Except for these bins and those with very low concentrations, the LS and SMPS data agreed to within ∼20%.
Figure 3. (a) Number size distribution of polydispersed AS particles measured by the LS method (solid sticks) and SMPS (shaded line). The arrows indicate “dip” size bins near the boundary of the detectors. The dashed line represents the lognormal fitting for the SMPS data. (b) Volume size distributions of polydispersed AS particles measured by the LS method (solid sticks) and SMPS (shaded line). The dashed line represents the lognormal fitting for the LS data. The “dip” size bins were excluded from the plot and fitting.
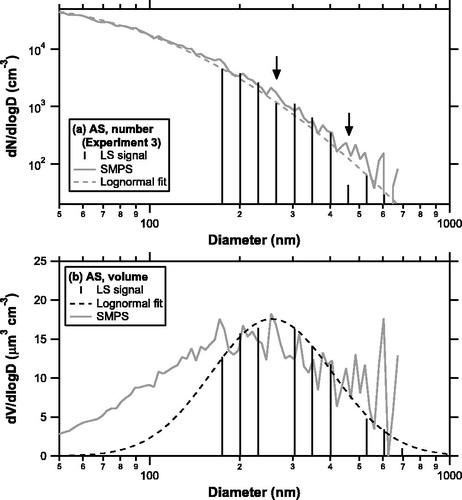
The pulse height distribution for PSL particles shown in can be interpreted as the instrument response function against monodispersed aerosol particles assuming that variation of the PSL diameters was negligible compared to the instrument response function. A numerical calculation shows that the number size distribution of polydispersed aerosol particles may be underestimated by 10–20% without deconvolution (see Supplementary Information), although the comparison between the LS and SMPS data did not show such tendency. We do not use the response function to deconvolute number size distributions and consider this effect as a potential source of uncertainties.
shows the volume size distributions of polydispersed AS particles derived from the same data used in . The “dip” size bins mentioned above were excluded from the plot. The total volume concentration can be estimated by integrating the lognormal function fitted to the LS data. The volume concentration is converted to mass concentration using the bulk density of these compounds (1.77 and 2.11 g cm−3 for AS and PN, respectively). The SMPS data showed substantial scatter at larger diameters due to low particle counting statistics. The lognormal fitting of the LS data tended to be lower than the SMPS data at smaller diameters. Similar features were found in other cases. summarizes the average values of the ratios of the total volume concentration derived from the LS method to that from the SMPS for each experiment. Overall, the total volume concentrations from the LS method tended to be lower than those from the SMPS, probably due to the underestimation of volume size distributions at smaller diameters. Note that the comparison with the SMPS may not be quantitatively conclusive because the accuracy of volume size distributions by mobility size spectrometers has not been well evaluated (Wiedensohler et al. Citation2012). Here, we do not make an additional correction for the volume concentrations by the LS method and consider the discrepancy as a potential source of uncertainties.
Table 1. Comparison of total volume concentrations between the LS method and SMPS.Table Footnotea
3.3. Calibration of the MS
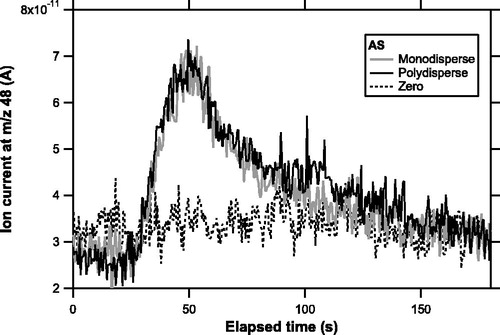
shows temporal profiles of ion signals at m/z 48 for AS particles obtained by the MS section. The data from monodisperse and polydisperse tests with similar amounts of accumulated mass of sulfate are compared. The temporal evolution of ion signals obtained from the polydisperse test nearly overlapped that from the monodisperse test. The divergence of particle beams generated by an aerodynamic lens could be different between monodispersed and polydispersed particles (Zhang et al. Citation2004), and the shape of ion signal evolution could be affected by the distribution of particles deposited on the trap (Takegawa et al. Citation2012). The similarity of the shape suggests that there was no significant difference in the distribution of aerosol particles on the trap between monodispersed and polydispersed particles. The similarity was also found for PN particles (not shown).
Figure 4. Temporal profiles of ion signals at a mass-to-charge (m/z) ratio of 48 obtained for AS particles during experiment 3. The shaded and solid lines represent data from monodisperse (sulfate mass loadings of 12.7 ng) and polydisperse (11.3 ng) tests, respectively. The dashed line represents data from zero air (particle-free air).
shows scatterplots of net integrated ion signals at m/z 48 (SO+) versus accumulated mass of sulfate particles for monodisperse (conventional method) and polydisperse (new method) tests during experiments 1–3. As mentioned in Section 2, the dynamic range of accumulated mass for polydisperse tests was limited by the optimal condition for the operation. There was no systematic difference with respect to particle diameters for the monodisperse tests (not shown). There were three outlying data points exhibiting systematically high sensitivity values during experiment 1. These data were obtained immediately after high concentrations of monodispersed AS aerosols were introduced. We speculate that there were some “after effects” due to high mass loadings of sulfate, although the mechanism for this feature is not well understood.
Figure 5. (a) Scatterplots of the integrated ion signal at m/z 48 for AS particles versus accumulated mass of SO42− obtained from the conventional (monodisperse) and new (polydisperse) methods for experiments 1–3. The slope of the solid line (as indicated by the number on the top-right corner) represents the average sensitivity (pC ng−1) of the conventional method. Error bars (one standard deviation) are shown for selected data points. (b) Same as (a) but for PN particles.
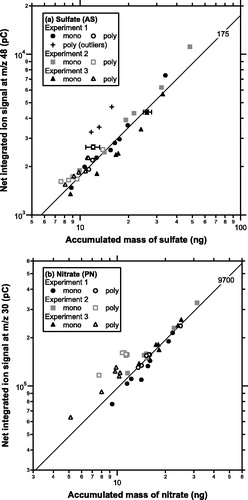
shows scatterplots of net integrated ion signals at m/z 30 (NO+) versus the accumulated mass of nitrate particles for monodisperse and polydisperse tests during experiments 1–3. Overall, the new method tended to overestimate the sensitivity as compared to the conventional method. Note that the relatively high sensitivity values found in polydisperse tests during experiment 2 was unlikely due to “after effects” because they were observed both before and after high mass loadings.
summarizes the ratio of the average sensitivity from the conventional method (mono-Sm/z) to that from the new method (poly-Sm/z). The outlying data points mentioned above were excluded from the statistical analysis. The two methods were found to agree to within 30%, although the sensitivity values from the new method tended to be larger than those from the conventional method. If we consider the conventional method as a reference, the ratio of mono-Sm/z to poly-Sm/z shown in can be regarded as the accuracy of deriving mass concentrations of sulfate/nitrate based on the new method. For example, if poly-Sm/z is smaller by a factor of 2 than mono-Sm/z, the new method overestimates mass concentrations of ambient aerosols by a factor of 2.
Table 2. Comparison of the MS sensitivity between the conventional and new methods.Table Footnotea
3.4. Possible uncertainties
Possible sources of uncertainties in the new and conventional methods are discussed. The uncertainties in ion signals originate mostly from the zero subtraction (∼3%) following the evaluation by Ozawa et al. (Citation2016). The uncertainties in estimating the mass concentrations of polydispersed aerosol particles include those from the flow rate of the LII section (∼7%) and diameter correction factors (∼6%). The overall uncertainty in estimating the accumulated mass of polydispersed sulfate or nitrate aerosols is estimated to be ±10%. The uncertainty in estimating the accumulated mass of monodispersed sulfate or nitrate aerosols is estimated to be +7/−5% following the evaluation by Ozawa et al. (Citation2016). These uncertainties are accounted for in the error bars in .
An additional uncertainty may originate from the approximation of lognormal size distributions for polydispersed aerosol particles. The non-negligible contributions from smaller particles that were not detected by LS signals may be partially responsible for the overestimation of the sensitivity. However, the overestimation of the sensitivity () was not quantitatively consistent with the underestimation of the volume concentrations (). There could be other sources of uncertainties that were not considered here. A possible approach to improve this point is to reduce the fraction of smaller particles in polydispersed aerosols using a diffusion screen. Further modification of the new method is necessary to improve the reliability of the calibration.
4. Summary and implications
We have proposed a simple calibration technique for a particle mass spectrometer based on polydispersed aerosol particles using the LII-MS. The LII section was used as an optical particle sizer for estimating the mass concentration of polydispersed aerosol particles. The MS sensitivity for AS and PN derived from the new method was compared with the conventional DMA-CPC method. The two methods were found to agree to within 30%, although the sensitivity values from the new method tended to be larger than those from the conventional method.
While the results obtained in this study may be specific to the LII-MS, a similar method can be applied to calibrations of other online particle mass spectrometers if an optical particle sizer with moderate size resolution is available. The detectable size range and accuracy of the particle sizing are important, however, the resolution of the sizing is not very critical for this purpose because it is only used for lognormal fitting of relatively broad aerosol size distributions generated by an atomizer. This routine calibration procedure could be automated by electronically switching on and off the particle generator and valves, which may improve the quality control of the online aerosol composition analyzer over a long time period.
Supplemental Material
Download Zip (264.6 KB)Acknowledgments
This study was funded by the Grant-in-Aid for Scientific Research of the Japan Society for the Promotion of Science (JSPS) (16H05620 and 17H01862).
Related Research Data
References
- Birch, M. E., and R. A. Cary. 1996. Elemental carbon-based method for monitoring occupational exposures to particulate diesel exhaust. Aerosol. Sci. Technol. 25(3):221–41.
- Canagaratna, M. R., J. T. Jayne, J. L. Jimenez, J. D. Allan, M. R. Alfarra, Q. Zhang, T. B. Onasch, F. Drewnick, H. Coe, A. Middlebrook, et al. 2007. Chemical and microphysical characterization of ambient aerosols with the aerodyne aerosol mass spectrometer. Mass Spec. Rev. 26(2):185–222.
- Crenn, V., J. Sciare, P. L. Croteau, S. Verlhac, R. Fröhlich, C. A. Belis, W. Aas, M. Äijälä, A. Alastuey, B. Artiñano, et al. 2015. ACTRIS ACSM intercomparison – Part 1: Reproducibility of concentration and fragment results from 13 individual quadrupole aerosol chemical speciation monitors (Q-ACSM) and consistency with co-located instruments. Atmos. Meas. Tech. 8(12):5063–87.
- Jayne, J. T., D. C. Leard, X. F. Zhang, P. Davidovits, K. A. Smith, C. E. Kolb, and D. R. Worsnop. 2000. Development of an aerosol mass spectrometer for size and composition analysis of submicron particles. Aerosol. Sci. Technol. 33(1–2):49–70.
- Jimenez, J. L., M. R. Canagaratna, N. M. Donahue, A. S. H. Prevot, Q. Zhang, J. H. Kroll, P. F. DeCarlo, J. D. Allan, H. Coe, N. L. Ng, et al. 2009. Evolution of organic aerosols in the atmosphere. Science 326(5959):1525–29.
- Kroll, J. H., N. M. Donahue, J. L. Jimenez, S. H. Kessler, M. R. Canagaratna, K. R. Wilson, K. E. Altieri, L. R. Mazzoleni, A. S. Wozniak, H. Bluhm, et al. 2011. Carbon oxidation state as a metric for describing the chemistry of atmospheric organic aerosol. Nature Chem. 3(2):133–9.
- Miyakawa, T., N. Takeda, K. Koizumi, M. Tabaru, Y. Ozawa, N. Hirayama, and N. Takegawa. 2014. A new laser induced incandescence – mass spectrometric analyzer (LII-MS) for online measurement of aerosol composition classified by black carbon mixing state. Aerosol, Sci. Thecnol 48(8):853–63.
- Moteki, N., and Y. Kondo. 2007. Effects of mixing state on black carbon measurements by laser-induced incandescence. Aerosol Sci. Technol. 41(4):398–417.
- Ortega, A. M., P. L. Hayes, Z. Peng, B. B. Palm, W. Hu, D. A. Day, R. Li, M. J. Cubison, W. H. Brune, M. Graus, et al. 2016. Real-time measurements of secondary organic aerosol formation and aging from ambient air in an oxidation flow reactor in the los angeles area. Atmos. Chem. Phys. 16(11):7411–33.
- Ozawa, Y., N. Takeda, T. Miyakawa, M. Takei, N. Hirayama, and N. Takegawa. 2016. Evaluation of a particle trap laser desorption mass spectrometer (PT-LDMS) for the quantification of sulfate aerosols. Aerosol Sci. Technol. 50(2):173–86. doi:10.1080/02786826.2016.1139685.
- Stephens, M., N. Turner, and J. Sandberg. 2003. Particle identification by laser-induced incandescence in a solid-state laser cavity. Appl. Opt. 42 (19):3726–36.
- Takegawa, N., T. Miyakawa, T. Nakamura, Y. Sameshima, M. Takei, Y. Kondo, and N. Hirayama. 2012. Evaluation of a new particle trap in a laser desorption mass spectrometer for online measurement of aerosol composition. Aerosol Sci. Technol. 46(4):428–43.
- Takegawa, N., Y. Miyazaki, Y. Kondo, Y. Komazaki, T. Miyakawa, J. L. Jimenez, J. T. Jayne, D. R. Worsnop, J. D. Allan, and R. J. Weber. 2005. Characterization of an aerodyne aerosol mass spectrometer (AMS): intercomparison with other aerosol instruments. Aerosol Sci. Technol. 39:760–70.
- Weber, R. J., D. Orsini, Y. Daun, Y.-N. Lee, P. J. Klotz, and F. Brechtel. 2001. A particle-into-liquid collector for rapid measurement of aerosol bulk chemical composition. Aerosol. Sci. Technol. 35(3):718–27.
- Wiedensohler, A., W. Birmili, A. Nowak, A. Sonntag, K. Weinhold, M. Merkel, B. Wehner, T. Tuch, S. Pfeifer, M. Fiebig, et al. 2012. Mobility particle size spectrometers: Harmonization of technical standards and data structure to facilitate high quality long-term observations of atmospheric particle number size distributions. Atmos. Meas. Tech. 5(3):657–85. doi:10.5194/amt-5-657-2012.
- Zhang, Q, J. L. Jimenez, M. R. Canagaratna, J. D. Allan, H. Coe, I. Ulbrich, M. R. Alfarra, A. Takami, A. M. Middlebrook, Y. L. Sun, et al. 2007. Ubiquity and dominance of oxygenated species in organic aerosols in anthropogenically influenced Northern hemisphere midlatitudes. Geophys. Res. Lett. 34 :L13801. doi:10.1029/2007GL029979.
- Zhang, X., K. A. Smith, D. R. Worsnop, J. L. Jimenez, J. T. Jayne, C. E. Kolb, J. Morris, and P. Davidovits. 2004. Numerical characterization of particle beam collimation: Part II integrated aerodynamic-lens-nozzle system. Aerosol Sci. Technol. 38(6):619–38.