
 ?Mathematical formulae have been encoded as MathML and are displayed in this HTML version using MathJax in order to improve their display. Uncheck the box to turn MathJax off. This feature requires Javascript. Click on a formula to zoom.
Abstract
Thermal desorption aerosol mass spectrometers (TDAMSs) with electron ionization are widely used for quantitative analysis of aerosol chemical composition, and the ionization efficiency of evolved gas molecules from aerosol particles is an important parameter for such analysis. We performed laboratory experiments using a custom-made TDAMS to investigate the key factors affecting ionization efficiency. Ammonium chloride (NH4Cl) and ammonium iodide (NH4I) were used as test compounds because their thermal decomposition products are expected to be simple (dominated by ammonia (NH3) and hydrogen halide (HX)). The ion signals originating from NH3 and HX were measured by altering the position of the ionizer relative to the vaporization point. The ratio of ion signal from NH3 to that from HX increased with increasing divergence angle of evolved gas plumes, which suggests that the angular distribution of gas molecules could be an important factor affecting the ionization efficiency.
Copyright © 2018 American Association for Aerosol Research
EDITOR:
1. Introduction
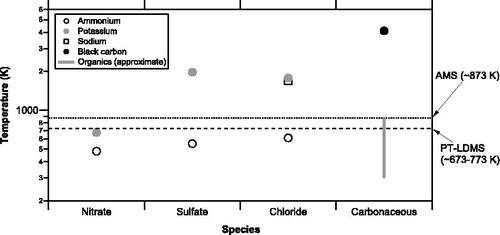
Real-time measurements of aerosols are important for improving our understanding of the formation and loss processes of ambient aerosols. Online thermal desorption aerosol mass spectrometers (TDAMSs) with electron ionization (EI), including the thermal desorption particle beam mass spectrometer (TDPBMS) (Tobias et al. Citation2000) and the Aerodyne aerosol mass spectrometer (AMS) (Jayne et al. Citation2000), provide, if properly calibrated, quantitative measurements of the chemical composition of nonrefractory aerosol particles. These online TDAMS instruments use a two-step detection scheme: aerosol particles are first collected and vaporized by thermochemical processes in a vacuum chamber, following which the evolved gaseous compounds are ionized and then detected. Aerodyne AMS instruments are widely used by many investigators for ambient measurements and laboratory experiments (e.g., Zhang et al. 2007). The goal of the AMS detection scheme is to quantitatively measure aerosol mass concentrations for a wide range of aerosol compositions. To detect evolved gas, the Aerodyne AMS uses flash vaporization of aerosol particles on a heated tungsten surface, followed by an electron ionization mass spectrometer (EI-MS). Recently, a new type of vaporizer (capture vaporizer) was developed to improve the collection efficiency of aerosol particles (Hu et al. Citation2017). Other types of TDAMSs include the particle trap – laser desorption mass spectrometer (PT-LDMS) that we developed recently (Takegawa et al. Citation2012). In the PT-LDMS, aerosol particles are collected on a particle trap and vaporized by using a carbon dioxide (CO2) laser, following which the ion signals are detected by using an EI-MS. The Aerodyne AMS and the PT-LDMS detect similar chemical compounds because the operating temperatures of the AMS vaporizer (∼873 K) and the PT-LDMS particle trap upon laser heating (radiation temperature of ∼673–773 K assuming a blackbody) are comparable (). The collection and vaporization efficiency of particles and the ionization efficiency of evolved gas are key parameters for quantification for the Aerodyne AMS and the PT-LDMS, and also for other types of TDAMSs.
Figure 1. Vaporization temperatures (boiling, sublimation, or dissociation temperature) of major inorganic and carbonaceous compounds relevant to ambient aerosols. The temperature data were taken from the NIST database and Chemical Dictionary (1994). Because the vaporization temperatures can vary depending on experimental conditions (pressure, heating rate, etc.), the values shown here should be regarded as approximate. The vaporization temperatures for organics are uncertain and assumed to be 300–873 K in this plot. The vaporizer temperatures of the Aerodyne aerosol mass spectrometer (AMS) and the particle trap laser desorption mass spectrometer (PT-LDMS) are indicated by dotted and dashed lines, respectively. Note that the temperature for the PT-LDMS is the lower limit because it was measured using a radiation thermometer and assuming a blackbody.
Jimenez et al. (Citation2003) proposed that the ionization efficiency of unknown compounds could be estimated by assuming that the ionization efficiency is proportional to the molecular weight (MW) of the compounds provided that they consist of a certain group of elements (e.g., hydrocarbons). This concept is the basis for the AMS standard analysis procedure that is widely used by many investigators. In the AMS analysis procedure, variability in the ionization efficiency for various compounds is implicitly incorporated into the relative ionization efficiency (RIE), which is an empirical correction factor determined from laboratory experiments and/or routine calibrations. The calibration of the ionization efficiency of an AMS is generally done using monodisperse ammonium nitrate (NH4NO3) particles. Although the NH4NO3 calibration protocol provides reasonable agreement with collocated instruments, the RIE for ammonium () may vary from ∼3 to ∼15 in Aerodyne aerosol chemical speciation monitors (ACSMs) (Crenn et al. Citation2015). The observed variability in the ionization efficiency for NH4+, which is the simplest (lowest MW) and major basic compound in ambient aerosols, is not fully understood. This also implies that the relative intensities of hundreds to thousands of mass-to-charge ratio (m/z) peaks from organic compounds (the RIE values for organics are generally represented by the average value of 1.4 (Canagaratna et al. Citation2007)) should be interpreted with caution.
Murphy (Citation2016) suggests that the residence time of gas molecules in the ion source should be explicitly considered. He proposed that an additional dependence may be important to predict the ionization efficiency. Although this model may not explain the RIE variability for NH4+, the theoretical approach proposed by Murphy (Citation2016) and the following discussion by Jimenez et al. (Citation2016) motivated us to perform further experiments from a different viewpoint. The purpose of the present study is thus to investigate experimentally the key factors affecting the variability in the ionization efficiency in a TDAMS.
2. Method
2.1. Theory
This section describes the dynamics of evolved gas molecules. We consider two species (A and B) evaporating from a particle. We do not follow the formulation of the RIE of the Aerodyne AMS because it is somewhat an operational definition. Instead, we follow the general principles and assumptions that were considered in previous studies (Jimenez et al. Citation2003; Murphy Citation2016). The number of ions detected by the ion detector of the mass spectrometer is governed by
(1)
(1)
where Is (s = A, B) is the number of ions detected per second (ion current) for species s, ns is the number concentration of s in the ionization volume, and σs is the EI cross section for s.
We first consider a model assuming that the number concentration of species s is proportional to the number of molecules that evaporate from a particle per second:
(2)
(2)
where
and
are the number and mass of molecules for species s that evaporate per second from a particle, respectively, and MWs is the molecular weight of s. The assumption of this model is conceptually similar to that of the method proposed by Jimenez et al. (Citation2003). Hereafter this model is referred to as the static model.
We also consider another model incorporating an additional dependence to account for the residence time of molecules in the ionizer.
(3)
(3)
The assumption of this model is conceptually similar to that of the method proposed by Murphy (Citation2016). Hereafter, this model is referred to as the dynamic model. We now define a new parameter ks to describe collectively the two models and also to incorporate unknown factors that are not currently considered:
(4)
(4)
where ks = 1 for the static model and ks =
for the dynamic model. We reformulate Equation (4) to fit our experimental data (time integration for the numerator and denominator, assuming ks is not time-dependent):
(5)
(5)
where Qs is the integrated ion signal corresponding to the mass Ms. If A and B are thermal-decomposition products originating from a certain compound, Equation (5) can be rearranged as
(6)
(6)
where μs is the mass fraction of the neutral species s produced per unit mass by thermal decomposition of the parent molecule. The left hand side of Equation (6) can be experimentally obtained and the right hand side can be calculated using existing database (except for the ks values).
Finally Equation (5) is related to the ionization efficiency, IE. If we define the IE as the ratio of the number of ions detected to the number of molecules that evaporate from particles, we obtain
(7)
(7)
The derivation of absolute values of IE requires a precise estimate of the number of molecules that evaporate from particles. Because the underlying principles for Equations (6) and (7) are essentially the same, we use Equation (6) to interpret the experimental data.
In this study, ammonium chloride (NH4Cl) and ammonium iodide (NH4I) are selected as test compounds for the following reasons: First, the vaporization temperatures of these compounds (NH4Cl: 611 K, NH4I: 508 K) are well below the vaporizer temperature and comparable to those of other major inorganic compounds relevant in the atmosphere (). Second, these compounds are expected to decompose mainly to ammonia (NH3) and hydrogen halide (HX). Third, the MW values of HCl and HI are larger by a factor of ∼2.1 and ∼7.5, respectively, than that of NH3, which is suitable for testing the dependence on MW. Although NH4NO3 is widely used for calibrations of AMS instruments, it is not used in this experiment to reduce uncertainties due to fragmentation.
2.2. Experiment
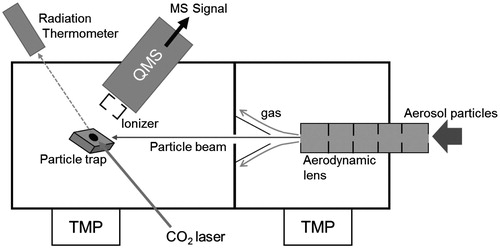
A modified version of the PT-LDMS was constructed to do the ionization experiments. The major modification was the geometry of the particle detection section (). The gold-coated aluminum cell, which was used to confine evolved gas in a small volume, was removed so that evolved gas molecules could travel directly to the ionizer with no surface contact. Apart from the difference in the structure, the physical process of evolved gas molecules in this system is essentially the same as that in the AMS and TDPBMS. The particle trap was mounted on a probe that could be translated perpendicular to the particle beam axis to allow the particle trap to be moved relative to the ionizer. We set three positions (a, b, and c). Positions (b) and (c) were 8.6 and 15.6 mm from position (a), respectively. Aerosol particles were collected at position (b) for a certain time and then the trap was moved to each position for the analysis. The optical path of the CO2 laser was adjusted to match the location of the particle trap at each position.
Figure 2. Schematic diagram of experimental setup. Aerosol particles are introduced into a vacuum chamber and collected on a particle trap. Collected particles are vaporized by a CO2 laser and detected by a quadrupole mass spectrometer.
A quadrupole mass spectrometer (QMS) with an EI source (PrismaPlus, Pfeiffer Vacuum) was used to detect evolved gas molecules. The time resolution of the detection was limited by the duty cycle of the multiple-ion detection mode (dwell time of 20 ms at each m/z for this experiment). We used a cross-beam ion source, which is the same type as used in the AMS, with a slight modification. The ionization region was surrounded by an ionizer cage, and gas molecules could enter the ionizer cage either from the direction perpendicular to the QMS field axis or from the direction along the QMS axis through a small hole (∼2.5 mm). We shielded the former, which was larger than the latter and generally used for cross-beam analysis, by using a gold film to restrict the entrance pathway into the ionizer (). This increased the position sensitivity of ion detection. The electron energy was set at 60 eV for all experiments. We used 60 eV instead of 70 eV because the former is recommended in the instrument specification. The data from the National Institute of Standard Technology (NIST) and Vinodkumar et al. (Citation2010) indicate only a small difference in the ionization cross section between 60 and 70 eV, at least for the molecules tested in this study.
Figure 3. Schematic view of geometry of the particle trap and ionizer. The particle trap was mounted on a probe that could translate perpendicular to the particle beam axis so that the position of the particle trap relative to the ionizer can be adjusted. The position of the ionizer relative to the vaporization point is given in a polar coordinate system.
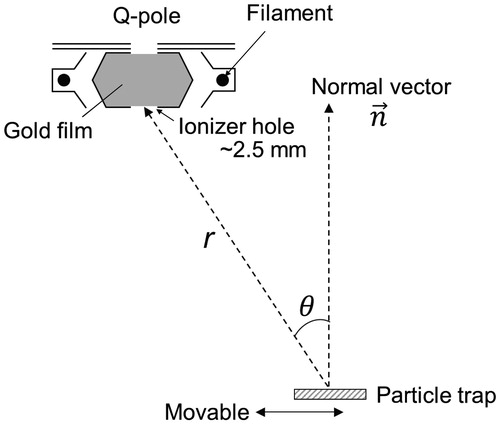
The xyz coordinates of the ionizer hole and those of the particle trap at each position were measured using a laser mounted on a triple-axis positioning stage. We defined the x-axis as the direction along the particle beam and set the y (horizontal) and z (vertical) axes accordingly. The laser spot was positioned at the center of the particle trap, two additional points on the particle trap plane, and the center of the ionizer hole, and the xyz coordinates of these points were recorded. We reset the center of the particle trap as the origin of the xyz coordinates and converted each position to polar coordinates ( and ). The direction perpendicular to the particle trap plane (normal vector) is set as the polar axis. Position (a) is the closest to the ionizer, which means that the radial distance r and polar angle θ at this position were minimized.
Table 1. Geometric relationship between vaporization point and ionizer.
The observed ion current was processed using the method given by Takegawa et al. (Citation2012) and Ozawa et al. (Citation2016). The integrated ion signal for species s produced in the PT-LDMS is given by
(8)
(8)
where
is the integrated ion signal at the selected m/z for species s,
is the fragment ratio at m/z for s (
), and
is the product of the transmission efficiency of the quadrupole and the detection efficiency of the ion detector at the selected m/z relative to m/z 28 (N2+). We need
values to correct for reduced transmission/detection efficiency at larger m/z (the characteristics of the QMS used in this study). Although the absolute values of Qs differ depending on the definition of
, the difference does not affect the major conclusions of the present study. The values of
were estimated from our experiment data and also from the EI mass spectrum database provided by NIST.
was evaluated using a mixture of nitrogen and noble gases (N2: Ar: Kr: Xe =0.8397: 0.0516: 0.0536: 0.0551). The values of
relative to m/z 28 were 0.81 ± 0.06 for m/z 36 (HCl+) and 0.20 ± 0.03 for m/z 128 (HI+). The ionization cross sections for NH3 and HX used for Equation (6) were taken from the NIST database and from Vinodkumar et al. (Citation2010).
Polydispersed aerosol particles were generated using a Collison atomizer (Model 3076, TSI, Inc., USA) and introduced into the modified PT-LDMS after passing through a diffusion dryer. The mass concentration of polydispersed aerosols was roughly estimated using a portable PM monitor (DustTrak, TSI, Inc.). As mentioned earlier, a precise estimate of the mass concentration is not required in these experiments because we use the ratio of ion signals (Equation (6)).
Note that the cycle of particle collection and vaporization differs from real-time vaporization of aerosol particles on a heated surface, as is done in the AMS. We did not use real-time vaporization because the sensitivity was not sufficiently high. Although the collection and vaporization efficiency could differ between these two cases, the dynamics of gas molecules evolved from heated particles should be essentially the same.
3. Results
The major m/z peaks originating from NH4Cl were m/z 16 (NH2+), 17 (NH3+), 35 (35Cl+), 36 (H35Cl+), 37 (37Cl+), and 38 (H37Cl+). The number of m/z peaks that could be simultaneously monitored is limited by the QMS duty cycle. The fragment ratio of NH2+ to NH3+ and that of Cl+ to HCl+ were measured separately and found to be 0.76 ± 0.03 and 0.22 ± 0.01, respectively. These values are comparable to those for NH3 and HCl gas molecules from the NIST database (0.80 and 0.17, respectively) and for NH4Cl particles from the AMS measurements reported by Hu et al. (Citation2017) (0.83 and 0.20, respectively), which supports the assumption that the detection process of the PT-LDMS is similar to that of the AMS. Only ion signals at m/z 16 and 36 were simultaneously monitored; other fragments were estimated from the NIST database by assuming that NH4Cl was decomposed mainly to NH3 + HCl. Another possibility is that NH4Cl may be emitted as intact molecules, as suggested in the discussion of NH4NO3 by Murphy (Citation2016). This point is further discussed later.
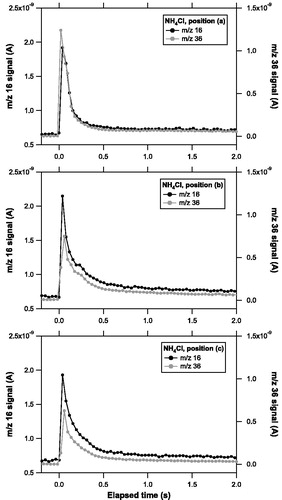
shows an example of the evolution of ion signals at the selected m/z peaks for NH4Cl observed at each position. The CO2 laser was irradiated continuously from 0 to 30 s. The signal evolution curve at m/z 16 and 36 had similar shapes for the duration of the laser irradiation, which suggests that NH3 and HCl were emitted almost simultaneously. It appears that a substantial fraction of particles evaporated immediately upon irradiation of the CO2 laser. The tail of the signal gradually decreased to the baseline level after ∼30 s, which was likely due to vaporization of particles deposited relatively far from the center of the laser beam. The intensity of the ion signal at m/z 36 relative to that at m/z 16 decreased as the trap was moved from position (a) to (c), which suggests that NH4Cl was unlikely vaporized as intact molecules.
Figure 4. Temporal evolution of ion signals at m/z 16 (solid) and 36 (shaded) originating from ammonium chloride (NH4Cl) particles observed at position (a), (b), and (c).
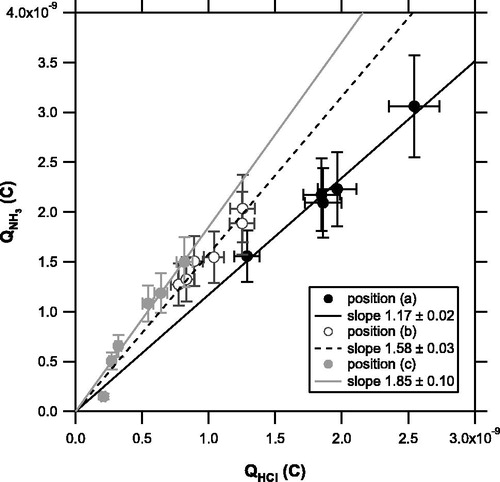
The temporal evolution of the ion signals were integrated over the laser irradiation time (0–30 s) to obtain the Qs values. shows a scatterplot of the integrated signal for NH3 (QNH3 versus that for HCl (QHCl) at each position. The slope of QNH3 versus QHCl tends to increase with increasing r and θ. The effect of θ appears more important than that of r.
Figure 5. Scatterplot of integrated signal for NH3 (QNH3 versus that of HCl (QHCl) originating from NH4Cl particles obtained at each position ((a): solid, (b): open, and (c): shaded circles). The solid, dashed, and shaded lines are regression lines for positions (a), (b), and (c), respectively, forced through the origin.
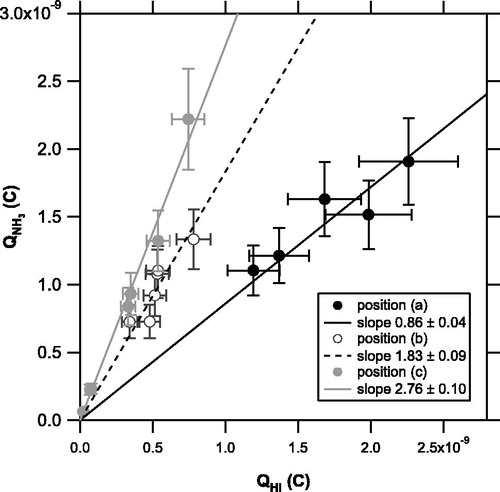
The major m/z peaks originating from NH4I were m/z 16 (NH2+), 17 (NH3+), 127 (I+), and 128 (HI+). Because the fragment ratio for HI is not in the NIST database, we monitored m/z 16, 127, and 128 for NH4I. The fragment ratio of NH2+ to NH3+ and that of I+ to HI+ were measured separately and found to be 0.76 ± 0.01 and 1.00 ± 0.02, respectively. shows a scatterplot of the integrated signal for NH3 (QNH3 versus that of HI (QHI) at each position. The slope of QNH3 versus QHI tends to increase with increasing r and θ, which is similar to the result obtained from the NH4Cl experiment.
Figure 6. Same as Figure 5 but for NH3 (QNH3 and HI (QHI) originating from NH4I particles.
4. Discussion
The uncertainty in Qs in Equation (8) originates from experimental errors in ,
, and
. The error in
is estimated from the standard deviation of the background signal just before irradiation of the CO2 laser. Based on our transmission efficiency measurements, the error in
is estimated to be ∼8% for m/z 36 and ∼15% for m/z 127 and 128. The error in
is not considered in the current analysis. Note that our results do not depend directly on the collection and vaporization efficiency of particles because we use the ratio of ion signals from “vaporized” gas molecules. As mentioned earlier, the overlap of the CO2 laser beam with the distribution of particles deposited on the trap may cause the ion signals to tail off. This effect may yield additional uncertainties in the thermal desorption process of particles. We tried a shorter integration time (0–10 s) to selectively consider the major peak immediately after exposure to the laser. Although the absolute values of Qs decrease accordingly, the main conclusion does not change (i.e., the systematic difference in the regression slope of QNH3 versus QHX at three positions is clearly identified).
The error bars in and are based on the error estimates described above. The difference in the regression slope exceeds the error range, suggesting that the position of the ionizer relative to the vaporization point is an important factor affecting the kNH3/kHX ratios. Considering the dependence of the kNH3/kHX ratios on r and θ, the systematic difference in kNH3/kHX may primarily be due to differences in the angular distribution of the evolved gas plumes for different molecules. This angular distribution may affect the overlap of gas plumes and the electron density in the ionizer. This effect has not been considered in previous TDAMS studies and is potentially important for interpreting the mass spectra of various compounds.
Evolved gas molecules may pass through different regions in the ionizer, which can cause variations in the ionization efficiency of molecules and also in the extraction efficiency of ions into the QMS. Considering r, θ, and the size of the ionizer hole, the uncertainty in cosθ is estimated to be ∼6%, ∼11%, and ∼19% at position (a), (b), and (c), respectively. A bounce of molecules in the ionizer cage may also affect the observed ion signals. Although this effect was not considered in the present study, the probability that bounced molecules passed through the ionization region would be small compared with the main stream of molecules directly transported from the vaporization point.
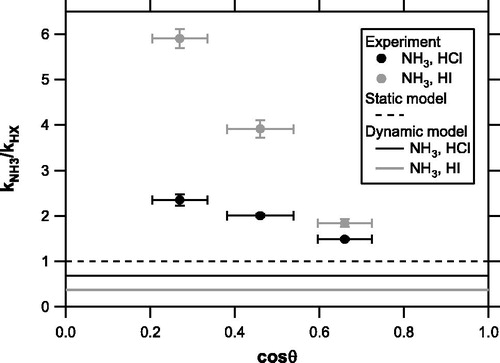
shows the kNH3/kHX ratios (estimated using Equation (6)) as a function of cosθ, along with the theoretical predictions by the static and dynamic models. Although we do not have data at larger cosθ, the kNH3/kHX ratios appear, with increasing cosθ, to approach the predictions of the static or dynamic models. At present we cannot draw a definitive conclusion about the validity of the static and dynamic models because the variability in the kNH3/kHX ratios due to cosθ considerably exceeded any differences between the two models.
Figure 7. Ratios of kNH3 to kHCl (solid circles) and kNH3 to kHI (shaded circles) (estimated from Equation (Citation6)) as a function of cosθ, along with theoretical predictions by the static (ks = 1) and dynamic (ks =) models.
We now discuss the implications for the ionization efficiency of the Aerodyne AMS. The geometric relationship between the vaporization point and the ionizer in an AMS may be approximated as r 10 mm and cosθ
0.9 if we consider that the particle beam is perfectly aligned and that the vaporizer is ideally flat. In real situations there may be broadening and/or misalignment of the particle beam (of the submillimeter order), and evolved gas plumes leaving the vaporizer may be randomly oriented because of the surface roughness, which can cause variations in cosθ. The angular distribution is difficult to quantify but potentially explain the large variability in the RIE for NH4+ that was observed with the Aerodyne ACSM (Crenn et al. Citation2015). This phenomenon is not consistently explained by either the static or dynamic model.
An important question remaining is how the angular distribution of evolved gas plumes is controlled. It is possible that gas molecules frequently collide during the initial stage of plume expansion, as pointed out by Murphy (Citation2016), which could be important when considering the molecular dynamics. A numerical simulation of this effect is ongoing and will be presented elsewhere. A better understanding of the dynamics of evolved gas plumes will provide useful insights into a better design of the vaporizer and ionizer for TDAMSs.
5. Conclusions
We performed laboratory experiments to investigate how vaporized gas molecules from NH4Cl and NH4I particles behave in a TDAMS. Upon altering the position of the ionizer relative to the vaporization point, we observed systematic changes in ion signals from NH3 relative to those from HCl or HI. The systematic changes may be due to differences in the angular distribution of evolved gas plumes for different molecules. The angular distribution may affect the overlap of gas plumes and electron density in the ionizer of the TDAMS. Further investigations are needed to comprehensively understand the physical and chemical mechanisms affecting the ionization efficiency of evolved gas from aerosol particles in TDAMSs.
Additional information
Funding
Related Research Data
References
- Canagaratna, M. R., J. T. Jayne, J. L. Jimenez, J. D. Allan, M. R. Alfarra, Q. Zhang, T. B. Onasch, F. Drewnick, H. Coe, A. Middlebrook, et al. 2007. Chemical and Microphysical Characterization of Ambient Aerosols with the Aerodyne Aerosol Mass Spectrometer. Mass Spec. Rev 26:185–222.
- Chemical Dictionary 1994. Edited by Ooki, M., T. Oosawa, M. Tanaka, and H. Chihara, Tokyo Kagaku Dozin, Co., Ltd., Tokyo, Japan (in Japanese).
- Crenn, V., J. Sciare, P. L. Croteau, S. Verlhac, R. Fröhlich, C. A. Belis, W. Aas, M. Äijälä, A. Alastuey, B. Artiñano., et al. 2015. ACTRIS ACSM Intercomparison - Part 1: Reproducibility of Concentration and Fragment Results from 13 Individual Quadrupole Aerosol Chemical Speciation Monitors (Q-ACSM) and Consistency with Co-located Instruments. Atmos. Meas. Tech 8:5063–87.
- Hu, W., P. Campuzano-Jost, D. A. Day, P. Croteau, M. R. Canagaratna, J. T. Jayne, D. R. Worsnop, and J. L. Jimenez. 2017. Evaluation of the New Capture Vapourizer for Aerosol Mass Spectrometers (AMS) Through Laboratory Studies of Inorganic Species. Atmos. Meas. Tech 10:2897–921. doi:10.5194/amt-10-2897-2017.
- Jayne, J. T., D. C. Leard, X. F. Zhang, P. Davidovits, K. A. Smith, C. E. Kolb, and D. R. Worsnop. 2000. Development of an Aerosol Mass Spectrometer for Size and Composition Analysis of Submicron Particles. Aerosol. Sci. Technol 33:49–70.
- Jimenez, J. L., J. T. Jayne, Q. Shi, C. E. Kolb, D. R. Worsnop, I. Yourshaw, J. H. Seinfeld, R. C. Flagan, X. Zhang, K. A. Smith, et al. 2003. Ambient Aerosol Sampling Using the Aerodyne Aerosol Mass Spectrometer. J. Geophys. Res. 108(D7):8425. doi:10.1029/2001JD001213.
- Jimenez, J. L., M. R. Canagaratna, F. Drewnick, J. D. Allan, M. R. Alfarra, A. M. Middlebrook, J. G. Slowik, Q. Zhang, H. Coe, J. T. Jayne, et al. 2016. Comment on “The Effect of Molecular Weight and Thermal Decomposition on the Sensitivity of a Thermal Desorption Aerosol Mass Spectrometer. Aerosol Sci. Technol. 50:i–xv. doi:10.1080/02786826.2016.1205728.
- Murphy, D. M. 2016. The Effects of Molecular Weight and Thermal Decomposition on the Sensitivity of a Thermal Desorption Aerosol Mass Spectrometer. Aerosol Sci. Technol. 50(2):118–25. doi:10.1080/02786826.2015.1136403.
- Ozawa, Y., N. Takeda, T. Miyakawa, M. Takei, N. Hirayama, and N. Takegawa. 2016. Evaluation of a Particle Trap Laser Desorption Mass Spectrometer (PT-LDMS) for the Quantification of Sulfate Aerosols. Aerosol. Sci. Technol. 50(2):173–86. doi:10.1080/02786826.2016.1139685.
- Takegawa, N., T. Miyakawa, T. Nakamura, Y. Sameshima, M. Takei, Y. Kondo, and N. Hirayama. 2012. Evaluation of a New Particle Trap in a Laser Desorption Mass Spectrometer for Online Measurement of Aerosol Composition. Aerosol. Sci. Technol. 46(4):428–43.
- Tobias, H. J., P. M. Kooiman, K. S. Docherty, and P. J. Ziemann. 2000. Real-time Chemical Analysis of Organic Aerosols Using a Thermal Desorption Particle Beam Mass Spectrometer. Aerosol. Sci. Technol. 33(1–2):170–90.
- Vinodkumar, M., R. Dave, H. Bhutadia, and B. K. Antony. 2010. Electron Impact Total Ionization Cross Sections for Halogens and Their Hydrides. Int. J. Mass Spectrom. 292(1–3):7–13.
- Zhang, Q., J. L. Jimenez, M. R. Canagaratna, J. D. Allan, H. Coe, I. Ulbrich, M. R. Alfarra, A. Takami, A. M. Middlebrook, Y. L. Sun, K. et al. 2007. Ubiquity and Dominance of Oxygenated Species in Organic Aerosols in Anthropogenically Influenced Northern Hemisphere Midlatitudes. Geophys. Res. Lett. 34:L13801. doi:10.1029/2007GL029979.