
 ?Mathematical formulae have been encoded as MathML and are displayed in this HTML version using MathJax in order to improve their display. Uncheck the box to turn MathJax off. This feature requires Javascript. Click on a formula to zoom.
Abstract
The partitioning of semi-volatile organic compounds (SVOCs) between the gas and particle phase plays an important role in understanding the formation of secondary organic aerosols (SOAs) in the atmosphere. There are uncertainties and problems associated with measurements during the simultaneous sampling of both gas and particle phases. In recent studies, diffusion denuders have been used for separate sampling of gas and particle phases of organic compounds. The removal of the gaseous species in the denuder distorts the gas–particle equilibrium and leads to the dissociation of the particulate phase during the sampling. This phenomenon is particularly true for volatile organic species and leads to significant error in determining gas-to-particle phase partitioning of organic aerosols due to underestimation of the particle phase. In this study, a model for simultaneous gas diffusion and aerosol decomposition/evaporation in the parallel plate denuder was developed to investigate the effects of sampling artifacts on gas–particle partitioning measurements of SVOCs. The model equations were cast into dimensionless form for generalization, and the effects of governing dimensionless groups on the denuder sampling artifacts were evaluated by performing a sensitivity analysis. Also, regression correlations for denuder sampling artifacts as the function of governing dimensionless groups were obtained. It was observed that the sampling of SVOCs could result in substantial particulate phase loss due to evaporation in the denuder, resulting in significant errors in the phase partitioning measurements. Also, the operating conditions for the denuder, so that the denuder sampling artifacts lie within tolerable limits, were evaluated.
Copyright © 2018 American Association for Aerosol Research
1. Introduction
Organic compounds are typically classified based on their volatility and oxidation state. The phase in which these compounds exist in the atmosphere depends primarily on their volatility. Semi-volatile organic compounds (SVOCs) are a subgroup of volatile organic compounds (VOCs) that have higher molecular weights and higher boiling points. The SVOCs exists in the atmosphere in both the gas and particle phase, which are in equilibrium according to the nature of the aerosol and the ambient temperature (Pankow Citation1987; Bidleman Citation1988). The phase partitioning of SVOCs affects their transport properties, deposition rates, and the pathways by which humans are exposed to them (Bidleman Citation1988). The SVOCs include compounds such as polychlorinated biphenyls (PCBs), pesticides, phthalates, and polycyclic aromatic hydrocarbons (PAHs), which have been linked to serious adverse health effects. The exposure to SVOC aerosols can lead to an increase in diseases like alveolitis, asthma, cancer and can have serious detrimental effect on the reproductive, nervous, and endocrine systems (Longnecker, Rogan, and Lucier Citation1997; Boström et al. Citation2002; Heudorf, Mersch-Sundermann, and Angerer Citation2007). The gas-phase SVOCs can be absorbed by the respiratory tract depending on their solubility in bodily fluids, whereas the particle phase can be deposited in different regions of the lung depending on their aerodynamic size. Therefore, it is important to distinguish and quantify gas- and particle-phase SVOCs to accurately access their health risks. Furthermore, the partitioning of SVOCs between the gas and particle phases plays an important role in the formation of secondary organic aerosols (SOAs) and their chemical aging in the atmosphere (Kroll et al. Citation2007; Hallquist et al. Citation2009). Therefore, knowing the phase partitioning is helpful in understanding the chemistry of SOA formation in the atmosphere.
Several field studies have been carried out to measure the gas and particle phase distribution of SVOCs in the atmosphere (Cincinelli et al. Citation2014; Xie, Hannigan, and Barsanti Citation2014). These measurements in general are typically done using filter–sorbent-based samplers. Quartz filters are typically used for collection of particles. The gas phase passes through the filter and is subsequently adsorbed on adsorbent material which is typically polyurethane foam or XAD resin. However, adsorption of gaseous organics could also occur on the filter, leading to overestimation of the particulate phase. Also, particles collected on the filter can volatilize leading to the underestimation of the particulate phase (Galarneau and Bidleman Citation2006). Thus, there is uncertainty associated with this sampling method. In recent years, diffusion denuders have been used as an important tool for assessing the gas-to-particle phase partitioning of semi-volatile compounds in the atmosphere (Possanzini et al. Citation2004; Zhao et al. Citation2013; Isaacman-VanWertz et al. Citation2016).
Diffusion denuders are routinely employed for sampling and collecting various atmospheric gases such as ammonia, nitric acid, sulfur dioxide, and organic vapors (Ianniello et al. Citation2010; Li et al. Citation2014). The walls of the denuder are internally coated with a specific reagent such as activated carbon and/or polystyrene–divinylbenzene resin that selectively adsorbs or reacts with the gas flowing through it. The denuders are designed in such a way that the gases in the sample air stream are removed almost completely by adsorption at the walls, whereas particles pass through without any significant loss due to slower diffusion rates to the wall as compared to the gas phase species. This behavior allows us to separate the gas and particulate phase. Therefore, the denuder is placed upstream of the quartz filter to remove the gases, eliminating the potential sampling artifacts due to gases absorbing on the filter. Some of the other advantages of using denuders are that they allow high sampling velocities and have a large sampling capacity as compared to the filter–sorbent samplers.
The advantages of diffusion denuders over filter–sorbent samplers have made them widely employed devices for sampling atmospheric gases and aerosols. Although the use of denuder overcomes many of the measurement artifacts in the filtration device, measurement biases or artifacts are still possible and may be significant in denuder sampling. At the denuder inlet, the gases are usually in equilibrium with the suspended particulates. During the flow through the denuder, the gas diffuses and is adsorbed by the denuder walls. The removal of gas by the denuder walls may distort the gas–particle equilibrium. A concentration gradient between gas and particles is created which acts as a driving force for the evaporation of the particles. Thus, there is a transfer of species from the particle to the gas phase and eventually to the denuder walls. Due to the evaporation of particles in the denuder, the mass of particles collected is less than their actual mass and results in higher gas fraction estimates. Several studies have been carried out to understand the artifacts caused by decomposition of inorganic aerosols in diffusion denuders. Biswas et al. (Citation1990) developed a computational model to evaluate sampling artifacts by incorporating gas diffusion and decomposition of monodisperse inorganic aerosol (ammonium nitrate) in their equations. Bai, Lu, and Lin (Citation1995) further modified the model developed by Biswas et al. (Citation1990) to include the effects of polydispersity and diffusion of inorganic aerosols; and Lu, Bai, and Lin (Citation1995) later incorporated aerosol coagulation in these equations. In these studies, the shape of the particle size distribution was approximated as lognormal, and the equation for the aerosol moments and the mass balance equations for associated gases were solved.
In all of the above studies, the analysis was done for single species inorganic aerosols. There are not many studies that have examined the measurement artifacts arising from the evaporative loss of semi-volatile organic aerosols in the diffusion denuder. The semi-volatile organic aerosols exist in the atmosphere as a mixture of thousands of species (Hildemann et al. Citation1991; Goldstein and Galbally Citation2007). For a realistic simulation, all of the volatile compounds that are present need to be considered. However, it is impractical to incorporate separate equations for thousands of these compounds. Therefore, to simplify, organic compounds with similar properties and/or origin are lumped together. The volatility basis set (VBS) approach developed by Donahue et al. (Citation2006) allows for an elegant and unified framework for modeling organic aerosols. In the VBS approach, individual organic compounds are grouped together based on their saturation concentration into equally spaced bins in a logarithmic scale (the basis set). The VBS approach has been widely implemented in many global and regional scale air quality models (Lane, Donahue, and Pandis Citation2008; Shrivastava et al. Citation2011; Jo et al. Citation2013). The advantages of the volatility basis-set approach include that it is systematic and can describe the partitioning of hundreds of compounds with a smaller number of parameters (Donahue et al. Citation2006).
In this study, a comprehensive model to evaluate and quantify measurement artifacts in the denuder sampling of phase-partitioned multicomponent SVOCs is developed. The equations for simultaneous gas diffusion and aerosol decomposition/evaporation in a parallel plate diffusion denuder were derived. The VBS approach is used to group different SVOCs into distinct bins based on their volatility, with {Csat.} = {1, 10, 100, 1000} µg m−3 as our basis set, as the saturation concentrations of SVOCs lie within this range. The effects of denuder design parameters and organic species properties, which influence the evaporation of the particulate phase, are quantitatively determined on the measurement artifacts. This model is also applied to simulate the sampling of SVOCs in a multiple parallel plate denuder documented by Delgado-Saborit, Stark, and Harrison (Citation2013).
2. Model
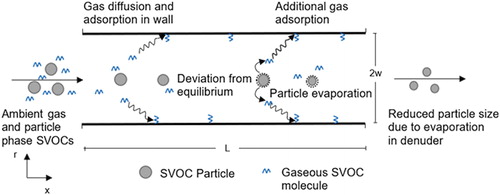
The aerosol is assumed to be in equilibrium with the gaseous phase constituents at the inlet of the denuder. Inside the denuder, the gas preferentially diffuses to the denuder walls and is removed therein; thus, the gas concentration drops and the equilibrium condition for the particles with the surrounding gas is disturbed. This creates a concentration gradient between gas and particles which acts as a driving force for evaporation of the particles. Due to evaporation, there is transfer of species from the particle phase to the gas phase, which is subsequently adsorbed by the denuder walls. The schematic of these processes occurring in the denuder is shown in .
Figure 1. Schematic of diffusion denuder channel showing gas diffusion to walls and particle evaporation/decomposition.
The model for simultaneous gas diffusion and aerosol evaporation in a parallel plate diffusion denuder was developed to evaluate and quantify measurement artifacts in the sampling of phase-partitioned multicomponent SVOCs. It is assumed that the gas-phase species is distributed over bins (i) based on the VBS, whereas the particle is a mixture of all the species in the various VBS. For the flow between parallel plates, the mass balance equation for the gas-phase molecules diffusing to the denuder walls is as follows:
(1)
(1)
where
is the direction of flow,
is the direction normal to the plates,
is the diffusivity of the species corresponding to ith VBS bin in air,
is the velocity profile in the channel between two denuder plates,
is the gas-phase concentration of species corresponding to ith bin,
is the particle number concentration,
is the particle diameter,
is the concentration of the gaseous species corresponding to ith bin at the particle’s surface, and
is the Fuchs–Sutugin correction factor for transport to/from a droplet surface in the transition-free molecule regime, given by:
(2)
(2)
where
is the Knudsen number (= 2λ/
, where λ is the mean free path of the air molecules).
The left-hand side of EquationEquation (1)(1)
(1) accounts for the convection of the gaseous species due to the flow in the axial direction in the denuder. The first term on the right-hand side of EquationEquation (1)
(1)
(1) describes the diffusion of the gas-phase species, while the second term accounts for the gain in gas phase molecules from the evaporation of aerosols/particulate phase. The particle diffusion terms and any loss to the wall is neglected in EquationEquation (1)
(1)
(1) because the diffusivity of the particles is several orders of magnitude lower than that of the gaseous species, and the residence time in the denuder is low (typically <5 s). Also, the axial diffusion of gas in the denuder could be neglected because of the higher axial velocity in the denuder. Therefore, in EquationEquation (1)
(1)
(1) , the term
could be ignored for practical purposes. The velocity profile in the channel is assumed to be laminar and fully developed and is given by:
(3)
(3)
where
is the average gas velocity in the denuder, and
is half the width of the denuder channel. The concentration of species i,
(EquationEquation (1)
(1)
(1) ) on the surface of the particle can be related to the saturation concentration by the following equation while accounting for the Kelvin effect (Friedlander Citation2000):
(4)
(4)
Here, is the mole fraction of species belonging to VBS bin “i” in the particle phase,
is the saturation concentration,
is the surface tension and
is the molecular volume of the species belonging to bin “i,”
is Boltzmann’s constant, and
is the ambient temperature.
As the particles move along the denuder axis with the flow, there is transfer of species from the particle to the gas phase which will reduce the size of the particles. Hence, the change in the size of the particle is given by solving the equation (Friedlander Citation2000):
(5)
(5)
where
is the moles of species corresponding to ith bin in the particle phase and
is the particle diameter, given by:
(6)
(6)
Here, is the molecular weight and
is the density corresponding to species in ith bin. At the denuder inlet, the particle and the gas phase are assumed to be in equilibrium. The walls of the denuder are assumed to be a perfect sink for gases, and the boundary conditions are set to the axis of symmetry and a zero wall concentration. Therefore, the initial and boundary conditions for the process described by EquationEquations (1)
(1)
(1) and Equation(5)
(5)
(5) are as follows:
(7)
(7)
(8)
(8)
(9)
(9)
(10)
(10)
where
and
are the inlet particle diameter and the inlet mole fraction of species belonging to bin “i” in the particle phase, respectively, and
is the length of the denuder.
These equations are further nondimensionalized for mathematical simplicity and to combine model parameters into a smaller set of governing dimensionless groups. The dimensionless equations are given by:
(11)
(11)
(12)
(12)
(13)
(13)
with the boundary conditions
(14)
(14)
(15)
(15)
(16)
(16)
(17)
(17)
where
,
,
,
,
,
, and
are the dimensionless variables, and
,
,
and
are the dimensionless parameters that govern the performance of denuder. The definition and expressions for these dimensionless parameters are given in .
, the modified Peclet number, is the ratio of the characteristic time for diffusion toward the channel wall (
) to the residence time in the denuder (
). The dimensionless time
is the ratio of residence time in the denuder (
) to the characteristic evaporation time in the continuum regime
.
is the Kelvin effect factor, and
is the ratio of the species present in the gas phase to that in the particle phase at the denuder inlet.
Table 1. Dimensionless parameters and their definitions.
EquationEquations (11)(11)
(11) and Equation(12)
(12)
(12) , along with the appropriate boundary conditions, constitute a set of coupled ordinary differential equations (ODEs) and partial differential equations (PDEs). These PDEs are transformed to ODEs using an explicit finite difference scheme at points along
, across the denuder. This set of coupled ODEs is then solved by a stiff ODE solver (MATLAB in this work), and
and
are calculated as a function of both
and
. The cup-mixing average is used to evaluate the effects of process parameters on the evolution of the particle size and the amount of gas collected in the denuder, which is calculated using:
(18)
(18)
Before the system analysis, the consistency of the model was first established by validating its numerical scheme. Then, the simulations were carried out to investigate the effect of dimensionless governing parameters on the denuder sampling artifacts. The measurement artifacts were quantified in terms of the percentage mass lost from the particle phase (), percentage excess gas adsorbed at denuder walls (
), and the percentage error in fraction of the total SVOC in gas phase (
). The expressions for these are given below:
(19)
(19)
(20)
(20)
(21)
(21)
where
is the ratio of the species corresponding to ith bin present in the gas phase to the total amount of ith species present in both phases. The regression correlations for denuder sampling artifacts as the function of governing dimensionless parameters were obtained. These equations were used to choose appropriate operating conditions for the denuder so that the error due to sampling artifacts lies within the allowable limit. Finally, the developed model was applied to evaluate the SVOC sampling artifacts for a typical denuder used in the field and the operating conditions were calculated for which the error due to sampling artifacts are negligible. The test plan and the set of all the simulations performed for this work are listed in .
Table 2. Simulation plan.
3. Results and discussions
The numerical scheme of this model is validated by comparing to analytical solutions for limited conditions. First, the numerical solutions of the present model’s predictions for gas concentrations in the absence of evaporating particles were compared with the analytical solution given by Tan and Thomas (Citation1972) for flow between parallel plates, and both were in excellent agreement. Second, a mass balance was carried out on the numerical solutions of the present model in the presence of evaporating particles. The net difference between the inlet and the outlet gas concentrations was calculated to be equal to the net difference between the net gas adsorbed in the denuder walls and the additional gas released due to particle evaporation.
After establishing the numerical consistency of the present model, a parametric analysis was carried out to investigate the effects of the dimensionless governing parameters ,
,
and
(in EquationEquations (11)
(11)
(11) and Equation(12)
(12)
(12) ) on the artifacts caused by evaporation of the particulate phase in the parallel plate denuder. For this simulation, it was assumed that the mole fractions of species in the various bins in the particle phase are same at the inlet and that both the phases are in equilibrium. Also,
, and
were assumed to not vary across different bins so that the dimensionless parameters
,
, and
depended only on the denuder parameters and operating conditions, but not on the bin. The values of the parameters examined here are in the typical range for denuders used in the field.
shows the measurement artifacts in the denuder sampling as the function of . As the diffusivity of species corresponding to all the bins is assumed to be same for this simulation,
is same for all the volatility bins as can be seen from the expression in . The mass lost from the particle phase (
), excess gas adsorption at denuder walls (
), and the error in measured gas fraction (
) were evaluated for each distinct bin as the function of
while keeping the other dimensionless parameters
,
, and
constant. As can be seen from , with an increase in
, mass lost from the particle phase, the adsorption of excess gas in the denuder and error in gas fraction measurements decrease. It can also be seen from that the mass lost from the particle phase is higher for the bin with higher volatility which can be attributed to higher evaporative losses for the species with higher volatility. However, the percentage of excess gas adsorbed at denuder walls is higher for the species with low volatility. The gas and the particle phase were assumed to be in equilibrium at the inlet of the denuder for this simulation. Hence
, which is the ratio of the species present in gas phase to that in the particle phase at the inlet, will be higher for bins with higher volatility. The higher value of
of the higher volatility bin will contribute to relatively less amount of excess gas adsorbed, as can be seen from EquationEquation (20)
(20)
(20) .
Figure 2. (a) Calculated mass loss percentage of SVOC particles at the exit of the parallel plate denuder as a function of Pem for each volatility bin, (b) excess adsorbed gas in the denuder in the presence of evaporating SVOC particles as a function of Pem for each volatility bin, (c) error in gas fraction measurements of phase-partitioned SVOCs as a function of Pem for each volatility bin. Note that in this simulation t* = 1.0, K = 0.05, and Ri is defined according to the equilibrium condition at the inlet.
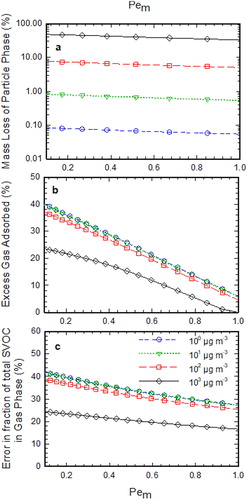
An increase in implies a lower evaporative loss of the particulate phase. Therefore, to minimize the sampling artifacts, it is desirable to have larger
values for the denuder, provided all the gas-phase species can be removed. Higher values of
are due to the larger channel width, lower gas diffusivity, shorter length, or higher velocity, which results in the characteristic diffusion time toward the channel wall to be higher or the residence time of gas to be shorter. In terms of controllable parameters, larger channel widths, higher flow rates, and lower volume of the denuders, or a larger value for
, where Q is the volumetric flow rate, and V is the volume of the denuder, can be selected to minimize particle evaporative loss.
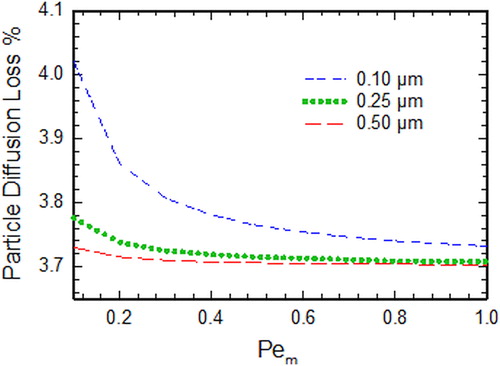
An additional factor to be considered is loss of particles by diffusion. While the diffusion denuder is designed to minimize particle loss and ensure gas removal, it is important to evaluate the loss of small particles. It is also important to estimate this and compare to evaporative losses arising from the particulate phase. The diffusion loss of the particles in the parallel plate denuder was calculated as the function of the modified Peclet number for different particle diameters using the expression given by DeMarcus and Thomas (Citation1952). shows the percentage of particles that are lost in the denuder due to diffusion as the function of for three different diameters: 0.1 µm, 0.25 µm, and 0.5 µm, which is typical size range for atmospheric aerosols (Cabada et al. Citation2004; Liu et al. Citation2016). Diffusive losses of particles are very low as compared to evaporative loss of particles, except for very low volatility species for which both losses are comparable yet still insignificant <5% ( and ).
Figure 3. Percentage of particle lost in the parallel plate denuder due to diffusion as the function of Pem. Note that for Pem calculation, Dg was assumed to be 6 × 10⁻² cm2/s.
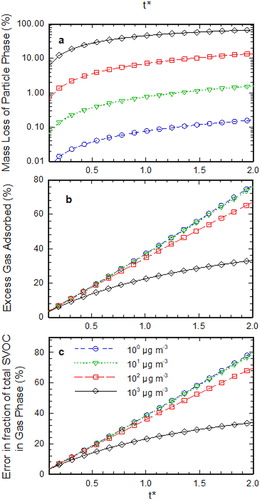
shows the measurement artifacts in the denuder sampling as the function of . As the diffusivity of species corresponding to all the bins is assumed to be same for this simulation,
is same for all the bins as can be seen from the expression in . The measurement artifacts were evaluated as the function of
while keeping the other dimensionless parameters
,
, and
constant. It can be seen from that an increase in
results in the increase in denuder measurement artifacts. The higher value of
implies the higher ratio of the residence time to the characteristic evaporation time. Therefore, the increase in
results in more aerosol evaporation and hence higher measurement artifacts. So, to minimize the sampling artifacts,
should be kept low while operating the denuder.
Figure 4. (a) Calculated mass loss percentage of SVOC particles at the exit of the parallel plate denuder as a function of t* for each volatility bin, (b) excess adsorbed gas in the denuder in the presence of evaporating SVOC particles as a function of t* for each volatility bin, (c) error in gas fraction measurements of phase-partitioned SVOCs as a function of t* for each volatility bin. Note that for this simulation Pem = 0.1, K = 0.05, and Ri is defined according to the equilibrium condition at the inlet.
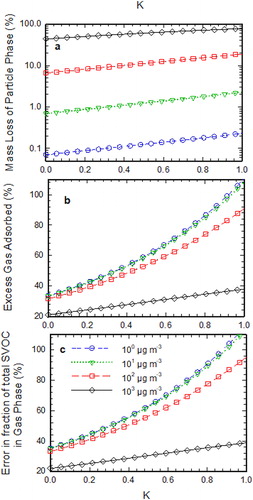
shows the measurement artifacts in denuder sampling as the function of . As
and
are assumed to not vary across different bins so
depends only on the denuder parameters and operating conditions but not on the bin as can be seen from the expression in . It can be seen from that an increase in
results in the increase in the denuder measurement artifacts. The higher value of
implies higher saturation concentration at the particle’s surface due to the Kelvin effect. This results in the higher driving force, which causes evaporation of particles. Therefore, an increase in
increases the evaporative losses as seen in .
Figure 5. (a) Calculated mass loss percentage of SVOC particles at the exit of the parallel plate denuder as a function of K for each volatility bin, (b) excess adsorbed gas in the denuder in the presence of evaporating SVOC particles as a function of K for each volatility bin, (c) error in gas fraction measurements of phase-partitioned SVOCs as a function of K for each volatility bin. Note that for this simulation Pem = 0.1, t* = 1.0, and Ri is defined according to the equilibrium condition at the inlet.
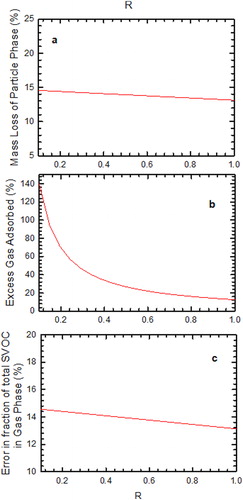
, the ratio of the species present in the gas phase to that in the particle phase, at the inlet will be higher for bins with higher volatility. Therefore, it is different for distinct bins and it defines the initial conditions (actual gas–particle phase values) for our simulation. Therefore, to see the effect of
on measurement artifacts, the particle was assumed to be composed of species belonging to bin Csat.i = 100 µg m−3. shows the measurement artifacts in the denuder sampling as the function of
. It can be seen that an increase in
results in the decrease in the evaporative losses in the denuder. This is because at the higher value of
, the gas present at the inlet is higher than the equilibrium value and hence the driving force that causes evaporation of particles is lower. Therefore, an increase in
decreases the sampling artifacts as seen in .
Figure 6. (a) Calculated mass loss percentage of SVOC particles at the exit of the parallel plate denuder as a function of R, (b) excess adsorbed gas in the denuder in the presence of evaporating SVOC particles as a function of R, (c) error in gas fraction measurements of phase-partitioned SVOCs as a function of R. Note that for this simulation Pem = 0.1, t* = 1.0, and K = 0.05.
The developed model can be used for two different purposes: (1) designing a denuder and (2) choosing the appropriate operating conditions for an existing denuder, such that the error due to sampling artifacts is low. For the objective of designing the denuder, a set of regressions equations were obtained, relating and
to percentage mass loss from the particle phase due to evaporation in the denuder and the excess gas adsorbed on denuder walls, for SVOC with Csat = 1000 µg m−3, number concentration of 105 #/cm3 for three different diameters: 0.1 µm, 0.25 µm, and 0.5 µm.
For the particle diameter of 0.1 µm and (0.1 < < 1 and 0.01 < t* < 0.2), the regression equations are given by:
(22)
(22)
(23)
(23)
For the particle diameter of 0.25 µm and (0.1 < < 1 and 0.1 < t* <1), the regression equations are given by:
(24)
(24)
(25)
(25)
For the particle diameter of 0.5 µm and (0.1 < <1 and 0.1 < t* < 1), the regression equations are given by:
(26)
(26)
(27)
(27)
All these regression equations are accurate at a 95% confidence level. The regression equations for percentage mass loss for the particle diameters have the adjusted R2 ≈ 1, and the equations for the excess gas adsorbed in denuder walls have the adjusted R2 ≈ 0.96. For desired (allowable) error in the measurements, one can choose and
values from these equations. For example, if the aerosol entering the denuder is monodisperse with diameter = 0.25 µm, then, for
= 0.1 and
= 1.0, the particle will lose 57% of its mass due to evaporation in the denuder, and the amount of excess gas adsorbed by the denuder walls will be 45%.
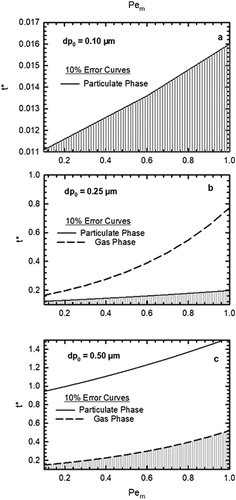
These equations are very useful in designing a denuder such that the error due to sampling artifacts lies within an allowable limit (e.g., 10%). The saturation concentrations of SVOCs lie within 1–1000 µg m−3. Among the SVOCs, species with saturation concentrations of 1000 µg m−3 will have the maximum possible error due to evaporative losses. Therefore, the sampling artifacts in SVOCs measurement will be negligible if the errors for the worst-case scenario, that is, for Csat = 1000 µg m−3, lie within the acceptable limits. The regression EquationEquations (22)–(27) were used to evaluate the and
values (operating region) such that error in both the particle- and gas-phase measurements lies below 10% (assuming that this is an acceptable level of error). The shaded area in corresponds to the region in which the errors due to sampling artifacts are within the acceptable limit of 10%. It can be seen from that the error in particulate phase is the dominant error for the particles of size 0.1 µm and 0.25 µm whereas the error in gas phase is the dominant error for the particles of size 0.50 µm. Thus, the error which defines the boundary of operating region of the denuder is a function of particle diameter and shifts from particulate phase to gas phase as the controlling parameter with the increase in the particle diameter. can be used as a guide for designing the denuder and for selecting appropriate operating conditions so that the sampling artifacts are reasonably small.
Figure 7. Pem and t* curves corresponding to 10% error in gas and particulate phase measurements for inlet particle diameters of (a) 0.1 µm, (b) 0.25 µm, and (c) 0.5 µm. The shaded area corresponds to the region where the error due to denuder sampling artifacts lies below 10%. For this simulation, Csat = 1000 µg m−3, N = 1011 # m−3.
The developed model was then used to evaluate SVOC sampling artifacts for a typical denuder used in the field. In this work, the multiparallel plate denuder developed by Delgado-Saborit, Stark, and Harrison (Citation2013) for the sampling of PAHs was selected for the analysis. The denuder parameters and the operating conditions are listed in . The authors report a result assuming no biases. The developed model was used to calculate the error in measurements due to sampling artifacts for the experimental SVOC phase partitioning data. The simulations were carried out for two of the cases listed in the article: (1) indoors combustion (ETS), where the denuder was operated at the flow rate of 3 lpm and (2) outdoors traffic (roadside), where the denuder was operated at the higher flow rate of 30 lpm. Although the measured aerosol was polydisperse, the majority of the particles were reported to be less than 0.56 µm in size. Therefore, the calculation is done for an average particle diameter of 0.2 µm. Initially, the concentrations of each species in the gas and particulate phase, as measured by denuder, were used as the input for the simulation. The mass loss for each species due to denuder sampling and the inlet concentration was updated based on difference between the simulation output and the experimental data. The initial conditions were updated by repeating the above process until the output of the simulation matched the experimental data.
Table 3. Simulation parameters and denuder dimensions.
Clearly, the inlet conditions (or the ambient state) are different than that measured at the outlet due to the potential biases inside the denuder. This error was calculated for each species based on the process described earlier for both high and low flow cases. The errors of the volatile organic species with the saturation concentration >1000 µg m−3 were very high, while the error in measurements of species with the saturation concentration <100 µg m−3 was negligible. The simulation results are listed in for various SVOCs. It can be seen from that for the low flow case, the error in particle-phase measurements of SVOCs is as high as 86.1% for phenanthrene. For the high flow case, error in particle-phase measurements for phenanthrene is 15.6%. It can be concluded from these results that measurement of SVOCs using a denuder and just attributing these to the ambient values could involve substantial artifacts. The magnitude of these artifacts depends on the sampling flow rate and the volatility of the particles and, as expected, is significant at lower flow rate and for the species with higher volatility.
Table 4. The experimental data for concentrations of SVOCs in the gas and particulate phase (Delgado-Saborit, Stark, and Harrison (Citation2013)) vs. the gas- and particulate-phase concentrations calculated in this study obtained by correcting for particle evaporation in the denuder.
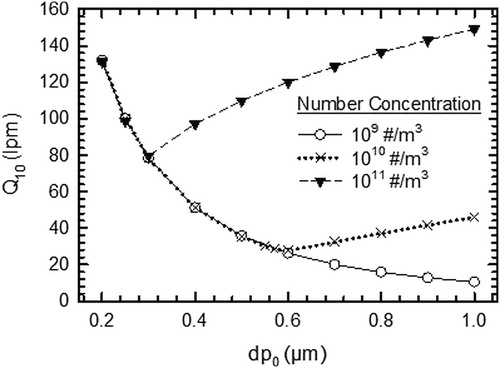
To demonstrate the usefulness of our model, operating conditions (flow rate, Q10) for the Delgado-Saborit, Stark, and Harrison (Citation2013) denuder that would result in low errors (< 10%) were established for a range of inlet diameters of the particle at various number concentrations. The saturation concentration of SVOC was assumed to be the limiting case of 1000 µg m−3. It can be seen from that for the particle number concentration of 109 # m−3, Q10 decreases with an increase in the particle diameter. The error in particle-phase measurement due to evaporative losses dominates the error in gas-phase measurements for the particle number concentration of 109 # m−3 over the diameter range shown in the . As the error in particle-phase measurement due to evaporative losses decreases with the increase in particle diameter, Q10 decreases with increase in particle diameter for the particle number concentration of 109 # m−3. However, it can be observed that for the number concentration of 1010 # m−3 and 1011 # m−3, Q10 first decreases and then increases with the increase in inlet particle diameter. This is so because for these number concentrations, there is a switch in the dominant error from the particle phase (at smaller diameters) to error in gas phase due to excess gas adsorption (at larger particle diameters). The error in particle-phase measurement decreases while the error in gas-phase measurement increases with the increase in particle diameter. This results in decrease and then eventual increase of Q10 with the increase in inlet particle diameter. The denuder should be operated at the flow rate which is greater than or equal to Q10 so that the error due to sampling artifacts is not significant (≤ 10%).
Figure 8. Flow rate corresponding to 10% error in denuder measurements as the function of inlet particle diameter at various particle concentrations. For this simulation, the species diffusivity, molecular weight, density, and Kelvin effect factor are 4 × 10⁻⁶ m2 s−1, 200 g mol−1, 1000 kg m−3, and 0, respectively. Gas and particles are assumed to be in equilibrium at the denuder inlet.
4. Conclusions
A comprehensive model that accounts for simultaneous gas diffusion and aerosol evaporation was developed to evaluate and quantify the artifacts in the denuder sampling of the gas and particulate phase of SVOCs. The model equations were also cast into dimensionless form for mathematical simplicity, and a sensitivity analysis was carried out to investigate the effects of important governing parameters, ,
,
, and
, on the sampling artifacts. The sensitivity analysis showed that these parameters, which are the function inlet particle diameter, particle concentration, flow rate, and species properties, have a strong influence on the denuder sampling artifacts.
The present study demonstrated that the sampling of a variety of SVOCs could result in significant particulate phase loss and excess gas adsorption due to aerosol evaporation in the denuder. The developed model was used to evaluate the SVOC sampling artifacts for a typical denuder used in the field and it was observed that the species can undergo a substantial loss from particle phase due to evaporation, depending on the volatility of the species. The error could be significant for those species in VBS space with saturation concentration greater than 1000 µg m−3. Thus, significant artifacts (positive for gases and negative for particle mass) can occur during sampling organic aerosols in a diffusion denuder, which can lead to errors in determining gas-to-particle phase partitioning of these compounds. The model equations developed in this study can also be used to design a denuder so that the sampling artifacts are minimized.
Additional information
Funding
References
- Bai, H., C. S. Lu, and Y. M. Lin. 1995. A theoretical study on the evaporation of dry ammonium chloride and ammonium nitrate aerosols. Atmos. Environ. 29 (3):313–321. doi: 10.1016/1352-2310(94)00257-L.
- Bidleman, T. F. 1988. Atmospheric processes. Environ. Sci. Technol. 22 (4):361–367. doi: 10.1021/es00169a002.
- Biswas, P., C. S. Lu, M. Xu, and S. E. Pratsinis. 1990. Design equations for gas sampling in diffusion denuders and the effects of particle dissociation, in Transactions: Visibility and Fine Particles, C. V. Mathai, ed., Air & Waste Management Association, Pittsburgh, PA, pp. 131–145.
- Boström, C. E., P. Gerde, A. Hanberg, B. Jernström, C. Johansson, T. Kyrklund, A. Rannug, M. Törnqvist, K. Victorin, and R. Westerholm. 2002. Cancer risk assessment, indicators, and guidelines for polycyclic aromatic hydrocarbons in the ambient air. Environ. Health. Perspect. 110 (Suppl 3):451–488. doi: 10.1289/ehp.110-1241197.
- Cabada, J. C., S. Rees, S. Takahama, A. Khlystov, S. N. Pandis, C. I. Davidson, and A. L. Robinson. 2004. Mass Size Distributions and Size Resolved Chemical Composition of Fine Particulate Matter at the Pittsburgh Supersite. Atmos. Environ. 38 (20):3127–3141. doi: 10.1016/j.atmosenv.2004.03.004.
- Cincinelli, A., F. Pieri, T. Martellini, M. Passaponti, M. Del Bubba, S. Del Vento, and A. A. Katsoyiannis. 2014. Atmospheric occurrence and gas-particle partitioning of PBDEs in an industrialised and urban area of Florence, Italy. Aerosol Air Qual. Res 14 (4):1121–1130. doi: 10.4209/aaqr.2013.01.0021.
- Delgado-Saborit, J. M., C. Stark, and R. M. Harrison. 2013. Use of a versatile high efficiency multiparallel denuder for the sampling of PAHs in ambient air: Gas and particle phase concentrations, particle size distribution and artifact formation. Environ. Sci. Technol. 48 (1):499–507. doi: 10.1021/es402937d.
- DeMarcus, W., and J. W. Thomas. 1952. Theory of a diffusion battery (No. ORNL-1413), Oak Ridge National Lab, Y-12 Area.
- Donahue, N. M., A. L. Robinson, C. O. Stanier, and S. N. Pandis. 2006. Coupled partitioning, dilution, and chemical aging of semivolatile organics. Environ. Sci. Technol. 40 (8):2635–2643. doi: 10.1021/es052297c.
- Friedlander, S. K. 2000. Smoke, dust, and haze: Fundamentals of aerosol dynamics. topics in chemical engineering, 2nd ed. New York: Oxford University Press.
- Galarneau, E., and T. F. Bidleman. 2006. Modelling the temperature-induced blow-off and blow-on artefacts in filter-sorbent measurements of semivolatile substances. Atmos. Environ. 40 (23):4258–4268. doi: 10.1016/j.atmosenv.2006.04.006.
- Goldstein, A. H., and I. E. Galbally. 2007. Known and unexplored organic constituents in the earth’s atmosphere. Environ. Sci. Technol. 41 (5):1514–1521. doi: 10.1021/es072476p.
- Hallquist, M., J. C. Wenger, U. Baltensperger, Y. Rudich, D. Simpson, M. Claeys, J. Dommen, N. M. Donahue, C. George, A. H. Goldstein, et al. 2009. The formation, properties and impact of secondary organic aerosol: Current and emerging issues. Atmos. Chem. Phys. 9 (14):5155–5236. doi: 10.5194/acp-9-5155-2009.
- Heudorf, U., V. Mersch-Sundermann, and J. Angerer. 2007. Phthalates: Toxicology and exposure. Int. J. Hyg. Environ. Health. 210 (5):623–634. doi: 10.1016/j.ijheh.2007.07.011.
- Hildemann, L. M., M. A. Mazurek, G. R. Cass, and B. R. T. Simoneit. 1991. Quantitative characterization of urban sources of organic aerosol by high-resolution gas chromatography. Environ. Sci. Technol. 25 (7):1311–1325. doi: 10.1021/es00019a014.
- Ianniello, A., F. Spataro, G. Esposito, I. Allegrini, E. Rantica, M. P. Ancora, M. Hu, and T. Zhu. 2010. Occurrence of gas phase ammonia in the area of Beijing (China). Atmos. Chem. Phys. 10 (19):9487–9503. doi: 10.5194/acp-10-9487-2010.
- Isaacman-VanWertz, G., L. D. Yee, N. M. Kreisberg, R. Wernis, J. A. Moss, S. V. Hering, S. S. De Sá, S. T. Martin, M. L. Alexander, B. B. Palm, et al. 2016. Ambient gas-particle partitioning of tracers for biogenic oxidation. Environ. Sci. Technol. 50 (18):9952–9962. doi: 10.1021/acs.est.6b01674.
- Jo, D. S., R. J. Park, M. J. Kim, and D. V. Spracklen. 2013. Effects of chemical aging on global secondary organic aerosol using the volatility basis set approach. Atmos. Environ. 81:230–244. doi: 10.1016/j.atmosenv.2013.08.055.
- Kroll, J. H., A. W. Chan, N. L. Ng, R. C. Flagan, and J. H. Seinfeld. 2007. Reactions of semivolatile organics and their effects on secondary organic aerosol formation. Environ. Sci. Technol. 41 (10):3545–3550. doi: 10.1021/es062059x.
- Lane, T. E., N. M. Donahue, and S. N. Pandis. 2008. Simulating secondary organic aerosol formation using the volatility basis-set approach in a chemical transport model. Atmos. Environ. 42 (32):7439–7451. doi: 10.1016/j.atmosenv.2008.06.026.
- Li, Y., F. M. Schwandner, H. J. Sewell, A. Zivkovich, M. Tigges, S. Raja, S. Holcomb, J. V. Molenar, L. Sherman, C. Archuleta, et al. 2014. Observations of Ammonia, nitric acid, and fine particles in a rural gas production region. Atmos. Environ. 83:80–89. doi: 10.1016/j.atmosenv.2013.10.007.
- Liu, Z., B. Hu, J. Zhang, Y. Yu, and Y. Wang. 2016. Characteristics of aerosol size distributions and chemical compositions during wintertime pollution episodes in Beijing. Atmos. Res. 168:1–12. doi: 10.1016/j.atmosres.2015.08.013.
- Longnecker, M. P., W. J. Rogan, and G. Lucier. 1997. The human health effects of DDT (dichlorodiphenyltrichloroethane) and PCBS (polychlorinated biphenyls) and an overview of organochlorines in public health. Annu. Rev. Public Health 18 (1):211–244. doi: 10.1146/annurev.publhealth.18.1.211.
- Lu, C., H. Bai, and Y. M. Lin. 1995. A model for predicting performance of an annular denuder system. J. Aerosol Sci. 26 (7):1117–1129. doi: 10.1016/0021-8502(95)00035-B.
- Pankow, J. F. 1987. Review and comparative analysis of the theories on partitioning between the gas and aerosol particulate phases in the atmosphere. Atmos. Environ. 21 (11):2275–2283. doi: 10.1016/0004-6981(87)90363-5.
- Possanzini, M., V. Di Palo, P. Gigliucci, M. C. T. Scianò, and A. Cecinato. 2004. Determination of phase-distributed PAH in Rome ambient air by denuder/GC-MS method. Atmos. Environ. 38 (12):1727–1734. doi: 10.1016/j.atmosenv.2003.12.024.
- Shrivastava, M., J. Fast, R. Easter, W. I. Gustafson, Jr., R. A. Zaveri, J. L. Jimenez, P. Saide, and A. Hodzic. 2011. Modeling organic aerosols in a megacity: Comparison of simple and complex representations of the volatility basis set approach. Atmos. Chem. Phys. 11 (13):6639–6662. doi: 10.5194/acp-11-6639-2011.
- Tan, C., and J. Thomas. 1972. Aerosol penetration through a parallel-plate diffusion battery. J. Aerosol Sci. 3 (1):39–43. doi: 10.1016/0021-8502(72)90139-5.
- Xie, M., M. P. Hannigan, and K. C. Barsanti. 2014. Gas/particle partitioning of n-alkanes, PAHs and oxygenated PAHs in urban Denver. Atmos. Environ. 95:355–362. doi: 10.1016/j.atmosenv.2014.06.056.
- Zhao, Y., N. M. Kreisberg, D. R. Worton, A. P. Teng, S. V. Hering, and A. H. Goldstein. 2013. Development of an in situ thermal desorption gas chromatography instrument for quantifying atmospheric semi-volatile organic compounds. Aerosol Sci. Technol. 47 (3):258–266. doi: 10.1080/02786826.2012.747673.