
Abstract
We create and qualify a Volatility and Hygroscopicity Tandem Differential Mobility Analyzer (VH-TDMA) for the study of aerosols. This VH-TDMA measures size distributions, volatility, and hygroscopicity and includes an auxiliary conditioner that allows quick connection to other external aerosol conditioners. The differential mobility analyzers are not temperature controlled, allowing the surrounding environment to influence the measurement conditions, and this is fully accounted for when measuring aerosol volatility and hygroscopicity. For the volatility conditioner, the VH-TDMA uses a 15 m coil of tubing in an oven to evaporate aerosol samples at elevated temperatures. We measured several single component model aerosols to qualify the differential mobility particle sizer (DMPS) channel and each of the conditioners: hygroscopicity and volatility. Due to insufficient power supply calibration in this study, the TDMA channel is limited to particle sizes greater than 70 nm. The DMPS channel was able to reproduce ammonium sulfate size distributions when compared to common scanning mobility particle sizers. For hygroscopicity, the standard deviation in the measured ammonium sulfate growth factors was 0.03 over a 4-h experiment. From this data, the TDMA has an observed relative humidity error of ±0.6% with manufacturer reported error of ±1.2% relative humidity. The volatility channel reproduced the previously published saw tooth pattern of room temperature saturation vapor pressures from atomized C3-C9 diacids. The maximum percent difference in room temperature saturation vapor pressure was approximately 80%. The enthalpy of sublimation derived from the diacids increased monotonically (except for suberic acid) and resembled measurements from mass effusion techniques.
Copyright © 2019 American Association for Aerosol Research
Introduction
Atmospheric aerosols are solid or liquid particles suspended in the atmosphere. These particles directly interact with sunlight causing changes in the Earth’s energy balance by absorbing and scattering incident light. When suspended in the atmosphere, the aerosol particles scavenge atmospheric water to create clouds which indirectly make alterations to the Earth’s energy balance (Boucher et al. Citation2013). At the ground level, atmospheric particles are small enough to enter the airways of humans and influence health events (Pope Citation2000). Primary particulate emissions can be natural (e.g. resuspension of soil, aerosolization of salt particles from sea spray, and emission of smoke from wildfires) or can be anthropogenic (e.g. combustion of fossil fuels, cooking of food, or emission from industrial or energy production; Hinds Citation1999). The amount and size of atmospheric particles are influenced by secondary chemical processes. For example, oxidation of atmospheric gases creates lower-volatility products that condense on existing particles and nucleate new ones. These oxidative processes can also react with the particles themselves fragmenting particle phase molecules, which can return to the gas phase (Goldstein and Galbally Citation2007). These primary and secondary processes define the chemical nature and the total mass of the atmospheric aerosol and therefore impact the Earth’s energy balance and human health.
A Tandem Differential Mobility Analyzer (TDMA) is made up of two Differential Mobility Analyzers (DMAs) in series and is suited to explore the primary and secondary processes that drive the chemical and physical evolution of atmospheric aerosol particles. A DMA classifies particles by electrical mobility which is directly related to the particle size (Knutson and Whitby Citation1975). When two DMAs are employed in series, the first DMA selects a particle size, an experiment is performed, and a second DMA measures the final size in conjunction with a Condensation Particle Counter (CPC). Therefore, the experiment between the DMAs must alter the size of the selected particles (Rader and McMurry Citation1986).
Three primary TDMA experiments are used to explore primary and secondary atmospheric aerosol processes. (1) For hygroscopicity, dry particles are selected by the first DMA, and these particles are placed in a humid environment. The particles absorb water by condensation, and the final diameter measured by DMA2 is related to hygroscopicity, which defines a particle’s affinity for water (Liu et al. Citation1978). Early hygroscopicity experiments left DMA2 under the influence of environmental temperature (Li, Montassier, and Hopke Citation1992; McMurry and Stolzenburg Citation1989). Modern TDMAs either heavily insulate the second DMA or place DMA2 and its tubing in a temperature controlled environment to increase hygroscopic measurement reproducibility (Duplissy et al. Citation2009). (2) For volatility, selected particles from DMA1 are placed in a heated environment to partially evaporate the condensed phase. The final diameter measured by DMA2 is related to the saturation vapor pressure of the aerosol particles (Rader, McMurry, and Smith Citation1987). Measuring saturation vapor pressure as a function of temperature allows the estimation of the enthalpy of sublimation or vaporization (De Nevers Citation2012). Volatility experiments often use a short, electrically heated tube to establish the heated experimental environment (Hong et al. Citation2017; Wehner, Philippin, and Wiedensohler Citation2002). (3) For reactions, selected particles from DMA1 are passed through a chemical reactor. The final diameter measured by DMA2 is related to either the condensation of gaseous chemical products, or the evaporation of condensed phase chemical products. From these measurements, reaction rates can be calculated (McMurry, Takano, and Anderson Citation1983).
We have created a Volatility and Hygroscopicity TDMA (VH-TDMA) system capable of measuring the size distribution, hygroscopicity, and volatility of aerosols. Additionally, the TDMA exists on a portable platform with an auxiliary conditioner allowing quick connection to reaction chambers. The hygroscopicity conditioner is only lightly insulated and performs commensurate to many temperature controlled counterparts. The volatility conditioner includes a 15 m coil in an oven which is more accurate than our first design: two short, electrically heated tubes. The TDMA is able to reproduce the hygroscopicities, saturation vapor pressures, and enthalpies of sublimation and vaporization of atomized single component model aerosols as well as measure size distributions. Here, we describe the key measurement features and highlight main results from instrument performance testing. Greater details on instrument design, derived formulas for hygroscopicity and volatility parameters, and laboratory testing results are offered in the online supplementary information (SI) document and are referenced throughout this main document.
Design requirements
There are many design requirements for a TDMA. We explore flow rates, relative humidity, and oven temperature below. Additional design specifications can be found throughout the supplement. Sheath and aerosol flow rates in this open flow TDMA should be accurate and stable to ensure correct measurement of diameter. The sheath flow rate should not vary more than 2%. The aerosol flow rate should be accurate to within 5% (Wiedensohler et al. Citation2012). In addition to flow rate, hygroscopicity measurements require accurate measurement and control of relative humidity (Massling et al. Citation2011), and volatility measurements require accurate characterization of evaporation temperature. displays the TDMA flow diagram. A detailed description of the flow diagram and the individual pieces of equipment can be found in SI S2, and the atomization and pretreatment assembly used in all experiments is described in SI S1.
Figure 1. TDMA flow chart. Pressures and temperatures used to determine the designed orifice flows rates are noted. The sample inlet is at the top left, and the conditioning area is shaded. The two DMAs are labeled and shaded. Particle counting is at the bottom right.
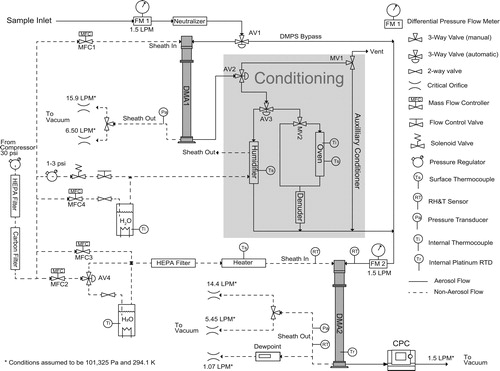
The aerosol flow rate is measured by two differential pressure flow meters. The differential pressure flow meters (FM1 and FM2) are calibrated individually using a bubble flow meter (Figure S2). When in differential mobility particle sizer (DMPS) mode, the aerosol flow passes through both flow meters. The two measurements can be used to estimate error in calibration. The average difference in flow rate was 0.003 LPM, which is less than 0.2% of the 1.51 LPM flow rate. Errors due to changes in laboratory temperature and pressure create an additional 1.3% total error in aerosol flow measurement. Larger errors can occur when moving the instrument to areas with different atmospheric conditions. This underscores the necessity of calibration when deploying the instrument. The stability of the sheath flow can also be estimated using FM1 and FM2. Since the aerosol flow rate is controlled by the balance of exiting DMA orifice flows and entering sheath mass flow rate, the variation in inlet aerosol flow rate encompasses all variation in sheath flows. The aerosol flow rate varies by about 0.01 LPM. When operating at a sheath flow of 6 LPM, the aerosol flow variation is well under the required 2%. This error is consistent with the accuracy of the mass flow controller. The error (±1%) due to the mass flow controller in high flow (approximately 16 LPM) is assumed to be as reported by the manufacturer, and the reported error is well below 2%.
Relative humidity measurement is critical to hygroscopicity accuracy. DMA2 is insulated with a single layer of insulation tape and the inlet streams (sheath and aerosol) have no insulation. Therefore, changes in environmental temperature will influence the inlet streams and DMA2 unequally. We have chosen to use two different relative humidity control methods for lab and field conditions. For laboratory conditions, the first method fixes the dry air/wet air mixing ratio and the total flow to the aerosol humidifier and the DMA2 sheath. Under this method, which we refer to as dew point control, environmental temperature differences change the relative humidity of the DMA2 inlet streams. However, since DMA2 has a much larger thermal mass and light insulation, the relative humidity and dew point inside DMA2 is stable. Measurements of dew point temperature and DMA2 internal temperature by resistance temperature detector (RTD) are used to calculate relative humidity when operating under dew point control. The second method requires direct control of sheath and aerosol inlet relative humidity. The environmental temperature does not influence the relative humidity in the inlet streams, but the change in dew point of the inlet streams does change the internal dew point and relative humidity inside DMA2. The dew point meter is expected to not keep up with the changing dew point necessary for field deployment. In this situation, the RH&T probes are more accurate than the dew point-RTD method. The two control methods produce similar results under lab conditions (when ambient temperature fluctuates within ±1.5 °C). In this work, dew point control is used, and relative humidity control is intended to be used in field work.
The temperature measurement method is important to volatility. We use a large 0.12 m3 oven with 15 m of 3/8 inch thin walled copper tubing suspended inside. This setup provides a constant external tubing temperature and provides two advantages: (1) the long length of tubing enables measurement of saturation vapor pressures below 1 × 10⁻⁵ Pa and allows neglecting of entrance and exit lengths, and (2) a single internal temperature exists between the entrance and exit lengths. The oven temperature is controlled by a thermocouple outside the tubing but within the oven while the internal temperature is measured by a thermocouple in the aerosol flow beyond the influence of the exit and entrance lengths. We initially tried a 0.6 m length heater (residence time of 15 s) with resistance heating but were unable to obtain accurate enthalpies of sublimation.
The oven temperature measurement method provides a well characterized temperature for the calculation of phase transition enthalpy. Dew point control provides accurate measurement of relative humidity, and the results are comparable to direct relative humidity control. Measurements of flow rate in DMA1 and DMA2 are both stable and accurate. This flow measurement is required for accurate particle size selection. The differential flow meters must be recalibrated when the instrument is deployed to the field.
DMA accuracy and alignment
DMA1 must be able to accurately select particles of the correct diameter, and DMA2 must be able to accurately measure the size distribution after the intervening experiment. Flow rate and power supply voltage are the primary factors to accurate measurement. Flow rates measured above were accurate, and this section will directly test power supply accuracy. The two DMAs were checked against a 200 nm Polystyrene Latex Sphere (PSL) standard (Duplissy et al. Citation2009; Wiedensohler et al. Citation2012). However, alignment of the two DMAs should be checked across the entire operational range (Duplissy et al. Citation2009). As with flow rates, errors of 2% or less should be expected. Additional information about the following experiments can be found in SI S3.
A 203 nm PSL standard was atomized and sent to DMA1 and DMA2 individually. Diameters smaller than 150 nm are difficult to characterize due to additional solutes in the PSL solution. Under high sheath flow conditions, the instrument is limited to diameters below 240 nm. Thus a PSL standard between 150 and 240 nm is the only valid diameter to compare both high flow and low flow (approximately 6.5 LPM) in DMA1 and DMA2. For this experiment, a single power supply (DMA2) is used to test both DMAs. The DMA2 check (Figure S7) showed that both high flow and low flow agree with the standard within 1 nm. For the DMA1 test, the DMA2 power supply was connected to DMA1. In high flow, DMA1 agrees within 1 nm, and in low flow, DMA1 measures just over 1 nm from nominal (Figure S8). The standard used had a certified accuracy of ±5 nm. Therefore error in the standard exceeds the error in both DMA1 and DMA2, and both DMAs in conjunction with the DMA2 power supply perform within ±5 nm at 203 nm.
displays the test of alignment across the intended range of the TDMA using ammonium sulfate particles. The x-axis is the DMA1 set point, and the y-axis is the percent error of DMA2 relative to DMA1. Points above the x-axis denote DMA2 being biased larger than DMA1. The grayed area on the plot represents the range of errors between DMA1 and DMA2 measured in the PSL experiment above. The legend shows which flow rate was chosen for the two DMAs. For example, the squares represent DMA1 in low sheath flow and DMA2 in high sheath flow. Explanation of the set-up for the experiment is covered in SI S3.
Figure 2. Sizing accuracy between the two DMAs. The data presented is the result of comparing the diameters of DMA1 and DMA2. In the legend, the first high/low represents the DMA1 sheath flow while the second high/low represents the sheath flow in DMA2 (e.g. squares are with DMA1 in low flow while DMA2 is in high flow). Error bars are the 95% confidence intervals of the mean value. Grey area represents error from PSL experiment at 203 nm. Dashed lines indicate the desired ±2% error.
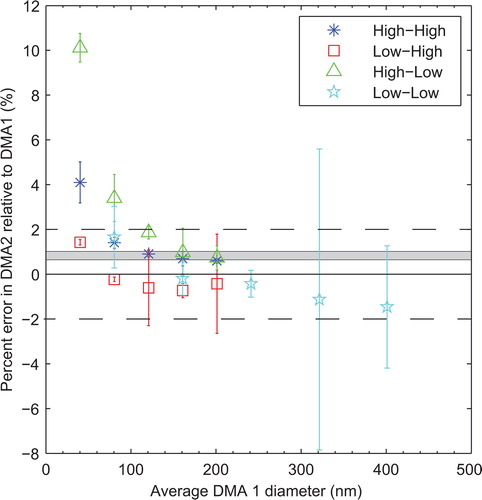
Based on , the ammonium sulfate experiment agrees with the error at 203 nm from PSL experiment (gray area). However, unlike the PSL experiment above, this alignment experiment includes an additional power supply for DMA1. Thus, the errors seen in include voltage bias between the two power supplies. A clear trend of larger biases at smaller diameters exists. This observation is consistent with a voltage error existing between the two power supplies. Using the flow rates from above, our estimate of voltage error is consistent with the stated accuracy of the two power supplies.
The absolute error of the two DMAs was within 2% using the DMA2 power supply. The relative error between DMA1 and DMA2 does include errors in excess of 2% when below 70 nm. This observation is consistent with a voltage error between the DMA1 power supply and the DMA2 power supply. Rather than calibrating the two power supplies, we chose to limit investigations to diameters equal to or above 70 nm. With this limitation, the TDMA is able to select and measure mobility diameters to within 2% and particle losses are minimized (SI S4a and S2f).
DMPS
Although the TDMA is not intended to provide size distribution measurements, the TDMA can supplement other size distribution tools. There are many requirements to ensure accuracy and inter-comparability between size distribution measurement systems. When operating in DMPS mode, the TDMA should ensure relative humidity is less than 40%, the error in aerosol flow should be less than 5%, the sheath flow should vary by less than 2%, and the temperature and pressure should be measured prior to DMA entrance (Wiedensohler et al. Citation2012). Here, we utilize DMA2 for DMPS measurement. The TDMA meets all these requirements except pressure measurement, which is performed after DMA2. Particle loss through the tubing, neutralizer, and DMA should be quantified. In this study, particle losses in DMA2 were not considered. The particle loss results and CPC counting efficiencies should be included in the inversion process, and the DMA2 alignment should be confirmed. Particle loss (Friedlander Citation2000), CPC counting efficiencies (Hermann et al. Citation2007), and inversion methods (Hagen and Alofs Citation1983) can be found in SI S4. Finally, the TDMA should be compared with other size distribution methods, and this experiment is documented in SI S4c. A TSI model 3696, which adheres to Wiedensohler et al. (Citation2012), is used for comparison.
Comparisons of particle size distributions between the custom DMPS system developed here and a commercially available scanning mobility particle sizer (SMPS), the TSI model 3696, are shown in . The asterisks corresponding to “SMPS (TDMA high)” were taken simultaneously to the high flow DMPS data, while the triangles corresponding to “SMPS (TDMA low)” were taken simultaneously to the low flow DMPS data. The dash line displays the results of the DMPS scan while the DMA2 sheath was set to low flow. The dotted line displays the DMPS results using a high sheath flow rate. In low flow, the capability range of the DMA is 20–240 nm. In high flow, the capability range of the DMA is 20–450 nm. The table included in displays the zeroth moment of the distribution (M0) in number per cubic centimeter, and the second column displays the number average particle diameter, defined as the first moment (M1) divided by the zeroth moment in nanometers (M1/M0). In both columns, the moment is computed between 20 and 240 nm. This range allowed the comparison of the two DMPS sheath flows (high and low) with the SMPS. Performing the two moments across the entire range to compare low DMPS flow to the SMPS (TDMA low) does not significantly alter the results.
Figure 3. Comparison of the TDMA DMPS channel to a TSI SMPS 3696. The DMPS high flow denotes that the sheath flow rate is high, and DMPS low flow denotes that the DMA2 sheath flow is low. SMPS (TDMA high) and (TDMA low) denotes the comparison dataset, for example, DMPS high flow taken simultaneous to SMPS (TDMA high). Since nothing changed with the SMPS instrument or experimental setup between high and low flow experiments, the two SMPS measurements should equate. M0 in the table denotes the zeroth moment of the distributions evaluated between 20 and 240 nm. M1/M0 is the number based average diameter evaluated over the same range.
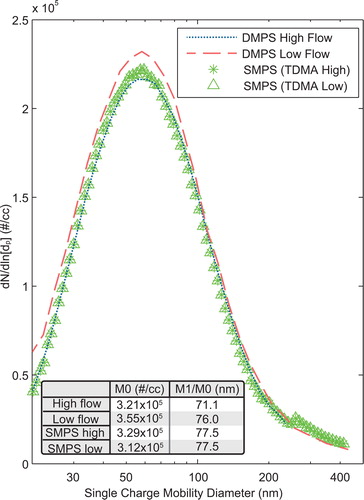
The shape of all distributions, characterized by the number average particle diameter, is very similar as is the number concentrations. The SMPS curve changes slightly in shape at 250 nm due to lack of charge correction at the largest diameters. The TDMA assumes a distribution beyond the largest bin (see SI S4b) and thus charge corrects all measured bins. The upper limit of the moments is 240 nm, and does not reflect the differences in multi-charge correction. The total particle counts from the SMPS scans are 5% different from one another showing aerosol consistency throughout the experiment. We see that in high flow, the error in total population measurement is 2% while in low flow the error is 12% different.
The DMPS channel of the TDMA meets nearly all requirements for size distribution measurements. Only two discrepancies exist: (1) location of the absolute pressure measurement, and (2) no consideration of losses within DMA2. If losses within the DMA were included, both DMPS responses would increase. Therefore, both DMPS curves should be shifted up slightly. This change would close the error between high flow and the SMPS value while increasing the error in the low flow values. In the technical standards harmonization experiment (Wiedensohler et al. Citation2012), errors of up to 10% were reported at diameters below 200 nm. Thus, the error in high flow measurements is well below this value while low flow is slightly higher.
Hygroscopicity
We sampled six atomized single component model aerosols at or above 90% relative humidity to evaluate capability of the hygroscopicity conditioner. Petters and Kreidenweis (Citation2007) developed a relationship between diameters, relative humidity, and hygroscopicity; and we used this relation to determine hygroscopicity. The relationship requires the instrument accurately measure relative humidity especially when assessing high growth aerosols. Methods detailing the experiment, calculation of hygroscopicity, and choice of error are detailed in SI S6. Relative humidity is first calibrated using ammonium sulfate and published empirical relationships (Tang and Munkelwitz Citation1994). Insulated and climate controlled TDMAs have stable ammonium sulfate growth factors with a standard deviations of less than 0.07 (Massling et al. Citation2011). But our chosen control method sets the dew point, not relative humidity. Therefore, deviation in relative humidity (measured relative humidity vs relative humidity calculated by growth factor) is a better metric than growth factor standard deviation. We also measured five additional atmospherically relevant single component model aerosols.
To ensure relative humidity accuracy, calibration of the TDMA is performed using ammonium sulfate and the empirical relations mentioned above. To accomplish this, ammonium sulfate was aerosolized for just over 4 h. Relative humidity for each scan was calculated using the measured dew point and temperature inside DMA2 (Buck Citation1981). The growth factor of every scan was calculated, and the actual relative humidity determined from the empirical relationships. The mean of both data series was calculated and a required shift in mean relative humidity determined. The measured temperature inside DMA2 is adjusted to shift the relative humidity so that the two calculated means agree. For this dataset, the measured temperature in DMA2 was shifted down 0.27 °C to eliminate relative humidity inaccuracy. displays the error prior to adjustment. This calibration method is for the lab only. The RTD is not used in field measurements; RH&T probes are used instead. The RH&T probes are calibrated with ammonium sulfate as documented in SI S2e.
Figure 4. Error in relative humidity and growth factor over 4 h at laboratory conditions while operating under dew point control. The short dashed line represents the measured relative humidity, calculated from the dew point temperature and the measured absolute temperature. The long dashed line is the measured growth factor. The solid line is the calculated relative humidity from the growth factor measurements. Oscillations were caused by changes in room temperature.
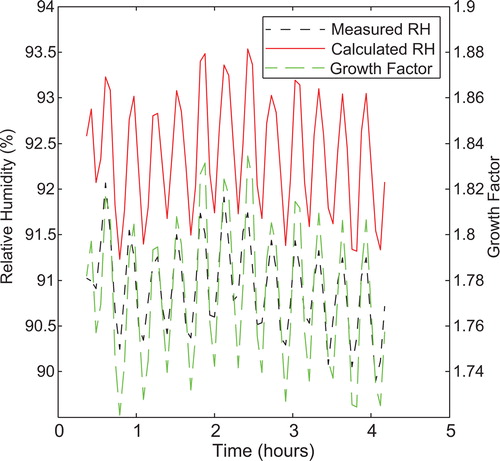
displays the growth factors measured during ammonium sulfate calibration in addition to the measured and actual relative humidity over the four hour experiment. The standard deviation of the measured growth factors is 0.032, which is well below the highest standard deviations reported for temperature controlled TDMAs (0.07). When controlling relative humidity of the inlet streams, instead of dew point control, the variation in growth factor is comparable to the measured 0.032. After calibration, the mean of the measured relative humidity from dew point and absolute temperature shifts up to match the mean of the calculated relative humidity (Tang and Munkelwitz Citation1994) obtained from the growth factor data. Figure S12 plots the difference between these two values after the adjustment. We see from this plot that the TDMA can maintain a relative humidity accuracy of approximately ±0.6%. The error in dew point temperature, as stated by the manufacturer, is 0.2 °C, and the error in the DMA2 RTD is 0.15 °C. Assuming these two stated errors represent ±3 standard deviations, the manufacturer estimated error at 90% relative humidity is ±1.2%. We assume that ±0.6% of the stated manufacturer error occurs within experiment while the remainder is long term instrument error.
The TDMA reproduced hygroscopicities of five additional atmospherically relevant single component model aerosols ranging from 0 to 0.5 (). This experiment lasted several days and is assumed to be subject to long term variation. The long term error, ±1.2%, is much larger than all other errors associated with the TDMA (SI S6d). Therefore, we have chosen to estimate the measurement uncertainty in hygroscopicity by assuming a low and high relative humidity offset from the mean by 0.6%. The table not only displays estimates in hygroscopicity from other TDMAs for direct comparison, but also displays results from Cloud Condensation Nucleus Counters (CCN), Electrodynamic Balances (EDB), and Aerosol Optical Tweezers (AOT). Levoglucosan, oleic acid, and fructose match all previously published work. Glutaric and malonic acid matches with AOT and EDB values. The measured value for ammonium sulfate hygroscopicity, which deviates from the published values, agrees with Tang and Munkelwitz (Citation1994). The TDMA is able to reproduce hygroscopicities from near zero to the equivalent of ammonium sulfate.
Table 1. Measured hygroscopicities of six standards.
The standard deviation in growth factor was below 0.07, but this comparison is not representative of our control method. This metric assumes that the TDMA attempted to control relative humidity. But our control system allows movement in relative humidity and correctly measures the movement of relative humidity associated with a change in growth factor (). Assuming the measured relative humidity deviation of ±0.6% from Figure S12 represents ±3 standard deviations, we can use the empirical relations from Tang and Munkelwitz (Citation1994) to calculate the associated growth factor assuming a nominal relative humidity of 90%. This calculation results in standard deviation in growth factor of 0.01, well below 0.07. Also, we should make two experimental notes: (1) room temperature changed by ±1.4 °C over the 4 h and causes the cycles seen in and (2) individual ammonium sulfate scans were approximately 4 min in length. Over this 4-min period, the TDMA averages 525 individual measurements of dew point and DMA2 temperature to determine the characteristic relative humidity.
Volatility
Qualification of the volatility conditioner of the VH-TDMA requires comparison to known single component model aerosols using established methods. The mass evaporated from an aerosol is not only a function of oven residence time, but also the evaporation temperature and the chemical composition. All three of these variables interact with one another and must be considered. Previous authors compared thermograms and/or temperature of complete evaporation of a single component model aerosol (Villani et al. Citation2007), typically ammonium sulfate. These two methods require the same oven residence time for direct comparison. To properly test the volatility conditioner, the residence time and characteristic temperature should be tested independently. Additionally, the choice of single component model aerosol should reflect the aerosol to be studied. We propose and use an established method to measure saturation vapor pressure at room temperature, which tests the choice of oven residence time. We then measure saturation vapor pressures at several elevated temperatures and calculate the phase change enthalpy, which tests the associated characteristic oven temperature. Saturation vapor pressures and phase change enthalpies of single component model aerosols are available, allowing investigators to choose the appropriate models to qualify their instruments.
We evaluate the capability of the volatility conditioner by measuring the saturation vapor pressure and sublimation enthalpy of nine diacid single component model aerosols. To do this, a relationship between diameters measured by DMA2, before and after heating, is chosen to calculate saturation vapor pressure (Zhang, Seifeld, and Flagan Citation1993). This relationship assumes a constant evaporation temperature throughout the oven. The Clausius-Clapeyron equation is then used in conjunction with the measured temperature and saturation vapor pressure to calculate the phase change enthalpy (Sandler and Sandler Citation2006). Experimental methods, calculation methods, and errors are discussed in detail in SI S7. Our results are compared to previous results using the same V-TDMA method (Bilde et al. Citation2003) and results from the mass effusion method. The diacid single component model aerosols demonstrate the measurement limitations of the instrument and naturally occur in atmospheric aerosol (Lightstone et al. Citation2000). The TDMA must be accurate at all temperatures within the bounds of the instrument to be capable of measuring volatility.
Diacid saturation vapor pressures at room temperature are tabulated in and plotted in . These values are calculated using the Clausius-Clayperon curve fit evaluated at 296K and are not significantly different than the actual saturation vapor pressure measured at that temperature. Using a V-TDMA and this calculation method, Bilde et al. displayed an alternating saturation vapor pressure pattern where odd-numbered carbon chain length diacids displayed higher saturation vapor pressures than their evenly numbered neighbors. reproduces this “sawtooth” pattern by connecting asterisks. The largest discrepancy between our measured values (asterisks without a line) and Bilde is azelaic acid where our saturation vapor pressure is just over two and a half times the Bilde et al. value. All measured saturation vapor pressure values are within an order of magnitude and in some cases nearly identical (e.g., suberic acid). The variation in saturation vapor pressure between each diacid often exceeds an order of magnitude and allows us to easily reproduce the alternating pattern reported by Bilde et al.
Figure 5. Panel A: Comparison of measured saturation vapor pressure values of atomized diacids at room temperature against those measured by Bilde et al. The x-axis is the length of the carbon chain (e.g. 6 is adipic acid). The line is used to display the “sawtooth” pattern resulting from the measurements by Bilde et al. Panel B: Measured enthalpies of sublimation compared to Bilde et al and mass effusion techniques. The connected asterisks are from Bilde et al. The triangles are the results from mass effusion techniques. Unconnected asterisks are measured by the TDMA. The error bars represent the 95% confidence intervals resulting from the linear curve fits displayed in .
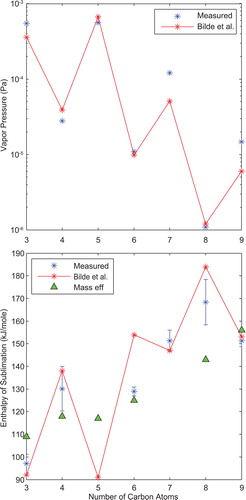
Table 2. Volatility data from the TDMA along with data from Bilde et al and Mass Effusion.
The enthalpy of sublimation reported in is shown graphically in . Bilde et al. reported an alternating pattern between the even and odd length carbon chains anti-correlated to the alternating pattern found in . We have connected the Bilde et al. points in to display the pattern. Our sublimation enthalpies do not indicate this pattern. Also plotted in are sublimation enthalpies obtained by mass effusion by sublimation. The enthalpies of sublimation by mass effusion do not show an alternating pattern and appear to monotonically increase with increasing carbon chain length. Similarly, our measured enthalpies of sublimation increase monotonically for all but suberic and azelaic acid.
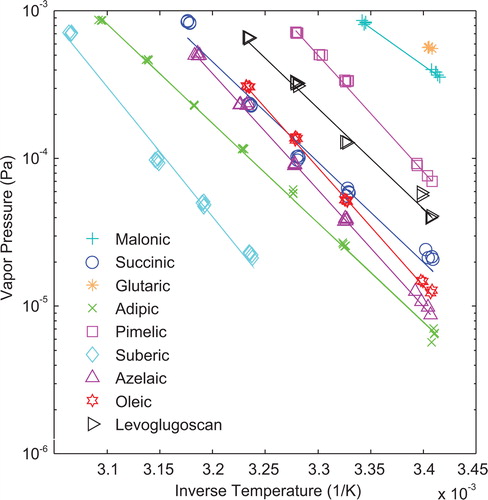
plots the saturation vapor pressure as a function of inverse temperature and displays the oven measurement limits. A y-axis value of 9.1 × 10⁻⁴ Pa is the approximate upper measurement limit of the current oven design. At this point, the particles have fully evaporated and are unmeasurable. The lower measurement capability is at approximately 6.1 × 10⁻⁶ Pa. At this lower point, the particle does not evaporate enough to detect a significant size shift. Additionally, the minimum heated temperature for the volatility oven is approximately 28 °C or 3.32 × 10⁻³/K on the x-axis. The combination of this minimum heated temperature and the upper measurement limit of the oven prevents measurement of glutaric acid beyond room temperature. Therefore, a curve fit is not provided in , and the saturation vapor pressure given for glutaric acid is at room temperature (21.5 °C) instead of 296K.
Figure 6. Saturation vapor pressures and Clausius-Clapeyron equation fits for all evaluated compounds. Each line is a least squares curve fit of the recorded data. For glutaric acid, only a single data point is recorded. The upper saturation vapor pressure measurement limit for the instrument is approximately 9.1 × 10⁻⁴ Pa, while the lower measurement limit is approximately 6.1 × 10⁻⁶ Pa. The minimum elevated temperature is 28 °C or 3.32 × 10⁻³/K.
The TDMA was able to reproduce previously published diacid data and also measured two additional atmospherically relevant aerosols: levoglucosan and oleic acid. The enthalpy of sublimation for levoglucosan agrees well with published mass effusion data. However, the enthalpy of vaporization for oleic acid does not agree with the published value, which was determined from previously published Antoine constants. These Antoine constants for oleic acid were determined for a minimum temperature of 441K, which is significantly higher than our maximum evaluated temperature of 309K. But this discrepancy does not appear to fully explain the error. For uncertain reasons, oleic acid is evaporating faster than expected at elevated temperatures. We also found a monotonic increase in diacid enthalpy of sublimation with the exception of suberic acid. Recent review of literature on diacids has also shown an average monotonic increase in diacid enthalpy of sublimation (Bilde et al. Citation2015). We note that prior to this design, we attempted use of an electrically heated, 0.6 m long tube as an oven (residence time of 15 s). While this design passed the residence time test, it consistently failed to reproduce the enthalpies of sublimation. The measured entry and exit length of the first design were half of the total length of the heating section. We believe that the constant temperature section of the heater was not long enough to neglect the entrance and exit lengths of the short heaters.
Conclusion
In evaluating the performance of the custom-built TDMA system described here, the DMPS channel was consistent with a TSI SMPS system while in high flow but slightly high in low flow. Low flow was only 12% high by number and reproduced the proper shape. Caution should be used when comparing low flow results with other size distribution measurements. The overall consistency with the TSI SMPS occurred despite the pressure transducer being located immediately after DMA2. The expected impact of transducer movement is less than 0.5%, and transducer location (before DMA vs after DMA) may not be important in DMPS measurements. The VH-TDMA reproduced the hygroscopicity of six atmospherically relevant single component model aerosols in dew point control mode, and relative humidity measurements are quite accurate. Both the dew point control and relative humidity control provided similar error in growth factor. Dew point control appears to be a valid control method in laboratory environments where DMA2 is open to ambient temperature influence. This alternative is cheaper and less complex than temperature controlled H-TDMAs. The VH-TDMA reproduced the monotonic increase in the enthalpy of sublimation, with the exception of suberic acid, and the alternating saturation vapor pressure pattern of diacids. We found during qualification that an electrically heated, 0.6 m long tube was unable to provide a proper characteristic temperature (low enthalpies of sublimation) while a 15 m tube suspended inside an oven easily reproduced enthalpies of sublimation. From these measurements, we conclude the VH-TDMA is suitable for study of hygroscopicities, saturation vapor pressures, enthalpies of sublimation and vaporization, and size distributions of atomized pure component aerosols.
Supplemental Material
Download MS Word (544 KB)Acknowledgments
The authors would also like to thank the anonymous reviewers (particularly the in-depth review from Reviewer 2) for their insightful comments and suggestions which helped to improve and clarify this manuscript.
Additional information
Funding
Related Research Data
References
- Bilde, M., K. Barsanti, M. Booth, C. D. Cappa, N. M. Donahue, E. U. Emanuelsson, G. McFiggans, U. K. Krieger, C. Marcolli, D. Topping, et al. 2015. Saturation vapor pressures and transition enthalpies of low-volatility organic molecules of atmospheric relevance: from dicarboxylic acids to complex mixtures. Chem. Rev. 115:4115–4156. doi: 10.1021/cr5005502.
- Bilde, M., B. Svenningsson, J. Monster, and T. Rosenorn. 2003. Even-odd alternation of evaporation rates and vapor pressures of c3-c9 dicarboxylic acid aerosols. Environ. Sci. Technol. 37:1371–1378. doi: 10.1021/Es0201810.
- Boucher, O., D. Randall, P. Artaxo, C. Bretherton, G. Feingold, P. Forster, V.-M. Kerminen, Y. Kondo, H. Liao, U. Lohmann, et al. 2013. Clouds and aerosols. In Climate change 2013: the physical science basis. Contribution of working group i to the fifth assessment report of the intergovernmental panel on climate change, ed. Stocker, T. F., D. Qin, G.-K. Plattner, M. Tignor, S. K. Allen, J. Boschung, A. Nauels, Y. Xia, V. Bex, P. M. Midgley. Cambridge, UK: Cambridge University Press.
- Buck, A. L. 1981. New equations for computing vapor pressure and enhancement factor. J. Appl. Meteorol. 20:1527–1532. doi.
- Chan, M. N., S. M. Kreidenweis, and C. K. Chan. 2008. Measurements of the hygroscopic and deliquescence properties of organic compounds of different solubilities in water and their relationship with cloud condensation nuclei activities. Environ. Sci. Technol. 42:3602–3608. doi:10.1021/es7023252.
- Cox, J. D., and G. Pilcher. 1970. Thermochemistry of organic and organometallic compounds. London: Academic Press.
- da Silva, M. A. V. R., M. J. S. Monte, and J. R. Ribeiro. 1999. Vapour pressures and the enthalpies and entropies of sublimation of five dicarboxylic acids. J. Chem. Thermodyn. 31:1093–1107. doi.
- Davies, M., and G. H. Thomas. 1960. The lattice energies, infra-red spectra, and possible cyclization of some dicarboxylic acids. Trans. Faraday Soc. 56:185–192. doi:10.1039/Tf9605600185.
- De Nevers, N. 2012. Physical and chemical equilibrium for chemical engineers. Hoboken, NJ: Wiley.
- Duplissy, J., M. Gysel, S. Sjogren, N. Meyer, N. Good, L. Kammermann, V. Michaud, R. Weigel, S. M. dos Santos, and C. Gruening. 2009. Intercomparison study of six htdmas: Results and recommendations. Atmos. Meas. Tech. 2:363–378.
- Friedlander, S. K. 2000. Smoke, dust, and haze: Fundamentals of aerosol dynamics. New York: Oxford University Press.
- Goldstein, A. H., and I. E. Galbally. 2007. Known and unexplored organic constituents in the earth's atmosphere. Environ. Sci. Technol. 41:1514–1521. doi:10.1021/Es072476p.
- Hagen, D. E., and D. J. Alofs. 1983. Linear inversion method to obtain aerosol size distributions from measurements with a differential mobility analyzer. Aerosol. Sci. Technol. 2 :465–475. doi.
- Hermann, M., B. Wehner, O. Bischof, H. S. Han, T. Krinke, W. Liu, A. Zerrath, and A. Wiedensohler. 2007. Particle counting efficiencies of new TSI condensation particle counters. J. Aerosol Sci. 38 :674–682. doi: http://dx.doi.org/10.1016/j.jaerosci.2007.05.001.
- Hinds, W. C. 1999. Aerosol technology: Properties, behavior, and measurement of airborne particles. New York: Wiley.
- Hong, J., M. Aijala, S. A. K. Hame, L. Q. Hao, J. Duplissy, L. M. Heikkinen, W. Nie, J. Mikkila, M. Kulmala, N. L. Prisle, et al. 2017. Estimates of the organic aerosol volatility in a boreal Forest using two independent methods. Atmos. Chem. Phys. 17:4387–4399. doi:10.5194/acp-17-4387-2017.
- Knutson, E. O., and K. T. Whitby. 1975. Aerosol classification by electric mobility: Apparatus, theory, and applications. J. Aerosol. Sci. 6:443–451. doi: http://dx.doi.org/10.1016/0021-8502(75)90060-9.
- Li, W., N. Montassier, and P. K. Hopke. 1992. A system to measure the hygroscopicity of aerosol particles. Aerosol. Sci. Technol. 17 :25–35. doi: 10.1080/02786829208959557.
- Lightstone, J. M., T. B. Onasch, D. Imre, and S. Oatis. 2000. Deliquescence, efflorescence, and water activity in ammonium nitrate and mixed ammonium nitrate/succinic acid microparticles. J. Phys. Chem. A 104:9337–9346. doi: 10.1021/jp002137h.
- Liu, B. Y. H., D. Y. H. Pui, K. T. Whitby, D. B. Kittelson, Y. Kousaka, and R. L. McKenzie. 1978. The aerosol mobility chromatograph: A new detector for sulfuric acid aerosols. Atmos. Environ. 12:99–104.
- Massling, A., N. Niedermeier, T. Hennig, E. O. Fors, E. Swietlicki, M. Ehn, K. Hameri, P. Villani, P. Laj, N. Good, et al. 2011. Results and recommendations from an intercomparison of six hygroscopicity-TDMA systems. Atmos. Meas. Tech. 4:485–497. doi: 10.5194/amt-4-485-2011.
- McMurry, P. H., and M. R. Stolzenburg. 1989. On the sensitivity of particle-size to relative-humidity for Los-Angeles aerosols. Atmos. Environ. 23:497–507. doi: 10.1016/0004-6981(89)90593-3.
- McMurry, P. H., H. Takano, and G. R. Anderson. 1983. Study of the ammonia (gas)-sulfuric acid (aerosol) reaction rate. Environ. Sci. Technol. 17 :347–352. doi.
- Oja, V., and E. M. Suuberg. 1999. Vapor pressures and enthalpies of sublimation of d-glucose, d-xylose, cellobiose, and levoglucosan. J. Chem. Eng. Data 44:26–29. doi: Doi 10.1021/Je980119b.
- Petters, M. D., and S. M. Kreidenweis. 2007. A single parameter representation of hygroscopic growth and cloud condensation nucleus activity. Atmos. Chem. Phys. 7:1961–1971. doi.
- Pope, C. A. 2000. What do epidemiologic findings tell us about health effects of environmental aerosols?. J. Aerosol. Med. 13:335–354. doi: 10.1089/jam.2000.13.335.
- Rader, D. J., and P. H. McMurry. 1986. Application of the tandem differential mobility analyzer to studies of droplet growth or evaporation. J. Aerosol Sci. 17 :771–787. doi.
- Rader, D. J., P. H. McMurry, and S. Smith. 1987. Evaporation rates of monodisperse organic aerosols in the 0.02-mu-m-diameter to 0.2-mu-m-diameter range. Aerosol. Sci. Tech. 6(3):247–260. doi: 10.1080/02786828708959137.
- Rickards, A. M. J., R. E. H. Miles, J. F. Davies, F. H. Marshall, and J. P. Reid. 2013. Measurements of the sensitivity of aerosol hygroscopicity and the κ parameter to the o/c ratio. J. Phys. Chem. A 117(51):14120–14131. doi:10.1021/jp407991n.
- Sandler, S. I., and S. I. Sandler. 2006. Chemical, biochemical, and engineering thermodynamics. Hoboken, NJ: Wiley.
- Stephenson, R. M., S. Malanowski, and D. Ambrose. 1987. Handbook of the thermodynamics of organic compounds. New York: Elsevier.
- Tang, I. N., and H. R. Munkelwitz. 1994. Water activities, densities, and refractive-indexes of aqueous sulfates and sodium-nitrate droplets of atmospheric importance. J. Geophys. Res. 99(D9):18801–18808. doi: 10.1029/94jd01345.
- Taulelle, P., G. Sitja, G. Pépe, E. Garcia, C. Hoff, and S. Veesler. 2009. Measuring enthalpy of sublimation for active pharmaceutical ingredients: Validate crystal energy and predict crystal habit. Cryst. Growth Des. 9(11):4706–4709. doi: 10.1021/cg900567z.
- Villani, P., D. Picard, N. Marchand, and P. Laj. 2007. Design and validation of a 6-volatility tandem differential mobility analyzer (vtdma). Aerosol. Sci. Tech. 41(10):898–906. doi:10.1080/02786820701534593.
- Wehner, B., S. Philippin, and A. Wiedensohler. 2002. Design and calibration of a thermodenuder with an improved heating unit to measure the size-dependent volatile fraction of aerosol particles. J. Aerosol Sci. 33(7):1087–1093. doi: Pii S0021-8502(02)00056-3 Doi 10.1016/S0021-8502(02)00056-3.
- Wiedensohler, A., W. Birmili, A. Nowak, A. Sonntag, K. Weinhold, M. Merkel, B. Wehner, T. Tuch, S. Pfeifer, M. Fiebig, et al. 2012. Mobility particle size spectrometers: Harmonization of technical standards and data structure to facilitate high quality long-term observations of atmospheric particle number size distributions. Atmos. Meas. Tech. 5(3):657–685.
- Zhang, S.-H., J. H. Seifeld, and R. C. Flagan. 1993. Determination of particle vapor-pressures using the tandem differential mobility analyzer. Aerosol. Sci. Tech. 19(1):3–14. doi: 10.1080/02786829308959616.