
Abstract
Combustion produced soot is highly variable in its composition and nanostructure, both of which are dependent upon combustion conditions. Quantification of high-resolution transmission electron microscopy (HRTEM) images for nanostructure parameters shows that soot nanostructure is dependent upon its source. In principle, this permits identification of the soot and its contribution to any pollution monitoring receptor site. Many structural and chemical aspects are subtle, unaccounted for in direct nanostructure quantification. The process of pulsed laser annealing is demonstrated to enhance slight differences in nanostructure and chemical composition. Chemistry-based limitations imposed due to nanosecond heating and microsecond cooling timescales highlight these initial compositional and structural differences—as dependent upon source-specific formation conditions. This study demonstrates laser-based heating as an analytical tool for soot differentiation by formation conditions/source by identifying operational parameters for optimal derivatization. Nanostructure changes are qualitatively shown using HRTEM and quantified using image-based fringe analysis for real and model soots.
Copyright © 2019 American Association for Aerosol Research
1. Introduction
As of 2016, 91% of the world population suffers from exposure to air quality worse than that specified by the World Health Organization (WHO) guidelines (Mooney Citation2016; WHO Citation2018). This is exacerbated in developing countries with high population densities like India and China, resulting in ∼0.5 million deaths annually in India alone and ∼3 million deaths worldwide (Harvey Citation2016; PR Newswire Citation2016). Vehicular traffic and consequent engine exhaust and industrial emissions have recently been identified among the top contributors to outdoor pollution, especially in developing countries, resulting in ∼4.6 million casualties worldwide (WHO Citation2018). Diesel soot is considered a significant component of traffic emissions. According to a study on diesel particulate matter by the Environmental Protection Agency (EPA), soot from diesel sources is responsible for 1.5 million lost work days in the US per year owing to >8000 premature deaths, 23,000 bronchitis cases, numerous (>300,000) asthma attacks (US EPA Citation2002). Following this study, subsequent epidemiology studies on diesel particulate matter by the Health Effects Institute (HEI) has since re-classified diesel exhaust as a carcinogen to humans (Group 1) from its prior classification of being a possible carcinogen (Group 2A) (HEI Citation2015). Governments of India and China, currently the two largest global economies that are severely impacted by the air pollution crisis, have recently announced massive expenditures of the order of a few billion dollars to tackle the problem, collectively impacting about half the world’s population (Mint Citation2018; The Times of India Citation2018; Xinhua News Agency Citation2018).
Apart from its impact on human health, global impacts of particulate matter are also being assessed. For instance, soot is hydrophobic but chemical and physical changes occurring at its surface can create functional groups that attract and retain water, causing it to become hydrophilic (Picaud et al. Citation2004). These changes can have a significant impact on the radiative balance in the atmosphere based on whether soot acts as cloud condensation nuclei and how susceptible it is to wash out and/or participation in heterogeneous atmospheric reactions (Ramanathan et al. Citation2001). Prior works have also shown that soot may have a contribution to the changes happening near the North Pole, e.g., accelerated melting of ice and snow and the resulting change in the temperature of the atmosphere (Hansen and Nazarenko Citation2004; Shrestha, Traina, and Swanston Citation2010). Early estimates have placed the radiative forcing of black carbon at ∼0.5–0.8 W/m2, approx. half of that of CO2 (Hansen and Nazarenko Citation2004). More recently, a rigorous estimate of 0.61 W/m2 was mathematically derived, optimized against observations (Wang et al. Citation2016).
Soot measurement and identification play a key role in assessing its environmental and social impact. The source-model approach is one such identification method. This method identifies the pollution sources and their emission strengths. These are converted to categorical emission factors by using meteorological patterns that predict pollution advection and composition over time and space (Guttikunda Citation2009). Such models have great potential with an inventory of known combustion sources but are limited because (a) emissions inventories are typically incomplete and (b) meteorological dispersion is subject to high variability. On the other hand, the receptor-model approach samples air in a given area and infers likely pollution sources by similar chemical and/or physical characteristics between the source and pollution samples (Guttikunda Citation2009). With relatively few atmospheric measurements and analysis, receptor-model based methods can potentially quantify comparative contributions of diverse sources to ambient air pollution, where little may be currently known.
For this purpose, varied molecular and elemental tracers have been applied for source apportionment. Hopanes and steranes, originating in lube oil have been used as tracers for diesel soot (Hays et al. Citation2013). PAHs can be produced by combustion of many different fuels and, therefore, are less specific tracers for petroleum. PAHs can also originate from natural processes such as biomass burning, volcanic eruptions and diagenesis (Yan et al. Citation2005; Wang et al. Citation2009, Citation2010; Yang et al. Citation2010). However, especially in heavily urbanized or industrialized regions, the majority of these compounds are anthropogenic: coal and wood burning, petrol and diesel oil combustion, and industrial processes. In general, the distribution of common PAHs, unusual PAHs and particulates depend upon the combustion process, but is not unique to any particular source (Mastral and Callén Citation2000).
In years past, lead (Pb) was the primary marker of gasoline vehicle emissions (Moffet et al. Citation2008). Similarly, nickel and vanadium are yet common to the combustion of residual fuel oil (Kulkarni, Chellam, and Fraser Citation2007), originating from the catalysts used in the refining process. Other light elements such as Si, Al, Ca and Fe are typical indicators of crustal dust, but Ca is also a key component of additives in lube oil as are Zn and P. Yet, these elements are present in engine or combustor produced soot only if oil is burned to release these elements for soot aerosol capture. Alternatively, Fe can arise as a byproduct of engine wear, a rather generic source. Meanwhile, there are no proven tracers for jet aircraft particulate emissions. Clearly additional identifiers are needed.
Receptor models are used to develop a sound regulatory policy for regions potentially impacted by air pollution (Gordon Citation1980). The receptor modeling approach allows for direct pollution measurements at emissions hot spots and can help in statistically determining the contribution of a variety of pollution sources at specific air monitoring sites. However, the points of measurement may be few due to the cost of monitoring and chemical analysis. The present study contributes to source apportionment studies using a receptor-model based approach and also likely serves as a check for the combustion source-model approach. Both methods are used to understand air pollution at various levels, urban, regional, and global (Guttikunda and Kopakka Citation2014), given the common goal of identifying the potential influence of numerous sources to ambient pollution levels. Though the methodology focuses primarily on particulate matter pollution, soot may serve as a tracer for other air pollutants and atmospheric mixtures.
Combustion soot varies in its morphology and chemistry. It is now understood that different physical and chemical processes contribute to soot nucleation with a variety of species contributing to soot growth. Fuel molecular structure and composition, timescales and temperature all affect its chemistry and nanostructure (Frenklach Citation2002; McEnally et al. Citation2006). Soot is a complex aerosol formed under non-equilibrium conditions, very dependent on the specifics of the combustion process (Frenklach Citation2002). There is a commonality of radical reactions that drive soot formation, but the species variability, associated rates and their relative concentrations can form soot with source-dependent nanostructure. For example, power generation and engine combustion soot differ in its composition and nanostructure (Hays and Vander Wal Citation2007; Vander Wal, Bryg, and Hays Citation2011). Nanostructure differences are well known with well-developed quantification tools for analyzing high-resolution transmission electron microscopic (HRTEM) images (Vander Wal et al. Citation2004; Yehliu, Vander Wal, and Boehman Citation2011). These algorithms have been vetted by comparison to traditional single parameter analytical characterization methods such as Raman for the in-plane lattice dimension, La (Vander Wal et al. Citation2004) and X-ray diffraction (XRD) for lamellae spacing (Vander Wal et al. Citation2004).
In this context, it is shown that the nanostructure of soot depends upon its formation conditions for laboratory studies (Vander Wal and Tomasek Citation2004) and applied systems (Vander Wal and Mueller Citation2006). Soot nanostructure is defined as the degree of order found in the individual graphene segments and their relation to one another. Different physical measures can describe nanostructure: (a) lamellae length defined as the end-to-end distance of lamellae, (b) lamellae curvature is the arc length divided by the straight-line distance between lamellae endpoints, and (c) lamellae spacing is the average gap separation between parallel lamellae. Each metric is typically represented by a distribution enabling statistical analyses and comparisons (Vander Wal and Tomasek Citation2003; Yehliu, Vander Wal, and Boehman Citation2011). Albeit without explicit statement, a variety of methods have been used to characterize carbon nanostructures such as Raman spectroscopy (Sadezky et al. Citation2005; Atribak, Bueno-López, and García-García Citation2010), XRD (Franklin Citation1950; Iwashita et al. Citation2004), and HRTEM. In contrast to Raman spectroscopy and XRD, HRTEM reveals all three metrics of carbon nanostructure (Hess et al. Citation1968; McEnaney Citation1974; Palotás et al. Citation1996; Sharma, Kyotani, and Tomita Citation1999).
Despite fringe analysis tools and other techniques, quantification and differentiation of nanostructure can be difficult for some combustion sources and conditions (e.g., if a significant portion of growth occurs <1100 °C). Additionally, it would be advantageous to bring out subtle chemical variances in soot, such as heteroatom content and cross-links, which are not formally observed in lamellae nanostructure. The implications are significant in that soot nanostructure can be quantified as a function of its source (Huang and Vander Wal Citation2013). This quantification would permit definitive resolution of the soot source and its contribution to any particular receptor site. Our initial results using HRTEM have validated this approach for the selected soots (Vander Wal and Tomasek Citation2003, Citation2004; Vander Wal and Mueller Citation2006; Hays and Vander Wal Citation2007; Vander Wal et al. Citation2013; Vander Wal, Bryg, and Huang Citation2014).
A solution may be found in the related field of analytical chemistry, wherein it is often necessary to derivatize analytes to make detection possible (Rosenfeld Citation2003). Derivatization is the process of chemically changing a compound and producing a new compound with properties agreeable with a specific analytical method. Unconsidered to-date is the process of derivatization by pulsed laser annealing as applied to combustion produced soots. Traditional thermal annealing over long heat treatment times has been used since the early 1800s to study the structural transformation of carbon when subject to high-temperature heat treatment (Abrahamson et al. Citation2017). However, given the long heating time-scales, this has been used to analyze structural transformations thermodynamically, rather than kinetically. Laser derivatization is used here in a similar manner to bring out minor dissimilarities in nanostructure and seemingly subtle differences in chemistry upon laser heating. Contributing to these changes are small changes in initial nanostructure and composition that become magnified by the fast heating and rapid quenching. This has been recently demonstrated on synthetic soot using oxygen and sulfur as heteroatoms and their subsequent diverging nanostructure upon pulsed laser annealing (Abrahamson and Vander Wal Citation2018) to potentially differentiate soot generated by fuels with varying sulfur content, for instance (Anderson et al. Citation2011; Huang and Vander Wal Citation2013).
This work aims to exploit the non-equilibrium formation chemistry of combustion produced soot and enhance differences in physical morphology and chemical composition that are often masked by bulk analyses but can be emphasized by laser-based derivatization. Thus, the proposed technique is referred to as, Soot Source Identification by Laser Derivatization (SSILD).
2. Materials and experimental methodology
2.1. Materials
Four different commercial carbon blacks were selected as model materials to be laser heated and examined by HRTEM. The carbon blacks are Monarch 1300 (Cabot Corp., Boston, MA), Regal 250 (Cabot Corp.), Lamp black (Orion Engineered Carbons, Germany) and arc soot (MER Corp., Tucson, AZ). Arc soot is an amorphous carbon produced by arc discharge, with its structure like that of sputtered carbon. In contrast to the other carbon blacks, it does not consist of primary particles assembled into aggregates but is an amorphous material throughout. In addition to these, ethylene (C2H4) soot was generated in a co-flow diffusion burner using pure fuel. Lamp black and flame generated ethylene soot were laser heated at different laser fluences to identify the optimal laser operational parameters for derivatization. Commercial carbon blacks used as model soot are nearly pure carbon with a C:H ratio >10:1 and negligible hetero-element content. These are well-studied and characterized materials, available commercially and in bulk form (Jaramillo et al. Citation2015; Gaddam et al. Citation2016). As model soots with known and controlled chemistry, i.e., C:H ratio and hetero-element content, the carbon blacks help provide insight into the laser heat-treatment process and its effect on particle nanostructure given its known composition (Gaddam Citation2015; Abrahamson and Vander Wal Citation2018).
Additionally, the following four combustion-generated soots were laser heated towards the development of the database, given their span across sources and combustion conditions to better illustrate the laser-based derivatization technique. These soots offer a broad range of initial nanostructures and varied primary particle size that serve as an example set for the variation encountered with real-world soot.
2.1.1. Diesel engine exhaust soot
PM samples were generated in a 1999 1.7 L Mercedes Benz direct-injection common rail diesel engine. The engine specifications and detailed description of the system are given by Strzelec et al. (Citation2010). The engine was operated at a single steady-state point, 1500 rpm, 2.6 bar brake mean effective pressure with 30% exhaust gas recirculation (EGR) for 12 h. This low load point was chosen because it is the heaviest weighted point of the multimode steady-state approximation of the US FTP-75 drive cycle. The fuel used was the conventional 2007 certified ultra-low sulfur diesel (ULSD) fuel. For this fuel, the engine performance parameters (speed, load, %EGR) were specified, and fueling rate, rail pressure, and SOI were allowed to float to meet the demand. An uncatalyzed diesel particulate filter (DPF) without a diesel oxidation catalyst was installed ∼1 m downstream of the turbine exit to collect particulate powder.
2.1.2. Gasoline engine exhaust soot
A single-cylinder, four-stroke SIDI research engine that is based on a Ricardo Hydra block with an aluminum cylinder head (Farron et al. Citation2011) is used to generate soot. The spark plug is centered about the four valve ports, the pressure transducer is located on the side between the intake and exhaust valve ports, and the fuel injector is mounted at 45° to the horizontal axis between the two intake ports and has a 70° total (35° from center line) spray cone angle, with an injection pressure of 11 MPa. Soot was collected directly on TEM grids (Lacey C/Cu) at a lean condition (Φ–0.86) for the standard gasoline (EPA Tier II EEE) fuel.
2.1.3. Outdoor wood boiler (OWB) soot
An Econoburn/EBW-200 boiler, manufactured by alternative fuel boilers (AFB), is used to collect soot. A detailed description of the OWB technologies and the testing facilities and procedures is provided elsewhere (Hays et al. Citation2011). The OWBs were operated using a 24 h diurnal heat demand profile for a typical 232 m2 home in Syracuse, New York in January The heat demand was simulated using a digitally controlled water-water heat exchanger system. The boiler unit was tested using red oak wood (Quercus rubra). The emissions from the boiler were captured using a shrouded, annular hood duct positioned directly above the boiler stack. Emissions were diluted (∼10:1) and directed to sampling arrays using a 25.4 cm diameter stainless steel pipe. A port positioned downstream of the annular duct collected PM at ∼25 °C (21 L min) using a 47-mm quartz fiber filter with a sample grab time of ∼15 s.
2.1.4. PM from gulf oil spill
A 4.0-m diameter, helium-filled aerostat (Kingfisher model, Aerial Products Inc., Jacksonville, FL, USA) was used to loft an instrument package (the “Flyer”) into oil fire plumes (BP Deepwater Horizon disaster) for PM sample collection. The aerostat/Flyer was launched from the deck of the MV Allison (Aries Corporation), a 67-m long oil platform workboat. The aerostat was secured to an electric winch by a 609-m long, 2.5-mm diameter spectra tether. This PM sample collected on filters was extracted with toluene in a Soxhlet apparatus (Aurell and Gullett Citation2010).
2.2. Pulsed laser annealing
Carbon blacks and soots were deposited on TEM grids and laser-heated in an inert atmosphere. Ultra-high purity argon (99.999%, Praxair®) served as the inert gas. An 8 ns pulsed Nd:YAG laser (Continuum® SureliteTM III) operating at 1064 nm was used as the excitation source. A laser beam of 9 mm in diameter was used with a ground glass diffuser to promote uniform irradiation. The exposed region of the sample is 3 mm in diameter.
Multi-wavelength pyrometry was applied for temperature determination. The laser-induced incandescence signal observed when soot is irradiated is detected by a quartz optical fiber as shown in Supplementary Information Figure S1. The other end of the fiber terminates in a rectangular geometry to match the entrance slit for the spectrograph. A gated-intensified cooled CCD (Princeton Instruments® ICCD-576-S) was used to capture spectra at selected times relative to the excitation laser pulse. A digital delay generator is used to synchronize the camera intensifier pulser to the laser. With prior calibration using a NIST traceable tungsten filament lamp, the instrument optical response function was determined to enable deconvolution for the true sample spectral emission. Absolute temperature (T) was then determined by fitting this spectral profile to the Planck’s equation (Abrahamson et al. Citation2017).
A 9-stage photomultiplier tube attached to a second ¼-meter spectrograph detected the temporal emission of the material incandescence at selected wavelengths, with spectral bandwidths ranging between 5 and 10 nm, as determined by the exit slit. A 500 MHz Tektronix® digitizing oscilloscope digitally captured the temporal evolution data. A commercial software was used to process spectral and temporal data.
2.3. Laser fluence selection
Laser fluence is proportional to temperature, and higher laser fluence (thereby, higher temperature) should create more ordered nanostructure based on traditional heat-treatment-temperature studies (McEnaney Citation1974). The ideal laser fluence should accentuate recognizable structural differences, without damaging the underlying lacey carbon on the TEM grid. For this purpose, pulsed laser heating was performed at three different laser fluences for C2H4 soot and lamp black—75, 150, and 250 mJ/cm2.
2.4. HRTEM characterization
HRTEM images were taken using a 200 keV field emission TEM (JEOL® EM-2010F) instrument. A magnification of 500,000× was used to analyze nanostructure. The samples were laser heated directly on the TEM grid which negated the need to re-disperse the sample. Aggregates from ∼20 sections were systematically selected and visually surveyed to establish the consistency of the observations and ensure accurate representations. Size of >60 images were acquired at a series of magnifications for each of the samples studied. Image analysis of the nascent carbons was performed using in-house algorithms to quantify the nanostructure observed by HRTEM (Yehliu, Vander Wal, and Boehman Citation2011).
2.5. Electron energy loss spectroscopy characterization
Based on the energy lost by an incident beam of electrons when interacting with the specimen, one can analyze its response to laser annealing based on the proportion of its sp2 to sp3 hybridized carbon (Brydson Citation2001). Electron energy loss spectroscopy (EELS) has been used to illustrate particle-to-particle variation (or lack thereof) within a selected carbon black sample. EELS in scanning TEM (STEM) mode, with a spot size of ∼1 nm helps determine bonding chemistry for several particles within an aggregate. Electron energy loss can be measured due to the energy loss from incident electrons in the promotion of core-shell electrons to the unoccupied antibonding σ* or π* states. For carbon this occurs in the ∼284–305 eV range, comprised of the 1 s to π* transition at ∼285 eV and 1 s to σ* transition at ∼292 eV (Cuomo et al. Citation1991; Alexandrou et al. Citation1999; Daniels et al. Citation2007). The 1 s to π* is typically quantified by the integrated intensity under the electron energy loss curve in the ∼284–289 eV and 1 s to σ* in the ∼290–305 eV range (Cuomo et al. Citation1991). The relative intensity of the two transitions provides relative measure of the density of states and therefore quantification of its sp2 and sp3 content.
3. Results and discussion
3.1. C2H4 soot
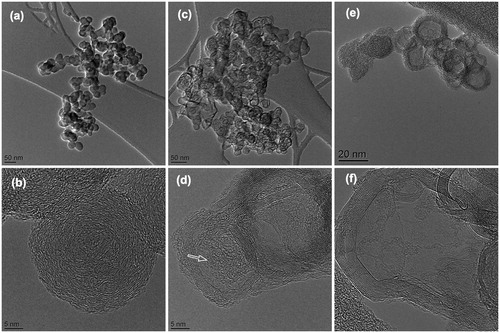
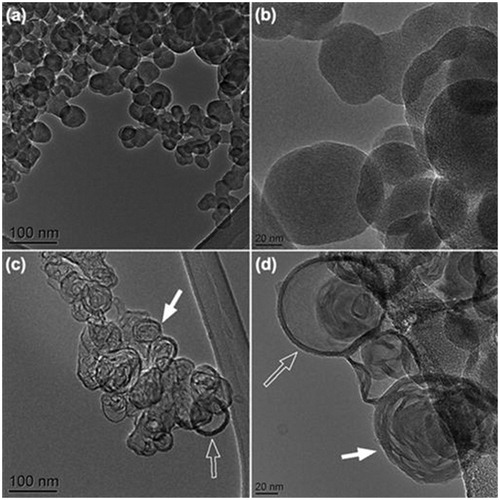
As shown in , the nascent C2H4 soot shows a chain-like morphology. The initial nanostructure of C2H4 soot showed recognizable lamella, but the central core lacked any structure typical of flame-generated soot. Based on the parent fuel, the core of the particles may contain lower C/H species. At the lowest laser fluence of 75 mJ/cm2, shown in , the material transformation is minimal. Higher magnification images show an amorphous layer along the outer edges of the primary particles, while the particle core still consists of disordered carbon as indicated by the arrow. At 150 mJ/cm2, primary particles appear to possess greater transparency with a graphitic perimeter as shown in . While many particles are converted into hollow capsules, other nested fullerene-like structures and very small carbon fragments as debris are also observed. At the high laser fluence of 250 mJ/cm2, the lacey carbon film on the TEM grid completely disintegrates suggesting excess energy.
Figure 1. TEM images of ethylene soot (a–b) before laser heating and after laser heating at a fluence (c–d) 75 mJ/cm2, (e–f) 150 mJ/cm2.
3.2. Lamp black
With an average primary particle size of ∼112 nm, lamp black particles are nearly four times larger than ethylene soot. As shown in , lamp black consists of primary particles and aggregate morphology that is mostly open with branched structures. The nascent nanostructure of lamp black consists of uniform, similarly oriented lamellae. The progressive degree of laser-induced transformation is observed in . Especially at the lowest laser fluence of 75 mJ/cm2, only the particles on the edges (marked by arrows) appear to have undergone a structural transformation, while at 150 mJ/cm2, the lower magnification image highlights uniform material transformation across the aggregate. Also, despite changes in the particle nanostructure, the branched-chain morphology remained intact after laser irradiation as revealed by the low magnification image in . This relates to the formation history of soot and the generally accepted growth mechanism resulting in particles with sp3 hybridized carbon and/or PAHs at the core of the particle surrounded by a relatively more ordered shell (Vander Wal and Choi Citation1999). When subject to high-temperature heat treatment under kinetic limitations, the entire particle chemically changes towards greater sp2 hybridization. Due to the existing favorable crystallite orientation along the particle shell posing a relatively lower energy barrier, it graphitizes and locks into place first (Vander Wal and Choi Citation1999), thereby maintaining aggregate morphology. Amorphous carbon lamellae with a greater number of edge sites relative to basal plane present at the core of the particle are unable to align with the exterior, vaporize and escape the particle leaving behind a hollow interior (Abrahamson et al. Citation2017). A high magnification image () shows extended lamellae along bordering the particle. The substructures within the particles give rise to the rosette appearance of primary particles when viewed at lower magnifications. Banded nanostructure resulting in compartments and small internal voids (marked by arrows) due to realignment are also observed.
Figure 2. TEM images of lamp black (a–b) before laser heating and after laser heating at a fluence (c–d) 75 mJ/cm2, (e–f) 150 mJ/cm2.
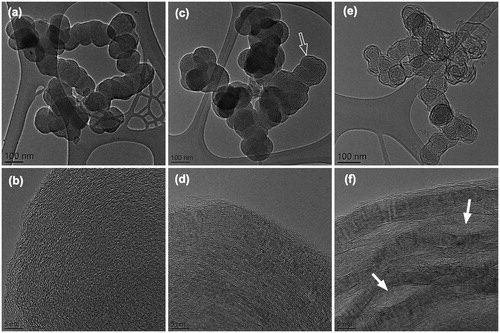
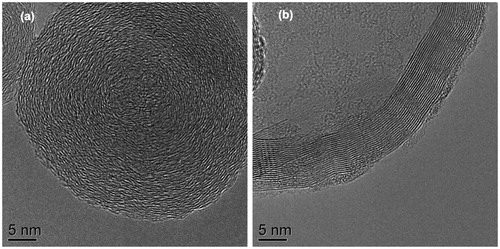
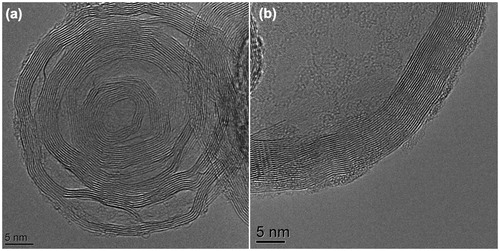
Figure 3. HRTEM images of R250 carbon black (a) before laser heating and (b) after laser heating at a fluence of 150 mJ/cm2.
Thus, increasing laser fluence increases material reorganization. This association between laser fluence and degree of annealing points to a combination of (1) peak temperature to which the soot is heated scales with laser fluence and is controlled by energy absorbed and (2) its time at elevated temperature (Abrahamson et al. Citation2017). A related study on the effect of temperature (laser fluence) and time (pulse number) on carbon black as surrogate soot details this aspect of laser annealing (Abrahamson et al. Citation2017). The spectrally resolved emission profile reported a temperature of 3600 °C ± 30 °C at 150 mJ/cm2. This value is below the vaporization temperature of carbon (∼3700 °C), and above the graphitization threshold (∼2200 °C). Based on previous studies and the images above, the pulsed laser heating studies henceforth are performed at a laser fluence of 150 mJ/cm2.
3.3. Nanostructure evolution—Dependence on initial nanostructure carbon blacks as model soot
Several carbon blacks have model nanostructures that are highly uniform. In this context, uniformity means that one nanostructure parameter well describes the lamellae and that there is little to no spatial variation radially across the particle, a much more common situation in flame formed or combustion-produced soots, e.g., engine soots. Thus, to further investigate the role of initial nanostructure upon the direction of nanostructure evolution under the action of pulsed laser heating, R250, arc soot, and M1300 are laser heated using a fluence of 150 mJ/cm2. These specific carbons were chosen for their diverse nanostructure and uniform composition.
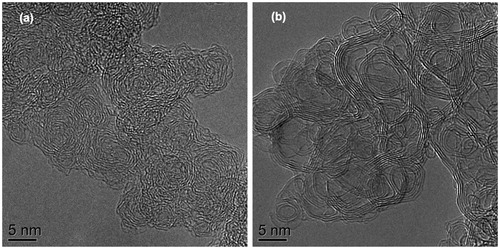
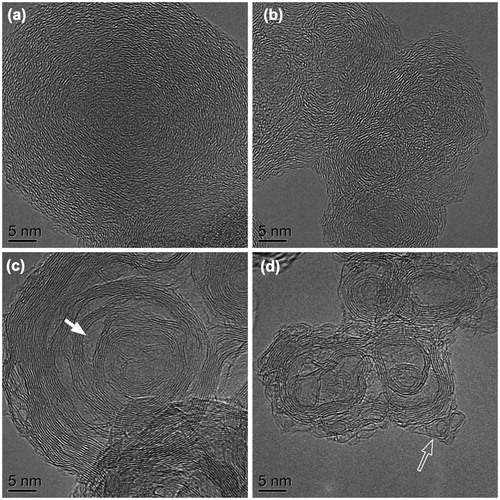
3.3.1. R250
Nascent R250 possesses a periodic crystalline structure with disconnected and short planar crystallites consisting of numerous polyaromatic hydrocarbon (PAH) layers concentrically oriented, as shown in . Interior lamellae are shorter and exhibit spatially disorganized carbon. Upon laser heating at 150 mJ/cm2, a variety of structures are observed—hollow shells and particles with multi-faceted internal structure. Graphitic layer planes are noticeable along the outer periphery and interior of the laser annealed R250 particles. Primary particles consist of graphitic layer planes along the outer periphery with the interior appearing less opaque seen by the contrast in . These graphitic layer planes that appear as dark bands have prolonged lengths of a few tens of nanometers.
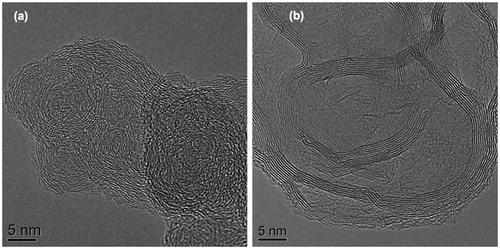
3.3.2. Arc soot
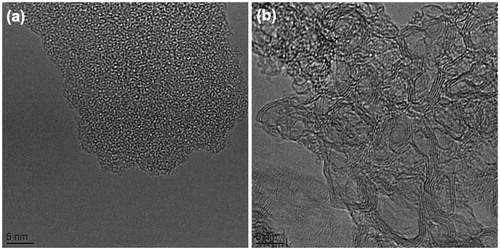
shows a TEM micrograph of nascent arc soot with an amorphous nanostructure. No appreciable crystalline stacking is evident, given the absence of recognizable lamellae. The representative HRTEM image of laser-heated arc soot is shown in . This image shows a reorganization of material within the particle, thereby leaving voids throughout the interior of the particles. Ribbon-like graphitic layer stacks and voids are observed along the outer periphery of the laser-heated arc soot particles but with random assembly therein. The lower degree of graphitization is reflective of the initial nanostructure, which does not contain any primary particle structure or interior crystallites that could have potentially served to guide the evolution of the graphitic ribbons.
Figure 4. Representative HRTEM images of (a) nascent and (b) laser heated (150 mJ/cm2), arc soot.
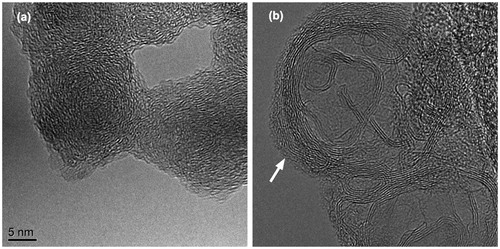
3.3.3. M1300
M1300 presents a different organization of lamellae at the nanoscale, as shown in . Nascent M1300 carbon exhibits partial and complete closed shells. The shells are distorted, (not spherical) with a an interior void. Compared to the laser-heated arc soot, the lamellae stacks appear to be more uniform over a relatively longer length. Many curved segments, some of which are concentric, are also observed. Angle tilting reveals that the curvature is three-dimensional. Such curvature arises from odd-membered rings, in particular, five-membered ring structures within the aromatic framework (Abrahamson et al. Citation2018b). Laser annealing of M1300 carbon appears to have annealed the material uniformly with an increase in lamellae ordering as shown in . Structures representing regions encapsulated by graphitic planes exist within and on the edge of the particles. Laser heating accentuates the original nanostructure while the curvature of the nascent material appears to have directed nanostructure evolution. This intertwined ribbon structure is akin to that observed in non-graphitizable soots (Wornat et al. Citation1995; Hurt Citation1998).
Figure 5. Representative HRTEM images of (a) nascent and (b) laser heated (150 mJ/cm2), M1300.
These carbon blacks and arc soot exhibit very different lamellae length and curvature at the nanoscale. The material’s nascent structure at the nanoscale led to differences in nanostructure upon pulsed laser annealing. Nascent R250 showed spatial variation radially across the particles. The outer periphery of the particles consisted of larger, oriented crystallites, while the central region seems largely unstructured. Laser annealed R250 transformed into hollow nanoparticles banded by graphitic layer planes. The C:H ratio of the particle interior may be lower than that at its perimeter, given the soot formation mechanism and the fact that the particle nucleus was created by physical condensation of high molecular weight PAHs. Thus, the particle interior may bear a resemblance to the molecular species that created it. Thus, under the action of the laser, devolatilization of large mass compounds present in the particle interior would occur, followed by reorganization and simultaneous densification of the carbon, accounting for the formation of the void. Arc soot, on the other hand, transformed into long entangled and interlocked lamellae encircling voids. At these high temperatures, lamellae become mobile aided by broken cross-links, and the resultant radical sites lead to lamellae growth. In contrast to other carbon blacks, the laser-heated structure does not form particle shells comprised of multiple parallel stacks of graphitic layers. This qualitative image comparison confirms that the laser-heated arc soot has distinct and identifiable lamellae, albeit randomly organized. In contrast, M1300 consists of long but highly curved lamellae indicative of odd-membered carbon rings. Laser annealed M1300 shows extended lamellae with highly curved shells largely preserved after annealing, consistent with a non-graphitizing carbon where the nascent nanostructure is “locked-in” by geometrically constrained lamellae and restricted mobility to allow significant flattening, stacking and reorientation. The presence of curvature in the laser annealed M1300 carbon illustrates the tendency of the original nanostructure guiding the annealing process.
3.4. Combustion-generated soots
3.4.1. Diesel engine exhaust soot
Diesel soot can also exhibit a variety of nanostructure. This diesel soot exhibits a core-shell structure () where the outer shell has crystallites oriented parallel to one another and the particle center (core) is composed of distorted carbon fragments. It is important to note that this diesel (ULSD) soot nanostructure does not contain fullerene-like curvature. shows HRTEM image of laser-heated diesel soot. Graphitic layer planes are observed along the soot primary particle perimeter. Large internal voids with distinct internal organization are also present. Some large particles appear to consist of banded graphitic layer planes which give rise to the compartmental appearance of primary particles.
Figure 6. HRTEM images of diesel soot (a) before laser heating and (b) after laser heating at a fluence of 150 mJ/cm2.
3.4.2. Gasoline engine exhaust soot
Nascent gasoline soot lacked any recognizable nanostructure as shown in . This contrasts with the core-shell structure that is common to diesel soot. Here, the lamellae are neither ordered nor highly stacked. Upon laser heating, ordered rosette-like structures were not observed. Instead, the particles had extended lamella with no relative order to the adjacent fragments as shown in . A few nanometers thick amorphous carbon layer is observed on the outer perimeter of the particles as indicated by the arrow. Hollow shells suggest that the organics may have been the first to be consumed in laser heating process. The stark difference of internal structure of soot before and after laser irradiation demonstrates the annealing action and its dependence upon the initial structure. Our previous research indicated that the gasoline particulates contain matrix-bound organics whereas diesel soot has organics mostly located at the particle surface (Gaddam and Vander Wal Citation2013). Upon action of a pulsed laser, these differences in chemistry across two sources (diesel vs. gasoline engine) are magnified.
Figure 7. HRTEM images of gasoline soot (a) before laser heating and (b) after laser heating at a fluence of 150 mJ/cm2.
3.4.3. Outdoor wood boiler (OWB) soot
The nascent boiler soot as shown in contains no discernable crystalline structure, given lamellae spatial sparseness this structure is often referred to as being amorphous and is typical of biomass combustion particulate (Vander Wal and Tomasek Citation2004). The soot nanostructure has few fringes >1 nm in length and is disordered. This smaller residential-scale efficient boiler (158 MJ/h) firing dry red oak logs showed comparatively low emissions of semi-volatile organic compounds, 0.2 g/kg of dry fuel burned.
Figure 8. HRTEM images of soot generated from a classic wood boiler (a) before laser heating and (b) after laser heating at a fluence of 150 mJ/cm2.
Laser heating led to fully formed hollow shells with highly ordered carbon lamellae as shown in . As dependent upon the radical site density and lamellae orientations, relative mobility, the phenomena of vegetative lamellae growth, can occur. Given the amorphous nature of the boiler soot, the structure is dominated by edge-site carbons, which are easier to reorient given the lower activation energy threshold. As the graphitic bands form, further carbon restructuring occurs by templating off of these bands. The internal carbon is consumed and voids are left behind in this process. This restructuring of carbon particularly along the graphitic bands at the particle perimeter accounts for the somewhat spherical, lengthened vacancies.
3.4.4. Gulf oil spill soot
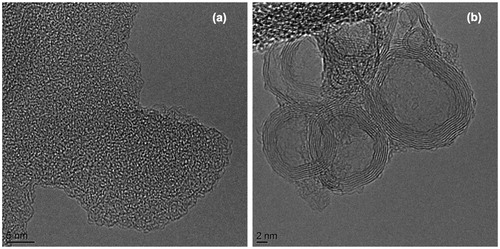
Soot collected from the oil fire plumes during the Gulf oil spill exhibited a wide range of nanostructures with the two most common structures shown in . shows a particle that possesses radial variation in its nanostructure. The inner core lacks structure, but the outer shell shows well-ordered short carbon lamella. This is typical of the nanostructure of large particles. It indicates the onset of soot nucleation at early stages, with limited fuel/air mixing followed by C2 or C6 (from fuel pyrolysis) addition as described by the HACA mechanism (Wang and Frenklach Citation1997). These soot particles exhibit a core-shell nanostructure with a disorganized center and graphitic perimeter where the lamellae are seemingly parallel or similarly curved. It is the observed heterogeneity as an indication of the different combustion processes, fuel and fuel-air ratio contributing to soot formation here.
Figure 9. Survey HRTEM images of soot collected from the Gulf oil spill study. (a and b) nascent particles and (c and d) after laser heating at a fluence of 150 mJ/cm2.
Small structural and composition differences may be highlighted by pulsed laser heating, distinctively and uniquely identifying the source of the soot. illustrates the impact of initial nanostructure upon pulsed laser heating. The variety of initial nanostructures proceed along different trajectories. shows that the large particles have significantly graphitized due to laser action. Rosette structures with extended lamella are evident. On the other hand, fullerene-like structures (small particles) form small hollow shells with ordered lamellae along the particle perimeter (). Numerous primary particles exhibit a compartmentalized nanostructure with banded/ribbon-like lamellae defining its internal structure. Some bands are nested concentric shells while others are arbitrary in their position and shape. Regions enclosed by graphitic planes also exist.
The results with diesel and gasoline are indeed varied, but in general lead to internal graphitic ribbons and compartments while the biomass derived soot transforms into thick-walled shells. These initial results suggest that the fuel (petroleum versus biomass) may be a larger determinant of the final nanostructure upon laser annealing than the particular source. Variability in soot from the same source is observed for soot samples from the Gulf oil spill. Different structures were observed as presented and such variability is attributed to the uncontrolled burning and highly variable combustion conditions—given the buoyancy driven plume. Within the same source and under controlled conditions, nascent and annealed soot nanostructure has been observed to be uniform across multiple samples and thus, all images presented here are representative of the source type and condition that they were generated at.
3.5. Lattice fringe analysis: Length and tortuosity
Lattice fringe analysis quantifies material nanostructure by the physical metrics of lamellae length and curvature. Image analysis for nanostructure quantification can be problematic when there is non-uniformity of nanostructure at the primary particle level. This situation is much more common in flame or engine generated soots. As for all our analyses, several primary particles (∼10) are analyzed to test for statistical similarity. HRTEM images are skeletonized prior to quantification of length and tortuosity parameters. Examples of skeletonized images are shown for nascent and laser-heated R250 in Supplementary Information Figure S2 (a and b, e and f) and lamp black (c and d, g and h).
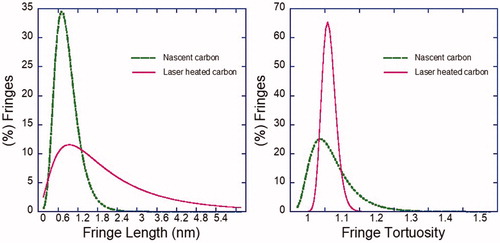
shows an example of the distribution curves of a nascent material and the relative change in the same distribution after laser heating obtained after quantification of skeletonized HRTEM micrographs. Nascent carbon has a significant number of shorter (<1 nm) and tortuous (tortuosity > 1) fringes. These trends reverse themselves after laser heating with a larger number of longer and straighter (tortuosity = 1) fringes as illustrated in .
Figure 10. Illustration of fringe length and tortuosity distributions for nascent and laser annealed carbon.
Using such distribution plots for all materials analyzed, median values of fringe length and tortuosity are presented in for the two model carbons and four combustion-generated soot before and after laser heating. Differences are seen between each source as illustrated by variations in the median lamellae length as well as tortuosity before laser heating. M1300, with a fullerene-like structure, exhibited the highest median tortuosity indicative of its curved nanostructure. Its lamellae were also shorter relative to the other carbons. Between the engine-generated soots, diesel soot showed a slightly longer lamellae length compared to the gasoline soot. Soot from the wood-fired boiler with amorphous nanostructure yielded the shortest lamellae length. The larger particles () from the Gulf oil spill soot show the longest lamellae across all of the soots, marginally exceeding that of R250. High variability from real sources and large-scale facilities with complexity and variation in the combustion process in large-scale systems results in these small differences. It would, therefore, be advantageous to emphasize recognizable structural variances and highlight subtle chemical alterations due to the presence of heteroatoms, surface complexes and cross-links.
Figure 11. Comparison of median fringe length and tortuosity values across the different soots, before and after laser annealing.
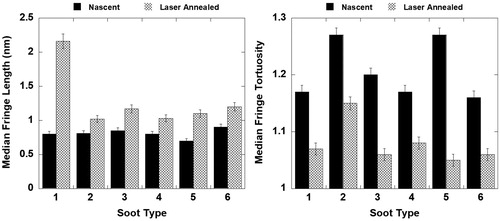
Upon laser heating, the fringe analysis results further distinguish the different samples. The lamellae length of R250 increased by ∼3 fold while decreasing the tortuosity compared to its initial nanostructure. M1300 carbon also showed a slight increase in lamellae length, but there was some curvature observed as indicated by the median tortuosity of 1.15. Between the engine-generated soots, laser-heated diesel soot showed slightly longer lamellae compared to the laser-heated gasoline soot. The boiler and Gulf spill soot also showed an increase in lamellae length. The difference between the fringe parameters across the soots is better distinguished after laser heating.
3.6. Lattice fringe analysis: Fringe stacking and void area
To supplement length and tortuosity analysis, additional parameters such as number of stacked fringes and resultant void area after laser heating can also be analyzed using HRTEM images. Examples of this are presented here as a demonstration of the variation that can be gauged from this technique. Stack analysis has been done using an available algorithm (Luow Citation2013) which groups fringes into stacks based on meeting a user-defined orientation criterion to determine whether a fringe will qualify as a part of a stack. Supplementary Information Figure S3 shows laser annealed skeletonized images for R250 and lamp black, color-coded by the number of stacks. shows the stacking size distribution calculated from nascent and laser-heated R250 and lamp black samples.
Figure 12. Stack analysis for nascent and laser annealed R250 and Lamp Black.
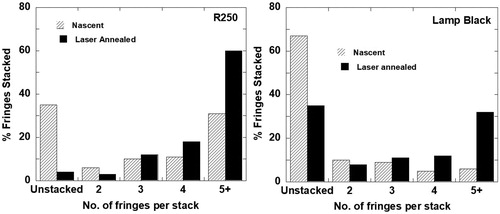
Both laser-heated samples show a greater number of 5+ fringes per stack while their nascent counterparts show many unstacked fringes. Across samples, laser-heated R250 carbon has a high fraction (∼60%) of stacks comprising of 5+ graphitic layers. Unstacked fringes also see a decline from ∼35% to ∼5% after laser heating. In contrast, laser-heated lamp black consists of ∼31% stacks with 5+ fringes per stack.
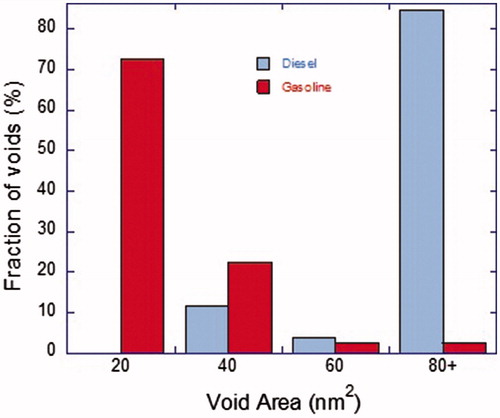
Laser heating results in a higher number of stacked fringes due to lamellae rearrangement which causes the formation of void-like areas with a very low density of carbon lamellae in these “void” regions, observed by the mass-thickness contrast in HRTEM images. For the purpose of identification, Voids observed in HRTEM images have been classified as regions having an approximately constant visual appearance (i.e. intensity). Void areas have been quantified and binned for Diesel and Gasoline soot, with an illustration of void area selection shown in and subsequent quantified bar-chart comparison showing significant differences between the two samples in .
Figure 13. Void area selection for (a) diesel and (b) gasoline soot.
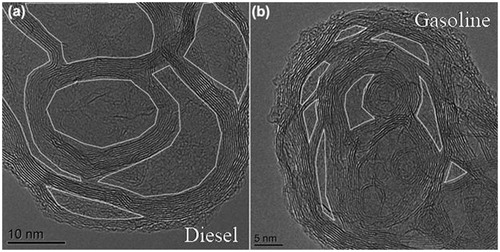
Figure 14. Void area quantification for diesel and gasoline soot.
Thus, pulsed laser annealing transforms the material and helps distinguish it from other laser-heated soot. Most carbon clutter is removed, and volatiles escape or decompose at elevated temperatures. Lamellae grow, align and reorient, aided by the removal of cross-links and bonding enabled by radical sites created under thermal action, making the lamellae distinct and highly recognizable. Such clarity aids image processing where the first step of the processing algorithm is to pick out the lamellae and form a skeletal image representation.
3.7. EELS analysis and dependence on bonding sp2/sp3 ratio
Illustrating the impact of small chemical differences upon the nanostructure evolution upon pulsed laser heating are the results on two carbon blacks, R250 and lampblack. Not all particles transform similarly on laser heating despite their co-existence within the same aggregate. For R250, for example, a few transformed to particles with multi-faceted internal structure and other particles with hollow shells, as indicated by the solid and skeletal arrows in .
Figure 15. Low magnification TEM images of R250 carbon (a and b) nascent and (c and d) laser annealed.
In , graphitic planes are detected along the outer periphery of the particle. This arrangement gives the primary particle its rosette-like appearance. Differently, shows a banded rim consisting of a few graphitic planes with the interior lacking structure. Its uniform translucent appearance to the electron beam and lack of structure indicate a hollow interior. Angle tilt images across ±60° angles showed the same void structure. This extreme difference in the structures resulting from laser-heating strongly highlights the heterogeneity across the nascent particles.
Figure 16. Laser annealed R250 showing different nanostructure evolution—(a) particles with internal structures, (b) hollow shells.
The nascent HRTEM images of R250 showed structural similarity across multiple particles. However, laser heating led to a variety of structures, suggesting underlying differences across particles. If not evident in the nanostructure, such differences are inferred to be those associated with variations at the molecular level, hence the reference to particle “chemistry.” Specifically, chemistry, as used here, is defined as the elemental composition, (e.g., H and C-atoms, hetero-atoms) and carbon bonding (e.g., sp2 versus sp3 carbon hybridization). For small changes in chemistry (such as the H/C ratio), the lamellae distributions may not change measurably by fringe analysis, i.e., the nanoscale may not be a sensitive measure of chemistry. However, small differences in chemistry may prove significant upon laser heating. Techniques such as XPS and FTIR can provide valuable chemical information but are an average over several microns of the sample area, representing very large populations of carbon particles. Oppositely, electron-based spectroscopic methods have the potential for very high spatial resolution. Several researchers have successfully implemented EELS to investigate local sp2/sp3 bonding ratios in carbon-based materials (Papworth et al. Citation2000; Yuan and Brown Citation2000; Chu and Li Citation2006; Song et al. Citation2006). The advantage of using EELS in STEM mode is that it allows sp2/sp3 determination on spot sizes of <1 nm without sample alteration.
EELS was employed on six different R250 primary particles as shown by the high-angle annular dark-field images (HAADF) collected in STEM mode and shown in . These images show an approximate location of the probe/beam position for spectra collection for all the measured particles to evaluate chemistry differences. As observed in the images, EELS spectra are collected approximately from the particle center, indicated by the crosshairs. Random orientation of short lamellae at the particle core renders the material effectively isotropic for this measurement. The resulting normalized EELS spectra overlay from these particles are shown in .
Figure 17. HAADF images of R250 particles along with crosshairs show the beam position of respective images.
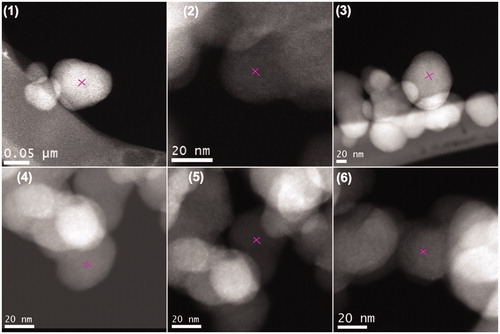
Figure 18. Overlaid EELS spectra of the R250 particles.
displays typical K-shell (1s) absorption edges of the six different R250 particles. In EELS, exciting core 1 s electrons of carbon atoms generally produces two peaks—a π* graphitic peak is observed at 287 eV resulting from the excitations of electrons from the ground state 1 s core energy level to the vacant π* anti-bonding states. The second broad peak observed at 295 eV is attributed to excitation of these core electrons to the anti-bonding σ* state, i.e., the 1 s → σ* transition (Fan et al. Citation1999; Papworth et al. Citation2000). The intensity ratio of the two peaks, Iπ/Iσ, provides a relative ratio of sp2/sp3 and the degree of “crystallinity,” referred to here as graphitic nanostructure (Jäger et al. Citation1999). There is significant variation in the intensity of the graphitic peak at 287 eV across the particles. Particle 2, for example, shows a prominent graphitic peak indicative of sp2 carbon, whereas particles 4 and 5 show comparatively low graphitic peak intensities. The legend of summarizes the peak intensity ratios (Iπ/Iσ) calculated for the six R250 particles.
The varied Iπ/Iσ values across different particles suggest significant differences in the individual particles’ chemistry, specifically at the particle core, given the preferential core weighting by the spherical geometry. Complementing visual differences, quantified ratios suggest a 60% larger graphitic peak intensity increase for particle 2 compared to particles 4 and 5. Such differences can account for the variety of structures observed after laser heating. Particles that show lower Iπ/Iσ contain a larger proportion of sp3 bonded carbons. The sp3 carbon is attributed to paraffinic (organic) content, which can occur as alkyl groups of substituted aromatic frameworks (Jäger et al. Citation1999; László, Tombácz, and Josepovits Citation2001; Estrade-Szwarckopf Citation2004; Vander Wal, Bryg, and Hays Citation2011) or perhaps be independent saturated molecular species (Boehm Citation1994; Titantah and Lamoen Citation2005; Semmelhack et al. Citation2006). Under the action of a pulsed laser, pyrolysis and/or volatilization of such organic carbon in the particle interior will occur, followed by rearrangement and concurrent “densification” of the carbon thereby accounting for the formation of large central voids (Hurt et al. Citation1988; Easler, Bradt, and Walker Citation1990; Hurt, Sarofim, and Longwell Citation1993; Vander Wal et al. Citation2007; Jaramillo et al. Citation2015; Gaddam et al. Citation2016). Conversely, particles with high Iπ/Iσ ratio contain significant aromatic carbon at their particle cores. For these particles, depending on the crystallite units and their relational order, graphitization will proceed to link and reorder these units. The resulting structure will depend upon geometrical constraints and potential nucleation centers with potential for ribbons of parallel lamellae, multiple substructures, or small voids within a single particle. The variation in R250 particles’ chemistry is consistent with the variety of structures observed upon pulsed laser heating.
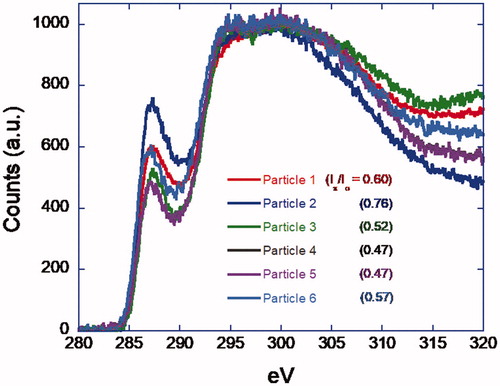
Laser heating of lamp black, on the other hand, consistently resulted in similar structures, i.e., banded lamellae with extended lengths that leave small diamond-shaped compartments and other small voids formed by gaps between the ribbons, but notably, with no evidence of large hollow shells. Three different lamp black particles were chosen for EELS analysis to validate HRTEM and their respective HAADF images are shown in .
Figure 19. (a–c) HAADF images of lamp black particles along with crosshairs show the beam position of respective images. (d) Overlaid EELS spectra of the lamp black particles.
displays K1s EELS spectra of three different lamp black particles. Two peaks are observed: (1) a π* graphitic peak at 287 eV and (2) σ* reflective of defective carbon at 295 eV. The overlaid plots reveal no significant variations in the two peaks intensities. As noted in the figure legend, the Iπ/Iσ values do not differ significantly across the three lamp black particles.
EELS in STEM mode offers nanometer resolution and aids interpretation of particle-to-particle variability upon laser irradiation. Results illustrate that low sp2 relative to sp3 content fosters large void formation and multiple concentric graphitic shells around the particle. Higher sp2 content appears to impose constraints that inhibit such large-scale transformations. Instead, small and more numerous voids form, with geometries dictated by the limited restructuring. The division between these behaviors is not rigid, nor is their prediction based on the specific value for the sp2/sp3 ratio. The tests and observations presented here warrant further definition of the sp2/sp3 ratio and outcomes by more samples with varied chemistry exposed to high-intensity laser irradiation. The present results point to the role of particle chemistry as an additional parameter governing the material transformation under pulsed laser annealing. A coarser, more spatially averaged approach for characterizing differences in fringe stacking and compartments they form are radial fringe density plots based on FFT transforms of the HRTEM bright-field image. Preliminary results for the engine-derived soots from this study may be found in the supplementary material of this work.
4. Discussion
Thermal treatment of bulk carbons has been extensively studied using XRD, Raman, and HRTEM (Kinney, Nunn, and Walker Citation1957; Heckman Citation1964). By such techniques, carbons are broadly described as graphitizing and non-graphitizing (McEnaney Citation1974; Abrahamson et al. Citation2018a). Long-range order develops in graphitizing carbons while the development of extended lamellae is restricted in non-graphitizing carbons. Different explanations have been presented over decades including cross-links (Franklin Citation1950), intertwined lamellae (Marsh et al. Citation1971; Ban, Crawford, and Marsh Citation1975), fullerene-like curvature (Harris and Tsang Citation1997; Harris Citation2018), referred to as fullerenic nanostructure (Pope, Marr, and Howard Citation1993; Grieco et al. Citation2000) and more recently, the presence of odd-membered rings (Abrahamson et al. Citation2018a). In other instances, the result has been attributed to differences in the initial bonding chemistry, e.g., sp2/sp3 ratio (Gaddam Citation2015). The singular thread of these varied explanations lies in the diversity of final annealed nanostructure. Indeed, most classifications of graphitizing and non-graphitizing carbons are based on the end (nano)structure, not the initial nanostructure which differs among carbon materials and allotropes (Vander Wal and Tomasek Citation2003; Hays and Vander Wal Citation2007; Vander Wal, Bryg, and Huang Citation2014; Huang and Vander Wal Citation2013, Citation2016; Vander Wal et al. Citation2013). Therein, lies the premise that different initial nanostructures will anneal “differently”—reaching varying stages and types of graphitic structure (nanostructure). Another key distinction in conventional thermal studies is that processing occurs on timescales of hours (Heidenreich, Hess, and Ban Citation1968; Donnet Citation1982; Russell, Gibbins, and Williamson Citation1999; Yudasaka et al. Citation2003). In contrast, pulsed laser heating occurs on timescales nearly a factor of 1010 faster with subsequent cooling on a timescale of microseconds.
In pulsed laser annealing, the transformations occur within nanoseconds while the carbon is at elevated temperatures >2200 °C, traditionally considered as a threshold for graphitization (McEnaney Citation1974). Bond breaking occurs on picosecond time scales while long-range motions such as reorientation of graphene segments occur on longer timescales. Dangling bonds and edge defects are eliminated (Radovic Citation2012) enabling lamellae mobility resulting in soot nanostructure that can relax into a thermodynamically stable graphitic lattice structure. Small, flat graphitic units of will largely consist of edge sites and thus the formation of closed fullerene-like shells during the layer plane growth is energetically favorable (Guo et al. Citation1995). Similar annealing and crystallite layer plane growth has been observed in other heat-treatment studies of a variety of carbons including soots, carbons blacks and specialty carbons (Oberlin and Terriere Citation1975; Hanzawa et al. Citation2002; Endo et al. Citation2003). As seen in the results presented, initial physical nanostructure along with the particle chemistry accounts for the variety of nanostructures observed across the various carbons upon pulsed laser irradiation.
Within any combustion system the environment is non-uniform in temperature, species and concentration. The carbon blacks, as engineered materials are free from heteroelements arising from the engine or lube oil. The varied grades illustrate the control that initial nanostructure imparts upon the annealing process: curved lamellae retain curvature during growth, core-shell structure produce hollow shells, multiple nuclei lead to internal intersecting graphitic ribbons. In case of arc soot and M1300 carbon, the preservation of aggregate morphology and primary particle size is clear from the results, but not necessarily intuitive nor certain. Arc soot clearly shows that such structures do not reform spontaneously. More importantly, arc soot as an amorphous material contrasts with the greater degree of structure observed within the carbon blacks. While an amorphous material is expected to exhibit the highest degree of annealing given the greatest level of disorder and reactive edge sites for growth by bonding and the smallest graphene segments to facilitate reorientation, the carbon blacks clearly highlight the efficacy of some initial structure (identifiable graphene segments) towards forming a more ordered “graphitic” structure. M1300 further differentiates the impact of initial nanostructure upon the annealed carbon. Its graphene segments possess a high degree of curvature, unlike R250 and lamp black. The high temperature does not fully destroy the curvature but propagates it as such, i.e., the curvature is retained, the few-layer stacking of the initial material does not change. The curvature appears to prevent the development of stacking by a geometrical mismatch between adjacent graphene segments.
The aim of this study is to introduce laser annealing as an added tool towards differentiating soot collected from real world sources in a relatively straightforward manner. Examples from a variety of combustion sources and carbon blacks have been presented as an illustrative set demonstrating the technique, with images and quantification of these images to be used in conjunction with other available information, EELS for instance, also obtained from TEM analysis. A feature of the method is the use of very small samples—such as may be deposited upon a TEM grid. Extracting high resolution structural and bonding information from femtogram sample quantities and yet being able to potentially differentiate soot types is currently work in progress—this study being a first presentation of the technique. Changes in median fringe length and tortuosity illustrate a change post laser annealing and this degree of change can be quantified for each soot type. A more telling comparison of median values is the difference within each soot type after laser annealing. Additional parameters such as fringe spacing, angle between fringes or centroid-to-centroid distance will prove to be complementary to the existing parameters. The idea is to use changes from laser-based heating as a complementary technique to other analyses, such as microscopy and spectroscopy by which soots and their sources can be differentiated.
Initial nanostructure governs the trajectory of the carbon along the graphitization path. Graphene segments lengthen; overall the material loses some (high) curvature in the process but appears incapable of achieving long-range order by virtue of initial nanostructure. Pulsed laser heating leads to annealing of lamellae and accentuated nanostructure variations wherein the spatial organization of lamellae is significantly different across these model carbon materials and combustion-generated soots. These changes are interpreted as a combination of initial nanostructure in conjunction with the chemistry, together governing the material transformation under pulsed laser annealing.
5. Conclusions
The premise of SSILD is soot formation conditions differ by fuel, pressure, temperature, time, and species across combustion sources. This convolution of parameters can often render nascent nanostructure difficult to differentiate between specific sources. The blend of formation conditions leads to different chemical composition (H/C, heteroatoms) and other structural variations including cross-links, ad-atoms, defects, etc., in the soot. These become magnified during rapid annealing under the action of pulsed laser heating. Our first goal is this study was to illustrate the improved nanostructure recognition brought about by laser annealing. Our second goal was to illustrate differences between carbons, dependent upon source/formation. A variety of soots—both carbon blacks and combustion-generated—were annealed by single pulse laser irradiation. Nanostructure is characterized by HRTEM. Visual inspection of the laser annealed HRTEM images indicates extensive annealing with the formation of shell-like, rosette and nested compartment structures depending on the soot sample and its source. The action of laser results in bond breaking within picosecond time scales accompanied by reforming, which results in lamellae growth and reorientation accounting for the restructuring of the carbon (soot) samples (Abrahamson et al. Citation2017). The diversity of nanostructures observed across the various carbons upon pulsed laser irradiation is ascribed to variable initial physical nanostructure along with the chemistry of formation. EELS measurements support this inference by identifying different sp2/sp3 ratios as consistent with different SSILD outcomes for the R250 carbon black. Quantification of HRTEM micrographs using fringe analyses demonstrates that the nanostructural parameters such as lamellae length are magnified upon laser heating, and thereby enabling differentiation based on nanostructure and potential source identification of the soot origin.
Supplemental Material
Download MS Word (11.8 MB)Acknowledgments
HRTEM was performed using the facilities of the Materials Research Institute at The Pennsylvania State University.
Additional information
Funding
References
- Abrahamson, J. P., A. Jain, A. van Duin, and R. L. Vander Wal. 2018a. Carbon structure and resulting graphitizability upon oxygen evolution. Carbon 135:171–79. doi:10.1016/j.carbon.2018.04.055.
- Abrahamson, J. P., A. Jain, A. van Duin, and R. L. Vander Wal. 2018b. Trajectories of graphitizable anthracene coke and non-graphitizable sucrose char during the earliest stages of annealing by rapid CO2 laser heating. Carbon (J. Carbon Res.) 4 (2):36. doi:10.3390/c4020036.
- Abrahamson, J. P., M. Singh, J. P. Mathews, and R. L. Vander Wal. 2017. Pulsed laser annealing of carbon black. Carbon 124 (14):380–90. doi:10.1016/j.carbon.2017.08.080.
- Abrahamson, J. P., and R. L. Vander Wal. 2018. Carbon nanostructure curvature induced from the rapid release of sulfur upon laser heating. Carbon (J. Carbon Res.) 4 (2):33–41. doi:10.3390/c4020033.
- Alexandrou, I., H.-J. Scheibe, C. J. Kiely, A. J. Papworth, G. A. J. Amaratunga, and B. Schultrich. 1999. Carbon films with a novel Sp2 network structure. Phys. Rev. B 60 (15):10903–907.
- Anderson, B. E., A. J. Beyersdorf, C. H. Hudgins, J. V. Plant, K. L. Thornhill, E. L. Winstead, L. D. Ziemba, R. Howard, E. Corporan, and R. C. Miake-Lye. 2011. Alternative aviation fuel experiment (AAFEX). NASA technical report, NASA.
- Atribak, I., A. Bueno-López, and A. García-García. 2010. Uncatalysed and catalysed soot combustion under NOx + O2: Real diesel versus model soots. Combus. Flame 157 (11):2086–94. doi:10.1016/j.combustflame.2010.04.018.
- Aurell, J., and B. K. Gullett. 2010. Aerostat sampling of PCDD/PCDF emissions from the Gulf oil spill in situ burns. Environ. Sci. Technol. 44 (24):9431–37. doi:10.1021/es103554y.
- Ban, L. L., D. Crawford, and H. Marsh. 1975. Lattice-resolution electron microscopy in structural studies of non-graphitizing carbons from polyvinylidene chloride (PVDC). J. Appl. Crystallogr. 8 (4):415–20. doi:10.1107/S0021889875010904.
- Boehm, H. P. 1994. Some aspects of the surface chemistry of carbon blacks and other carbons. Carbon 32 (5):759–69. doi:10.1016/0008-6223(94)90031-0.
- Brydson, R. 2001. Electron energy loss spectroscopy. United States: Taylor & Francis.
- Chu, P. K., and L. Li. 2006. Characterization of amorphous and nanocrystalline carbon films. Mater. Chem. Phys. 96 (2–3):253–77. doi:10.1016/j.matchemphys.2005.07.048.
- Cuomo, J. J., J. P. Doyle, J. Bruley, and J. C. Liu. 1991. Sputter deposition of dense diamond-like carbon films at low temperature. Appl. Phys. Lett. 58 (5):466–68. doi:10.1063/1.104609.
- Daniels, H., R. Brydson, B. Rand, and A. Brown. 2007. Investigating carbonization and graphitization using electron energy loss spectroscopy (EELS) in the transmission electron microscope (TEM). Philosoph. Mag. 87 (27):4073–92. doi:10.1080/14786430701394041.
- Donnet, J. B. 1982. Structure and reactivity of carbons: From carbon black to carbon composites. Carbon 20 (4):267–82. doi:10.1016/0008-6223(82)90002-1.
- Easler, T. E., R. C. Bradt, and P. L. Walker. 1990. Gasification induced densification of form coke. Fuel 69 (1):124–25. doi:10.1016/0016-2361(90)90269-V.
- Endo, M., Y. A. Kim, T. Hayashi, T. Yanagisawa, H. Muramatsu, M. Ezaka, H. Terrones, M. Terrones, and M. S. Dresselhaus. 2003. Microstructural changes induced in ‘stacked cup’ carbon nanofibers by heat treatment. Carbon 41 (10):1941–47. doi:10.1016/S0008-6223(03)00171-4.
- Estrade-Szwarckopf, H. 2004. XPS photoemission in carbonaceous materials: A ‘defect’ peak beside the graphitic asymmetric peak. Carbon 42 (8–9):1713–21. doi:10.1016/j.carbon.2004.03.005.
- Fan, X., E. C. Dickey, S. J. Pennycook, and M. K. Sunkara. 1999. Z-contrast imaging and electron energy-loss spectroscopy analysis of chromium-doped diamond-like carbon films. Appl. Phys. Lett. 75 (18):2740. doi:10.1063/1.125134.
- Farron, C., N. Matthias, D. E. Foster, M. Andrie, R. Krieger, P. Najt, K. Narayanaswamy, A. Solomon, and A. Zelenyuk. 2011. Particulate characteristics for varying engine operation in a gasoline spark ignited, direct injection engine. SAE Technical Paper. Warrendale, PA: SAE International. doi:10.4271/2011-01-1220.
- Franklin, R. E. 1950. The interpretation of diffuse X-ray diagrams of carbon. Acta Crystallogr. 3 (2):107–21.
- Frenklach, M. 2002. Reaction mechanism of soot formation in flames. Phys. Chem. Chem. Phys. 4 (11):2028–37. doi:10.1039/B110045A.
- Gaddam, C. K. 2015. Electron microscopic and spectroscopic characterization for soot source differentiation by laser derivatization. State College, PA: The Pennsylvania State University. https://etda.libraries.psu.edu/catalog/26310.
- Gaddam, C. K., and R. L. Vander Wal. 2013. Physical and chemical characterization of SIDI engine particulates. Combus. Flame 160 (11):2517–2528. doi:10.1016/j.combustflame.2013.05.025.
- Gaddam, C. K., R. L. Vander Wal, X. Chen, A. Yezerets, and K. Kamasamudram. 2016. Reconciliation of carbon oxidation rates and activation energies based on changing nanostructure. Carbon 98:545–56. doi:10.1016/j.carbon.2015.11.035.
- Gordon, G. E. 1980. Receptor models. Environ. Sci. Technol. 14 (7):792–800. doi:10.1021/es60167a006.
- Grieco, W. J., J. B. Howard, L. C. Rainey, and J. B. Vander Sande. 2000. Fullerenic carbon in combustion-generated soot. Carbon 38 (4):597–614. doi:10.1016/S0008-6223(99)00149-9.
- Guo, T., P. Nikolaev, A. Thess, D. T. Colbert, and R. E. Smalley. 1995. Catalytic growth of single-walled manotubes by laser vaporization. Chem. Phys. Lett. 243 (1–2):49–54. doi:10.1016/0009-2614(95)00825-O.
- Guttikunda, S. 2009. Handbook on particulate pollution source apportionment. SIM-air Working Paper Series:16-2009. www.urbanemissions.info
- Guttikunda, S., and R. V. Kopakka. 2014. Source emissions and health impacts of urban air pollution in hyderabad, India. Air Qual., Atmos. Health 7 (2):195–207.
- Hansen, J., and L. Nazarenko. 2004. Soot climate forcing via snow and ice albedos. Proc. Nat. Acad. Sci. USA. 101 (2):423–28. http://www.pnas.org/content/101/2/423.abstract.
- Hanzawa, Y., H. Hatori, N. Yoshizawa, and Y. Yamada. 2002. Structural changes in carbon aerogels with high temperature treatment. Science 40:575–81.
- Harris, P. J. F., and S. C. Tsang. 1997. High-resolution electron microscopy studies of non-graphitizing carbons. Philosoph. Mag. A 76 (3):667–77. doi:10.1080/01418619708214028.
- Harris, P. J. F. 2018. Transmission electron microscopy of carbon: A brief history. Carbon (J. Carbon Res.) 4 (1):17.
- Harvey, C. 2016. Air pollution in India is so bad that it kills half a million people every year. The Washington Post, October 3. http://link.galegroup.com.ezaccess.libraries.psu.edu/apps/doc/A452088350/GIC?u=psucic&sid=GIC&xid=ed37d0b9.
- Hays, M. D., B. Gullett, C. King, and J. Robinson. 2011. Characterization of carbonaceous aerosols emitted from outdoor wood boilers. Energ. Fuels 25:5632–8. doi:10.1021/ef2012694.
- Hays, M. D., and R. L. Vander Wal. 2007. Heterogeneous soot nanostructure in atmospheric and combustion source aerosols. Energ. Fuels 21 (2):801–11. doi:10.1021/ef060442h.
- Hays, M. D., W. P. George, B. J. J. Schmid, R. Baldauf, R. Snow, J. R. Robinson, T. Long, and J. Faircloth. 2013. Carbonaceous aerosols emitted from light-duty vehicles operating on gasoline and ethanol fuel blends. Environ. Sci. Technol. 47 (24):14502–509. doi:10.1021/es403096v.
- Heckman, F. A. 1964. Microstructure of carbon black. Rubber Chem. Technol. 37 (5):1245–98. doi:10.5254/1.3540400.
- HEI. 2015. Diesel emissions and lung cancer. An evaluation of recent epidemiological evidence for quantitative risk assessment. Boston, MA: Health Effects Institute. https://www.healtheffects.org/publication/diesel-emissions-and-lung-cancer-evaluation-recent-epidemiological-evidence-quantitative.
- Heidenreich, R. D., W. M. Hess, and L. L. Ban. 1968. A test object and criteria for high resolution electron microscopy. J. Appl. Crystallogr. 1 (1):1–19. doi:10.1107/S0021889868004930.
- Hess, W. M., L. L. Ban, F. J. Eckert, and V. Chirico. 1968. Microstructural variations in commercial carbon blacks. Rubber Chem. Technol. 41 (2):356–72. doi:10.5254/1.3547174.
- Huang, C.-H., and R. L. Vander Wal. 2013. Effect of soot structure evolution from commercial jet engine burning petroleum based JP-8 and synthetic HRJ and FT fuels. Energ. Fuels 27 (8):4946–58. doi:10.1021/ef400576c.
- Huang, C.-H., and R. L. Vander Wal. 2016. Partial premixing effects upon soot nanostructure. Combus. Flame 168:403–8. doi:10.1016/j.combustflame.2016.01.006.
- Hurt, R. H., D. R. Dudek, J. P. Longwell, and A. F. Sarofim. 1988. The phenomenon of gasification-induced carbon densification and its influence on pore structure evolution. Carbon 26 (4):433–49. doi:10.1016/0008-6223(88)90142-X.
- Hurt, R. H. 1998. Structure, properties, and reactivity of solid fuels. Syp. (Int.) Combus. 27 (2):2887–904. doi:10.1016/S0082-0784(98)80148-3.
- Hurt, R. H., A. F. Sarofim, and J. P. Longwell. 1993. Gasification-induced densification of carbons: From soot to form coke. Combus. Flame 95 (4):430–32. doi:10.1016/0010-2180(93)90009-R.
- Iwashita, N., C. R. Park, H. Fujimoto, M. Shiraishi, and M. Inagaki. 2004. Specification for a standard procedure of X-ray diffraction measurements on carbon materials. Carbon 42 (4):701–14. doi:10.1016/j.carbon.2004.02.008.
- Jäger, C., T. Henning, R. Schlögl, and O. Spillecke. 1999. Spectral properties of carbon black. J. Non-Crystal. Solid. 258 (1–3):161–79. doi:10.1016/S0022-3093(99)00436-6.
- Jaramillo, I. C., C. K. Gaddam, R. L. Vander Wal, and J. S. Lighty. 2015. Effect of nanostructure, oxidative pressure and extent of oxidation on model carbon reactivity. Combus. Flame 162 (5):1848–56. doi:10.1016/j.combustflame.2014.12.006.
- Kinney, C. R., R. C. Nunn, and P. L. Walker. 1957. Carbonization of anthracene and graphitization of anthracene carbons. Ind. Eng. Chem. 49 (5):880–84. doi:10.1021/ie50569a034.
- Kulkarni, P., S. Chellam, and M. P. Fraser. 2007. Tracking petroleum refinery emission events using lanthanum and lanthanides as elemental markers for PM2.5. Environ. Sci. Technol. 41 (19):6748–54. doi:10.1021/es062888i.
- László, K., E. Tombácz, and K. Josepovits. 2001. Effect of activation on the surface chemistry of carbons from polymer precursors. Carbon 39 (8):1217–28. doi:10.1016/S0008-6223(00)00245-1.
- Luow, E. 2013. Structure and combustion reactivity of inertinite-rich and vitrinite rich south african coal chars: Quantification of the structural factors contributing to reactivity differences. State College, PA: The Pennsylvania State University.
- Marsh, P. A., A. Voet, T. J. Mullens, and L. D. Price. 1971. Quantitative micrography of carbon black microstructure. Carbon 9 (6):797–805. doi:10.1016/0008-6223(71)90013-3.
- Mastral, A. M., and M. S. Callén. 2000. A review on polycyclic aromatic hydrocarbon (PAH) emissions from energy generation. Environ. Sci. Technol. 34 (15):3051–57. doi:10.1021/es001028d.
- McEnally, C. S., L. D. Pfefferle, B. Atakan, and K. Kohse-Höinghaus. 2006. Studies of aromatic hydrocarbon formation mechanisms in flames: Progress towards closing the fuel gap. Progr. Energ. Combus. Sci. 32 (3):247–94. doi:10.1016/j.pecs.2005.11.003.
- McEnaney, B. 1974. Carbonization and graphitization. Phys. Technol. 5 (1):5–7. doi:10.1088/0305-4624/5/1/402.
- Mint. 2018. Arun Jaitley announces special scheme to tackle Delhi air pollution in budget 2018, Mint, February 1. http://ezaccess.libraries.psu.edu/login?url=https://search.proquest.com/docview/1992862869?accountid=13158.
- Moffet, R. C., Y. Desyaterik, R. J. Hopkins, A. V. Tivanski, M. K. Gilles, Y. Wang, V. Shutthanandan, L. T. Molina, R. G. Abraham, K. S. Johnson, et al. 2008. Characterization of aerosols containing Zn, Pb, and Cl from an industrial region of Mexico city. Environ. Sci. Technol. 42 (19):7091–97. doi:10.1021/es7030483.
- Mooney, C. 2016. The more we learn about air pollution, the worse it gets. The Washington Post, November 12. http://link.galegroup.com.ezaccess.libraries.psu.edu/apps/doc/A464783335/GIC?u=psucic&sid=GIC&xid=dbfef08e.
- Oberlin, A., and G. Terriere. 1975. Graphitization studies of anthracites by high resolution electron microscopy. Carbon 13 (5):367–376. doi:10.1016/0008-6223(75)90004-4.
- Palotás, Á. B., L. C. Rainey, C. J. Feldermann, A. F. Sarofim, and J. B. Vander Sande. 1996. Soot morphology: An application of image analysis in high-resolution transmission electron microscopy. Microsc. Res. Tech. 33 (3):266–278. doi:10.1002/(SICI)1097-00290215)33:3<266::AID-JEMT4>3.0.CO;2-O.
- Papworth, A. J., C. Kiely, A. P. Burden, S. Ravi Silva, and G. Amaratunga. 2000. Electron-energy-loss spectroscopy characterization of the Sp2 bonding fraction within carbon thin films. Phys. Rev. B 62:12628–12631. doi:10.1103/PhysRevB.62.12628.
- Picaud, S., P. N. M. Hoang, S. Hamad, J. A. Mejias, and S. Lago. 2004. Theoretical study of the adsorption of water on a model soot surface: II. Molecular dynamics simulations. J. Phys. Chem. B 108 (17):5410–15. doi:10.1021/jp037590i.
- Pope, C. J., J. A. Marr, and J. B. Howard. 1993. Chemistry of fullerenes C60 and C70 formation in flames. J. Phys. Chem. 97 (42):11001–13. doi:10.1021/j100144a018.
- PR Newswire. 2016. Three million people dying yearly due to outdoor air pollution, says WHO. PR Newswire. May 25. http://ezaccess.libraries.psu.edu/login?url=https://search.proquest.com/docview/1790910674?accountid=13158.
- Radovic, L. R., ed. 2012. Chemistry & physics of carbon. Vol.31, 1st ed. New York, NY: CRC Press.
- Ramanathan, V., P. J. Crutzen, J. T. Kiehl, and D. Rosenfeld. 2001. Aerosols, climate, and the hydrological cycle. Science 294 (5549): 2119–24. http://science.sciencemag.org/content/294/5549/2119.abstract.
- Rosenfeld, J. M. 2003. Derivatization in the current practice of analytical chemistry. TrAC Trends Anal. Chem. 22 (11):785–98. doi:10.1016/S0165-9936(03)01205-6.
- Russell, N. V., J. R. Gibbins, and J. Williamson. 1999. Structural ordering in high temperature coal chars and the effect on reactivity. Fuel 78 (7):803–7. doi:10.1016/S0016-2361(98)00210-5.
- Sadezky, A., H. Muckenhuber, H. Grothe, R. Niessner, and U. Pöschl. 2005. Raman microspectroscopy of soot and related carbonaceous materials: Spectral analysis and structural information. Carbon 43 (8):1731–42. doi:10.1016/j.carbon.2005.02.018.
- Semmelhack, H. C., R. Höhne, P. Esquinazi, G. Wagner, A. Rahm, K. H. Hallmeier, D. Spemann, and K. Schindler. 2006. Growth of highly oriented graphite films at room temperature by pulsed laser deposition using carbon-sulfur targets. Carbon 44 (14):3064–72. doi:10.1016/j.carbon.2006.05.004.
- Sharma, A., T. Kyotani, and A. Tomita. 1999. A new quantitative approach for microstructural analysis of coal char using HRTEM images. Fuel 78 (10):1203–12. doi:10.1016/S0016-2361(99)00046-0.
- Shrestha, G., S. J. Traina, and C. W. Swanston. 2010. Black carbon’s properties and role in the environment: A comprehensive review. Sustainability 2 (1):294–320. doi:10.3390/su2010294.
- Song, J., M. Alam, A. Boehman, and U. Kim. 2006. Examination of the oxidation behavior of biodiesel soot. Combus. Flame 146 (4):589–604. doi:10.1016/j.combustflame.2006.06.010.
- Strzelec, A., T. Toops, S. Daw, D. Foster, and C. Rutland. 2010. ULSD and biodiesel particulate oxidation model: Combined effects of volatiles and fixed carbon combustion. SAE Technical Papers, October. Warrendale, PA: SAE International. doi:10.4271/2010-01-2127.
- The Times of India. 2018. India, China account for over half of global deaths due to air pollution: Report. The Times of India, October 3. http://link.galegroup.com.ezaccess.libraries.psu.edu/apps/doc/A538039992/GIC?u=psucic&sid=GIC&xid=7d0599c1.
- Titantah, J. T., and D. Lamoen. 2005. Sp3/Sp2 characterization of carbon materials from first-principles calculations: X-ray photoelectron versus high energy electron energy-loss spectroscopy techniques. Carbon 43 (6):1311–16. doi:10.1016/j.carbon.2005.01.002.
- US EPA. 2002. Health assessment document for diesel engine exhaust. Prepared by the national center for environmental assessment. Washington, DC: Office of Transportation and Air Quality. EPA/600/8-90/057F. https://cfpub.epa.gov/si/si_public_record_report.cfm?dirEntryId=29060&simpleSearch=1&searchAll=diesel.
- Vander Wal, R. L., V. M. Bryg, and M. D. Hays. 2011. XPS analysis of combustion aerosols for chemical composition, surface chemistry, and carbon chemical state. Anal. Chem. 83 (6):1924–1930. doi:10.1021/ac102365s.
- Vander Wal, R. L., V. M. Bryg, and C.-H. Huang. 2014. Aircraft engine particulate matter: Macro- micro- and nanostructure by HRTEM and chemistry by XPS. Combus. Flame 161 (2):602–11. doi:10.1016/j.combustflame.2013.09.003.
- Vander Wal, R. L., and M. Y. Choi. 1999. Pulsed laser heating of soot: Morphological changes. Carbon 37 (2):231–39. doi:10.1016/S0008-6223(98)00169-9.
- Vander Wal, R. L., and C. J. Mueller. 2006. Initial investigation of effects of fuel oxygenation on nanostructure of soot from a direct-injection diesel engine. Energ. Fuels 20 (6):2364–69. doi:10.1021/ef060201+.
- Vander Wal, R. L., A. Strzelec, T. J. Toops, C. S. Daw, and C. L. Genzale. 2013. Forensics of soot: C5-related nanostructure as a diagnostic of in-cylinder chemistry. Fuel 113:522–6. doi:10.1016/j.fuel.2013.05.104.
- Vander Wal, R. L., and A. J. Tomasek. 2003. Soot oxidation: Dependence upon initial nanostructure. Combus. Flame 134 (1–2):1–9. https://doi.org/10.1016/S0010-2180(03)00084-1.
- Vander Wal, R. L., and A. J. Tomasek. 2004. Soot nanostructure: Dependence upon synthesis conditions. Combus. Flame 136 (1–2):129–40. doi:10.1016/j.combustflame.2003.09.008.
- Vander Wal, R. L., A. J. Tomasek, M. I. Pamphlet, C. D. Taylor, and W. K. Thompson. 2004. Analysis of HRTEM images for carbon nanostructure quantification. J. Nanopart. Res. 6 (6):555–68. doi:10.1007/s11051-004-3724-6.
- Vander Wal, R. L., A. J. Tomasek, K. Street, D. R. Hull, and W. K. Thompson. 2004. Carbon nanostructure examined by lattice fringe analysis of high-resolution transmission electron microscopy images. Appl. Spectros. 58 (2):230–37. http://as.osa.org/abstract.cfm?URI=as-58-2-230.
- Vander Wal, R. L., A. Yezerets, N. W. Currier, D. H. Kim, and C. M. Wang. 2007. HRTEM study of diesel soot collected from diesel particulate filters. Carbon 45 (1):70–77. doi:10.1016/j.carbon.2006.08.005.
- Wang, H., and M. Frenklach. 1997. A detailed kinetic modeling study of aromatics formation in laminar premixed acetylene and ethylene flames. Combus. Flame 1:173–221. doi:10.1016/S0010-2180(97)00068-0.
- Wang, R., Y. Balkanski, O. Boucher, P. Ciais, G. L. Schuster, F. Chevallier, B. H. Samset, J. Liu, S. Piao, M. Valari, and S. Tao. 2016. Estimation of global black carbon direct radiative forcing and its uncertainty constrained by observations. JGR: Atmospheres 121 (10):5948–71. doi:10.1002/2015JD024326.
- Wang, Y., P.-H. Li, H.-L. Li, X.-H. Liu, and W.-X. Wang. 2010. PAHs distribution in precipitation at mount taishan: China. Identification sources meteorological influences. Atmos. Res. 95 (1):1–7. doi:10.1016/j.atmosres.2009.07.011.
- Wang, Z., J. Chen, P. Yang, F. Tian, X. Qiao, H. Bian, and L. Ge. 2009. Distribution of PAHs in pine (Pinus thunbergii) needles and soils correlates with their gas-particle partitioning. Environ. Sci. 43 (5):1336–41. doi:10.1021/es802067e.
- WHO. 2018. Ambient (outdoor) air quality and health. WHO Fact Sheet 2018 http://www.who.int/en/news-room/fact-sheets/detail/ambient-(outdoor)-air-quality-and-health.
- Wornat, M. J., R. H. Hurt, N. Y. C. Yang, and T. J. Headley. 1995. Structural and compositional transformations of biomass chars during combustion. Combus. Flame 100 (1–2):131–43. doi:10.1016/0010-2180(94)00055-W.
- Xinhua News Agency. 2018. Beijing to spend over 19 bln yuan to tackle air pollution in 2018. Xinhua News Agency, November 12. http://link.galegroup.com.ezaccess.libraries.psu.edu/apps/doc/A525021149/GIC?u=psucic&sid=GIC&xid=930791ad.
- Yan, B., T. A. Abrajano, R. F. Bopp, D. A. Chaky, L. A. Benedict, and S. N. Chillrud. 2005. Molecular tracers of saturated and polycyclic aromatic hydrocarbon inputs into central park lake, New York city. Environ. Sci. Technol. 39 (18):7012–19. doi:10.1021/es0506105.
- Yang, Y.,. P. Guo, Q. Zhang, D. Li, L. Zhao, and D. Mu. 2010. Seasonal variation, sources and gas/particle partitioning of polycyclic aromatic hydrocarbons in guangzhou, China. Sci. Total Environ. 408 (12):2492–500. doi:10.1016/j.scitotenv.2010.02.043.
- Yehliu, K., R. L. Vander Wal, and A. L. Boehman. 2011. Development of an HRTEM image analysis method to quantify carbon nanostructure. Combus. Flame 158 (9):1837–51. doi:10.1016/j.combustflame.2011.01.009.
- Yuan, J., and L. M. Brown. 2000. Investigation of atomic structures of diamond-like amorphous carbon by electron energy loss spectroscopy. Micron 31 (5):515–25. doi:10.1016/S0968-4328(99)00132-8.
- Yudasaka, M., T. Ichihashi, D. Kasuya, H. Kataura, and S. Iijima. 2003. Structure changes of single-wall carbon nanotubes and single-wall carbon nanohorns caused by heat treatment. Carbon 41 (6):1273–80. doi:10.1016/S0008-6223(03)00076-9.