
 ?Mathematical formulae have been encoded as MathML and are displayed in this HTML version using MathJax in order to improve their display. Uncheck the box to turn MathJax off. This feature requires Javascript. Click on a formula to zoom.
Abstract
An anti-bacterial filter was developed using poly vinylidene fluoride (PVDF) nanofibers using electrospinning method blended with silver nanoparticles (AgNO3) of varying weight percentages of filler. Polypropylene (PP) non-woven substrate was used as base material for collecting the nanofibers. It also acted as a barrier to protect the fibers. UV-visible spectroscopy and fourier transform infra red spectroscopy confirmed the uniform dispersion of silver nanoparticles throughout the nanofibers. The experiment was designed using Box–Behnken statistical tool through three different variables namely, PP non-woven sheets (GSM), electrospinning time (hours), concentration of silver (wt%) in 15 runs. Surface morphology was analyzed using scanning electron microscopy and atomic force microscopy. Thermogravimetric analysis was performed for the analyses of mass decomposition of the material. Bacterial filtration efficiency and anti-bacterial activity studies were tested against Staphylococcus aureus and Escherichia coli for both PVDF + 0 wt% Ag fibers and PVDF-Ag nanofibers. This research shows the bacterial filtration efficiency for the prepared PVDF-Ag nanofibers as 99.86%. The prepared nanofilter was shown providing greater possibilities towards the application for clean air management.
© Copyright 2019 American Association for Aerosol Research
EDITOR:
1. Introduction
In simple terms, the release of pollutants in air which are detrimental to human health can be referred to as air pollution. Since the 1970s, “Clean Air” authorizes U.S. Environmental Protection Agency (EPA) to protect public health from emissions of harmful pollutants. Air borne microorganisms, mainly, bacteria and viruses make a major contribution as pollutants in hospitals, common buildings, health-care facilities, poultry houses, laboratories, waste recycling units and industries involving composting, biotechnology, tanning and, when left unprotected, cause living organisms prone to a wide range of diseases. The suspended aerosols which remain as such for hours are then transmitted through air conditioning systems (Lubasova et al. Citation2012).
Air filtration is a wide spread area which includes: dust, pollen, mold spores, smoke particles and volatile organic compounds. For instance, a study by Jones and Cookson suggests that 34% of bacteria present in outdoor air of suburban area attracted in respiratory tracts of living (Jones and Cookson Citation1983). With the recent advances in nanotechnology, there has been an increase in the utilization of nano particles in various fields. In addition, it comes under the category of high value low input class due to its minute size and efficiency. Among various technologies available including cyclotrons, wet scrubbers, electrostatic precipitators, gravimetric precipitators, etc., fibrous filters own their peak application due to their higher efficiency collection particles up to less than one micrometer (Tabe Citation2014; Mohraz et al. Citation2018).
There are certain challenges in utilizing fibrous filter as high filtration efficiency resulting in high pressure loss which provides increased energy consumption in industrial filtration processes. This leads to the conclusion that the developed filter should possesses high filtration efficiency with reduced pressure drop (Wang et al. Citation2012; Mohraz et al. Citation2018). According to the concept of filtration theory, the filtration efficiency increases as the fiber size decreases. This is due to the increase in the number of fibers present per unit area which in turn, increases the impact of the filtering particles. Nanofibers have also the advantages of low basic weight, small pore size, and uniform size with a large surface to volume ratio (Selvam and Nallathambi Citation2015). Several researches suggest that the application of non-woven fabrics with appropriate fiber deposition produce higher filtration efficiency with low pressure drop as nanofibers as such are difficult to handle (Selvam and Nallathambi Citation2015).
Electrospinning is the process of producing nanofibers with the aid of polymer solutions through application of high voltage electrical charge between the jet flow and the ground collector. There are three main parameters including operational parameters which comprise; the solution molecular weight, concentration, viscosity and the surface tension; process parameters that include the flow rate, the applied voltage, collectors and the distance between the collector and the syringe tip and environmental parameters which include, humidity, temperature. These parameters play a major role in the effective application of electrospinning (Mohraz et al. Citation2018).
Air filtration efficiency is also endorsed on the basis of the polymer in preference to spinning the fibers. Among polymers, polyvinylidene fluoride (PVDF) has been the subject of extensive study due to its unique electro-active property including piezo, pyro and ferro electric properties, flexibility, light weight and long-term stability (Ahn et al. Citation2013). PVDF is chemically a semi-crystalline polymer with outstanding mechanical, thermal and biocompatible properties. The electro activity of PVDF depends mostly on its β phase (Gonzalez et al. Citation2016; Issa et al. Citation2017; Kesavan et al. Citation2017; Metcalf, Narayan, and Dutcher Citation2018). The piezo electric effect however depends on the processing of nanofibers mat (Ding et al. Citation2008; Bai et al. Citation2012; Li et al. Citation2014).
Silver (Ag) has also been a matter of meticulous interest due to its unique properties, such as good conductivity, chemical stability, and catalytic and anti-bacterial activity (Jeong and Park Citation2014). The anti-bacterial activity of silver has been investigated over the past decade. The key in the development of an anti-bacterial filter lies in understanding the mode of action of the process. This occurs in two ways, viz; either by behaving with the environment resulting in physical or chemical modifications (through mechanisms such as adsorption, absorption, photo reactions, aggregations and interactions with ions) or by the reaction between the silver containing species with the bacteria. The second mode is dependent on the first and occurs either by the accumulation of the silver nanoparticles at the bacterial membrane resulting in aggregation or by the generation of reactive oxygen species of Ag nanoparticles resulting in cytotoxic actions (Le Ouay and Stellacci Citation2015). Study on Ag nanoparticles (NPs) emerged around 2004 and rose exponentially (Sondi and Salopek-Sondi Citation2004). The advantages of utilizing nano-silver systems are possession of a very high range of anti-microbial activity against broad range of microbes and parasites, even when minimal doses are supplied. Also these dosages have very low systematic toxicity towards humans. In addition, they are relatively inexpensive and easily available (Mollahosseini et al. Citation2012).
Response surface methodology (RSM) is a set of mathematical and statistical techniques meant for applications such as designing an experiment, developing a model, evaluation, determination of optimum conditions, etc. It helps in minimizing the errors in the determination of parameters, resulting in simultaneous effect and variation of the parameters optimized. Here, the role of optimization is ideal in the efficiency and development of any process. Statistical design has been proven to better suit than one-at-a-time method owing to the time, optimization and efficiency (Hegde et al. Citation2013). Box–Behnken is a three-level design widely used RSM model due to its higher application in terms of efficiency. Compared to other models Box–Behnken design avoids the highest and lowest combination run thereby avoiding extreme conditions. Also, it has high efficacy in the detection of deficiency in fit, estimation of the parameters and designing of the blocks (Ferreira et al. Citation2007).
In this research, silver-incorporated PVDF solution was electrospun for producing nanofibers on polypropylene (PP) non-woven sheets acting as a barrier to protect the nano fiber as well as used to develop a composite filter. The prepared filter was investigated for its bacterial efficiency through use of Gram-positive Staphylococcus aureus. The prepared anti-bacterial filter was used for application in hospitalized conditions to provide a healthy environment. The filter which can also be used in a face mask is both cost effective and environment friendly.
2. Materials and methods
2.1. Materials
Polyvinylidene fluoride (PVDF, MW = 35,000) and silver nitrate (MW 169.87 g/mol) were purchased from Sigma Aldrich, Bengaluru, India. The solvents chloroform and methanol (MW 119.38 g/mol and 32.04 g/mol) were purchased from SRL Chemicals, Chennai, India. Nutrient agar and broth were purchased from Sigma Aldrich, India. Escherichia coli (MTCC 1303) and S. aureus (MTCC 3750) were purchased from Microbial Type Culture Collection (MTCC), Chandigarh, India. All chemicals were used without any further processing.
2.2. Methods
2.2.1. Preparation of solution
AgNO3 (5,10,15 wt%) in percentages were dispersed in chloroform and methanol in the ratio of 2:1 for 2 h in an ultrasonicator. To the solution PVDF was added and dissolved to result in a homogenous solution. The resultant was further stirred for 24 h at room temperature to obtain a brown colored solution.
2.2.2. Electrospinning
2.2.2.1. Electrospinning principle
Electrospinning is a process in which the polymer solution is loaded in a syringe supported by a syringe carrier. The tip of the needle is connected with a high voltage power supply as shown in the . When the electric charge passes through the polymer solution in the syringe, the solution gets charged and coulomb repulsion forces causes the ions in the liquid to form a spherical shape due to surface tension with small surface area. If the surface tension overcomes the charged ions, Taylor cone formation occurs followed by the fluid jet ejection.
Schematic representation of electrospinning.
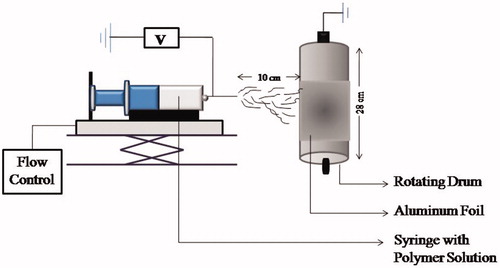
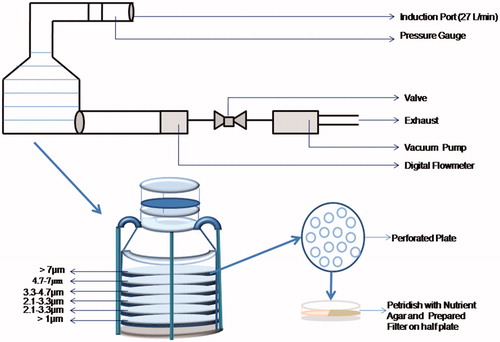
Figure 2. Schematic representation of Andersen sampler.
Three 2-mL syringes were loaded with the prepared homogenous solution and the syringes were placed in their respective slots such that the tip of the needle was in contact with the electrodes for high voltage power supply. A rotating drum collector was used for collecting the produced nanofibers. The drum was covered by aluminum foil above which a PP mesh was covered in order to act as a base layer for the collector fiber. The distance between the tip of the needle and collector was 10 cm, the applied voltage was 25 kV and the flow rate of the solution was 1 mL/h. The cross-sectional view of the prepared nanofibers was illustrated in Figure S1 (Online supplementary information [SI]).
2.2.3. Instrumental characterization
Scanning electron microscope (SEM Hitachi, S-5000) was used for the determination of the diameter of the fibers. Silver nitrate was characterized by UV-visible spectrometry (UV 2301 II) for determination of its concentrated peak. The functional groups were characterized by fourier transform infra red spectroscopy (FTIR). Sample pellets were prepared using KBr, placed on the holder for both PVDF and nanocomposites and scanned for the spectra from a range of 4000 to 400 cm−1. The prepared nanofibers were examined for thermal stability by a thermogravimetric analyzer (TGA Q50 V20.5). The experiment was performed under N2 atmosphere (40 mL/min). The operating temperature ranged from 20 to 800 °C with a heating rate of 20 °C/min. Surfaces of the prepared nanofibers were tested through atomic force microscopy (Model NC AFM 1.0.2). The samples were cut (approximately 1 cm2) and placed on a glass substrate. Surface images were scanned at a rate of 5 µm × 5 µm which were expressed in terms of mean roughness (Ra) and root mean square roughness (Rq).
2.2.4. Experimental design
RSM, typically the Box–Behnken design, was used due to its advantage of precision from the factor variables that are equidistant from the center point for optimizing the parameters. Three levels with three different variables used for this study resulted in 15 variable combinations and the process parameters included areal density, electrospinning time and concentration of silver nitrate (further information is available in the Table S1 (i) and (ii)).
2.2.5. Zone of inhibition
Zone of inhibition produced by the developed filter membrane was tested against E. coli and S. aureus. Initially, about 2.8 g of nutrient agar was dissolved in 100 mL of distilled water and autoclaved at 121 °C for 20 min and 15 lbs. Once sterilized, agar was poured in pre-sterilized petri dishes in a laminar flow hood and allowed to solidify. Escherichia coli and S. aureus pre-cultured from MTCC was then cultured through pour plate method. About 1 × 1 cm of the developed fibers was cut into four pieces and placed on the cultured plate which was incubated at 37 °C for 24 h for the growth cycle of the microorganism. The zone of inhibition formed was studied by the zone produced in between the membrane and culture.
2.2.6. Anti-bacterial activity
Anti-bacterial activity was tested for evaluation of the efficiency of the developed filter membrane. About 5 mL of sterilized nutrient broth was prepared. In order to test the anti-bacterial activity, control and test sample (pre-determined weight) were introduced in Luria Broth (LB) containing 1 × 10⁵ colonies per mL (CFU/mL) and incubated at 37 °C in an incubator for the colony growth. The number of colonies formed was counted at regular intervals of 7 h. The anti-bacterial activity for the given sample was determined using the following equation;
(1)
(1)
where, R is the reduction rate in percentage
A is the CFU/mL from the test sample
B is the CFU/mL from the control
2.2.7. Bacterial filtration efficiency
The bacterial filtration efficiency was tested using S. aureus as aerosol according to ASTM F 2101. The aerosol was taken in a nebulizer with a particle size of 3 µm and the flow rate was fixed at 27 L/min and pumped. The S. aureus samples were kept for 4 h at a temperature of 21 °C and humidity of 85% before testing was dissolved in 1.5% peptone water with yield level 2200 ± 500 CFU/mL. Andersen sampler was used to determine the bacteria filtration efficiency, the principle of an Andersen bioaerosol sampler is multistage inertial impaction consisting of six-staged perforated plate aerosol fractions ranging from 7 µm to <1 µm (). In order to study the effect of bacteria passing through the prepared sampler, a nutrient agar plate was covered with the prepared filter on one half and agar on the other half under each perforated plate, i.e. each stage of the sampler. This provides data on the culturable organisms (CO) and the culturable particulates (CP). CO would be deposited on the filter whereas CP will be deposited on the agar which can be counted through standard microbiological techniques. Thus, Andersen sampler provides advantage over polymerase chain reaction (PCR) as it provides information on active but non-culturable cells (ABNC) as well. Aerosol size distribution is calculated in terms of CO or CP. When calculating in terms of culturable particulates or organisms, number fraction is defined by;
(2)
(2)
where, Ni is the number of CP present in first stage; N is the number of CP present in all stages. The test was done for control without sample and with sample (PP spun bonded non-woven with PVDF). When the bacterial aerosol was passed through the sampler, the bacteria got imposed on the six stages of agar plates for 48 h at 37 °C, and the agar plates were incubated. All essentials such as nutrient agar, culture plates, BFE and equipment used were sterilized before initiation of the testing. The filtration efficiency was calculated by the difference in the control sample and the test sample.
(3)
(3)
where,
C is the CFU/mL of the control
T is the CFU/mL of the test sample
3. Results and discussion
3.1. SEM
The morphology of PVDF fibers with 5, 10, 15 wt% of silver nanoparticles are shown in Figures S2 (a) (b) (c) (d) (Further information is available in the SI). Table S2 (Further information is available in the SI) shows the average fiber diameter of pure PVDF as 286 nm. When silver nanoparticles were introduced in the base solution, a decrease in fiber diameter was seen with increase in addition of Ag which in turn increases the anti-bacterial property of the fibers respective to silver concentration. The increase in charge density in the base polymer contributed to its decrease in fiber diameter of the prepared solutions. The transportation of fiber under electric field had an impact on stretching and elongation during ejection which affects in fiber diameter reduction.
3.2. FTIR analysis
The FTIR spectra of pure PVDF and PVDF-Ag nanofibers are depicted in . The spectrum of PVDF peaks at 3019 and 2416 cm−1 corresponds to the CH2 asymmetric and symmetric vibrations of PVDF are seen in . The absorption peak at 1383 cm−1 is attributed to the PVDF wagging vibration. The C-C band was found at 1186 cm−1. Further absorption peaks at 880 and 841 cm−1 correspond to C-C-C and CF stretching vibration of PVDF (Hegde et al. Citation2013).
Figure 3. FTIR graph of (a) PVDF nanofibers and (b) PVDF + 15 wt% Ag nanofibers.
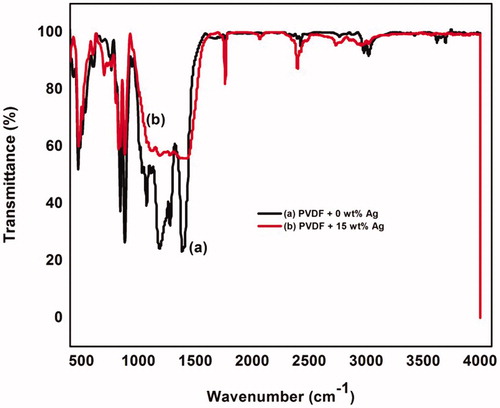
The chemical structure of the prepared nanocomposites membrane showed the characteristic absorption peaks of pure PVDF. For instance, the absorption peaks at 880 and 841 cm−1 correspond to C-C-C and CF stretching was retained. The occurrence of a new absorption peak at 1762 and 1420 cm−1 ideally corresponded to the addition of silver. A wide band from 1420 to 1000 cm−1 was also observed (Ferreira et al. Citation2007; Hegde et al. Citation2013).
3.3. UV-visible spectroscopy
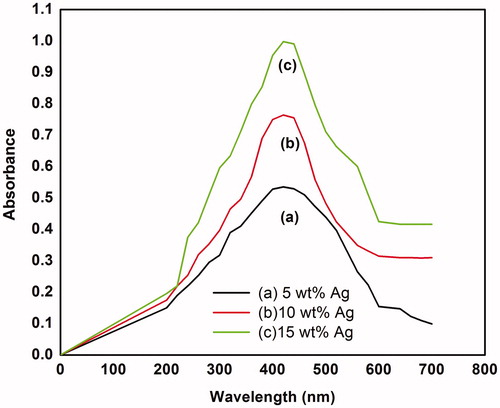
Structural characterization of the presence of silver is depicted in . The absorption peak was found to be maximum single banded at a wavelength of 420 nm with a steady increase in absorbance with respect to the concentration of silver without any shift in the peak. The increase in absorption is due to an increase in silver concentration which results in high anti-bacterial effect in the prepared sample. The surface plasma resonance of 15% Ag-PVDF contributed to maximum absorbance followed by 10% and 5% Ag-PVDF (Ferreira et al. Citation2007; Hegde et al. Citation2013; Jeong and Park Citation2014).
Figure 4. UV-visible spectroscopy of silver nanoparticles (a) 5 wt% Ag, (b) 10 wt% Ag, (c) 15 wt% Ag.
3.4. TGA
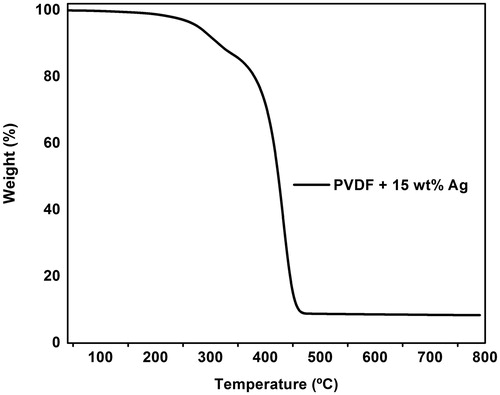
TGA of PVDF-Ag nanofibers is shown in . The inference from the thermogram is the stability of the nanofibers up to 250 °C. The first weight loss was observed at 263 °C with 96.22% of weight. Organic compounds are known to decompose at 280–400 °C; at 359 °C around 84% of weight was observed. The third weight loss was observed at 467 °C contributing to the thermal decomposition of PVDF main chain (Roy et al. Citation2013). Thus, it was observed that the major weight loss occurred at the temperature range of 260–480 °C. The study relates the thermal stability of the prepared fiber because during reprocessing heat treatment would be performed to ensure the ability for reuse.
Figure 5. TGA curve of PVDF + 15 wt% Ag nanofibers.
3.5. AFM
Variations occurred in the surface morphology of the PVDF + 0 wt% Ag. The nanofibers produced after modification with varying silver concentrations are depicted as three dimensional images in Figures S3 (a), (b) and (c) (Further information is available in the SI). The observation from the images shows that the PVDF + 0 wt% Ag nanofibers were smoothly interconnected ultrafine fibers arranged and shown as bright regions. On addition of silver nanoparticles to the PVDF, fibers produced exhibited a rougher surface as shown in Table S3 (Further information is available in the SI). Both Ra and Rq were higher for the nanofibers indicating a change in morphology through increased roughness on the successful addition of silver which results in high anti-bacterial effect (Mollahosseini et al. Citation2012).
3.6. Zone of inhibition
Pure PVDF and three varying silver concentrations of PVDF/Ag were tested for the zone of inhibition against E. coli and S. aureus. Pure PVDF was applied as the control for the test samples. The zone of inhibition produced by each strain after obtaining the average results from triplicate are presented in and to enable evaluation of the inhibition produced. Pure PVDF has minimum amount of anti-bacterial activity due to its inbuilt electrostatic property on both Gram positive and Gram negative bacteria. The bactericidal activity was found to increase with increase in silver nanoparticles concentration of the sample as seen in the and . The results were potential due to the anti-bacterial effect of silver.
Figure 6. Zone of inhibition produced by PVDF + 0 wt% Ag and PVDF + Ag nanofibers (5, 10, 15 wt%) against Gram positive and negative bacteria for 24 h.
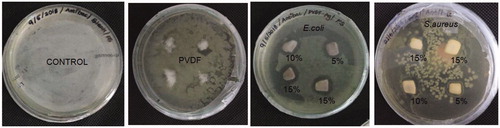
Table 1. Zone of inhibition produced by Gram positive and Gram negative bacteria.
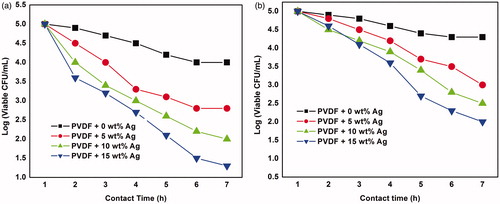
The anti-bacterial activity of pure PVDF and PVDF-Ag nanofibers of varying concentrations were studied with respect to the colony forming units at regular intervals within 7 h. Details are shown in . PVDF + 0 wt% Ag fibers produced minimal anti-bacterial activity in coloration with the zone of inhibition test. On the other hand, nanofibers with concentrations of silver added exhibited an increase in activity with respect to increase in concentration. Silver is known to bind with the negatively charged bacterial cell wall leading to structural modification which in turn, results in the degradation of the cell wall thus not allowing growth of bacteria. From the graph, it was noted that 15 wt% of silver showed maximum anti-bacterial activity in the respective time period (Roy et al. Citation2013; Jeong and Park Citation2014; Selvam and Nallathambi Citation2015).
Figure 7. (a) Anti-bacterial activities against E. coli (b) Anti-bacterial activities against Staphylococcus aureus.
3.7. Bacteria filtration efficiency test (BFE)
shows the bacterial efficiency analysis and the derivation of its regression equation. shows BFE having the influence of electrospinning time, concentration of silver (wt%) and PP non-woven sheet. Increase in bacterial filtration with increase in the areal density of PP non-woven sheets, electrospinning time and concentration of silver was seen. The difference in filtration efficiency with respect to individual factors is represented in , which shows the high impact of the concentration of silver (wt%) on filtration efficiency when compared to electrospinning time and areal density of PP non-woven sheet. shows the relationship between silver concentration and areal density of PP non-woven sheets. The efficiency of the filter increased with increase in concentration of silver with an areal density of PP non-woven sheets range between 50 and 70 GSM. The plot between silver concentration and time is depicted in shows 99% of efficiency was attained with a silver concentration of 5 wt% in 3 h whereas when the concentration was increased, the duration required to attain maximum efficiency decreased with respect to increase in silver concentration. shows the effect of BFE in electrospinning time and areal density. With increase in the concentration, the areal density of PP non-woven sheets was seen ranging from 50 to 70 GSM with respect to 3 h of electrospinning time to provide a maximum efficiency of 99.86%. shows the production of a higher efficiency by stat 12 due to high electrospinning time and high concentration of silver, whereas the PP non-woven sheets had no effect on increasing the efficiency of the filter as seen in the table from stat 17. On summary, it was shown that the efficiency of the filter mainly depends on the fiber matrix rather than the PP non-woven substrate.
Figure 8. Bacterial filtration efficiency versus aerosol particle size.
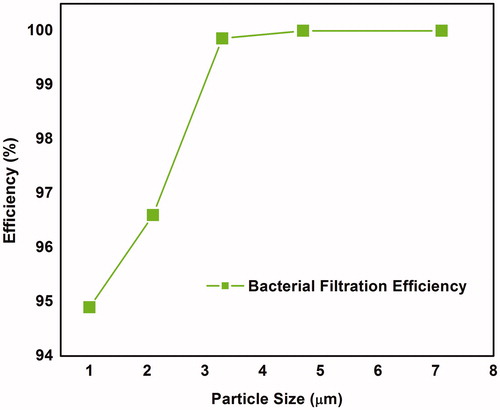
Figure 9. (a) Contour plot of efficiency with respect to silver concentration and areal density, (b) contour plot of efficiency with respect to silver concentration and time, (c) contour plot of efficiency with respect to time and areal density.
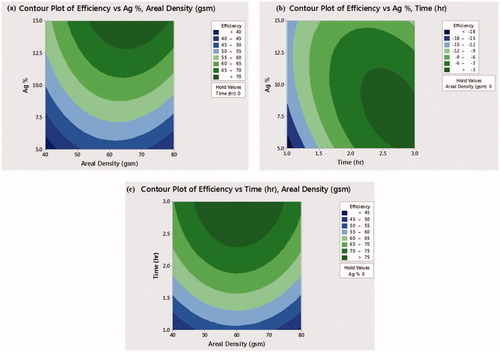
Table 2. Bacterial filtration efficiency produced through the experimental runs.
4. Conclusion
Samples were prepared according to Box–Behnken experimental design. PVDF-Ag was successfully electrospun to produce nanofibers. FTIR and UV-visible spectrophotometer confirmed the presence of Ag nanoparticles in the prepared nanofibers. The surface of the fibers was analyzed using SEM and AFM wherein the results from SEM indicated a decrease in the diameter of the fiber due to the presence of Ag when increase in silver concentration and in AFM the surface roughness of PVDF + 0 wt% Ag and PVDF-Ag showed a change in morphology with the addition of Ag was introduced. The use of process parameters in bacterial filtration efficiency was studied and the conclusion was the influence of areal density, electrospinning time and Ag wt %. The results point out to the achievement of 99.86% of bacterial filtration efficiency by areal density of 60 GSM, electrospinning time of 3 h and silver nanoparticle concentration of 15 wt%. PVDF is known to posses anti-bacterial activity to a minimal range. The present research shows that on addition of varying silver concentrations the anti-bacterial activity increased several orders against microorganisms. This research shows that the produced filter can be used for extensive application in clean air management. The prepared filter finds its application on protective clothing, dental masks, surgical respirator systems, biological safety cabinets and medical drape due to its anti-bacterial effect and durability. The prepared filter also finds its application in clean room filters and vacuum cleaners, etc.
Supplemental Material
Download MS Word (394.3 KB)Related Research Data
References
- Ahn, Y., J. Y. Lim, S. M. Hong, J. Lee, J. Ha, H. J. Choi, and Y. Seo. 2013. Enhanced piezoelectric properties of electrospun poly(vinylidene fluoride)/multiwalled carbon nanotube composites due to high β phase formation in poly (vinylidene fluoride). J. Phys. Chem. C 117 (22):11791–99. doi: 10.1021/jp4011026.
- Bai, H., X. Wang, Y. Zhou, and L. Zhang. 2012. Preparation and characterization of poly (vinylidene fluoride) composite membranes blended with nano-crystalline cellulose. Progr. Nat. Sci Mater. Int. 22 (3):250–7. doi: 10.1016/j.pnsc.2012.04.011.
- Ding, Y., P. Zhang, Z. Long, Y. Jiang, F. Xu, and W. Di. 2008. Preparation of PVdF-based electrospun membranes and their application as separators. Sci. Technol. Adv. Mater. 9 (1):015005. doi: 10.1088/1468-6996/9/1/015005.
- Ferreira, S. L. C., R. E. Bruns, H. S. Ferreira, G. D. Matos, J. M. David, G. C. Brandao, E. C. P. da Silva, L. A. Portugal, P. S. dos Reis, A. S. Souza, and W. N. L. dos Santos. 2007. Box-Behnken design: An alternative for the optimization of analytical methods. Anal. Chim. Acta. 597 (2):179–86. doi: 10.1016/j.aca.2007.07.011.
- Gonzalez, L. F., A. Joubert, Y. Andres, M. Liard, C. Renner, and L. Le Coq. 2016. Filtration performances of HVAC filters for PM10 and microbial aerosols – Influence of management in a lab-scale air handling unit. Aerosol Sci. Technol. 50 (6):555–67. doi: 10.1080/02786826.2016.1167833.
- Hegde, S., G. Bhadri, S. K. K.Narsapur, P. Oswal, V. J. N.Turmuri, and B. Hungund. 2013. Statistical optimization of medium components by response surface methodology for enhanced production of bacterial cellulose by gluconacetobacter persimmonis. Bioprocess. Biotech. 1 (4):1000142. doi: 10.4172/2155-9821.1000142.
- Issa, A. A., M. A. Al-Maadeed, A. S. Luyt, D. Ponnamma, and M. K. Hassan. 2017. Physico-mechanical, dielectric, and piezoelectric properties of PVDF electrospun mats containing silver nanoparticles. C J. Carbon Res. 3 (4):301–16. doi: 10.3390/c3040030.
- Jeong, L., and W. H. Park. 2014. Preparation and characterization of gelatin nanofibers containing silver nanoparticles. Int. J Mol. Sci. 15 (4):6857–79. doi: 10.3390/ijms15046857.
- Jones, B. L., and J. T. Cookson. 1983. Natural atmospheric microbial conditions in a typical suburban area. Appl. Environ. Microbiol. 45 (3):919–934.
- Kesavan, J. S., P. D. Humphreys, J. R. Bottiger, E. R. Valdes, V. K. Rastogi, and C. K. Knox. 2017. Deposition method, relative humidity, and surface property effects of bacterial spore reaerosolization via pulsed air jet. Aerosol Sci. Technol. 51 (9):1027–34. doi: 10.1080/02786826.2017.1335389.
- Li, G., L. Shen, Y. Luo, and S. Zhang. 2014. The effect of silver-PAMAM dendrimer nanocomposites on the performance of PVDF membranes. Desalination 338:115–20. doi: 10.1016/j.desal.2014.02.001.
- Le Ouay, B., and F. Stellacci. 2015. Review: Antibacterial activity of silvernanoparticles: A surface science insight. Nanotoday. 10 (3):339–54. doi: 10.1016/j.nantod.2015.04.002.
- Lubasova, D., A. Netravali, J. Parker, and B. Ingel. 2012. Paper presented at NANOCON, Brno, Czech Republic, EU, October 23–25.
- Metcalf, A. R., S. Narayan, and C. S. Dutcher. 2018. A review of microfluidic concepts and applications for atmospheric aerosol science. Aerosol Sci. Technol. 52 (3):310–29. doi: 10.1080/02786826.2017.1408952.
- Mohraz, M. H., F. Golbabaei, I. J. Yu, M. A. Mansournia, A. S. Zadeh, and S. F. Dehghan. 2018. Preparation and optimization of multifunctional electrospun polyurethane/chitosan nanofibers for air pollution control applications. Int. J. Environ. Sci. Technol. 1–14. doi: 10.1007/s13762-018-1649-3.
- Mollahosseini, A., A. Rahimpour, M. Jahamshahi, M. Peyravi, and M. Khavarpour. 2012. The effect of silver nanoparticle size on performance and antibacteriality of polysulfone ultrafiltration membrane. Desalination 306:41–50. doi: 10.1016/j.desal.2012.08.035.
- Roy, S., T. Mukherjee, S. Chakraborty, and T. K. Das. 2013. Biosynthesis, characterisation & antifungal activity of silver nanoparticles synthesized by the fungus Aspergillus foetidus Mtcc8876. Dig. J. Nanomater. Biostruct. 1 (8):197–205.
- Selvam, A. K., and G. Nallathambi. 2015. Polyacrylonitrile/silver nanoparticle electrospun nanocomposite matrix for bacterial filtration, fibres. Polymers 16 (6):1327–35. doi: 10.1007/s12221-015-1327-8.
- Sondi, I., and B. Salopek-Sondi. 2004. Silver nanoparticles as antimicrobial agent: A case study on E. coli as a model for gram-negative bacteria. J. Colloid Interface Sci. 275 (1):177–82. doi: 10.1016/j.jcis.2004.02.012.
- Tabe, S. 2014. Electrospun nanofiber membranes and their applications in water and wastewater treatment. In Nanotechnology for water treatment and purificatio, ed. A. Hu and A. Apblett, 111–143. 1st ed. Berlin: Springer. doi: 10.1007/978-3-319-06578-6.
- Wang, N., W. X. Wang, B. Ding, J. Yu, and G. Sun. 2012. Tunable fabrication of three-dimensional polyamide-66 nano-fiber/nets for high efficiency fine particulate filtration. J. Mater. Chem. 22 (4):1445–52. doi: 10.1039/C1JM14299B.