
 ?Mathematical formulae have been encoded as MathML and are displayed in this HTML version using MathJax in order to improve their display. Uncheck the box to turn MathJax off. This feature requires Javascript. Click on a formula to zoom.
Abstract
We estimate the multiple scattering correction factor (), which is an empirical constant required to correct aerosol absorption coefficient (
) measurements for the multiple scattering artifacts of aethalometer, using a multiplier derived from a linear regression method (
). Estimated
values during the Cheju ABC Plume Monsoon EXperiment (CAPMEX) are 3.99 (405 nm), 4.48 (532 nm), and 5.46 (781 nm) using aethalometer and 3-wavelength PhotoAcoustic Soot Spectrometer (PASS-3). The difference between these
values and those of a previous study (
) are ˗8.0% (405 nm), 20.1% (532 nm), and 30.2% (781 nm); the difference is greater at larger wavelengths because the linear regression line intercept is larger.
varies by up to 121% with increasing aerosol absorption coefficient (
) at 532 and 781 nm, whereas
varies by only 36.8%.
and
determined during CAPMEX were applied to year-round aethalometer
measurements (
and
, respectively) at Gosan (GSN), Lulin (LLN), and Alert (ALT) stations.
and
were compared to concurrent
measurements from Continuous Light Absorption Photometer (CLAP;
). At GSN, the bias difference and root mean square difference of
from
are ˗23.1 and 25.8%; however, those of
from
are ˗9.0 and 17.9%, respectively. LLN and ALT both exhibit a greater difference between
and
than between
and
. This suggests that
can be applied to year-round aethalometer measurements. Furthermore,
agrees better with
than
in all three environments.
Copyright © 2019 American Association for Aerosol Research
1. Introduction
Filter-based optical instruments, such as aethalometer (Hansen, Rosen, and Novakov Citation1984), particle soot absorption photometer (PSAP; Bond, Anderson, and Campbell Citation1999), and multi-angle absorption photometer (MAAP; Petzold and Schönlinner Citation2004), measure the change in light attenuation (ATN) across an aerosol-laden filter to retrieve the aerosol absorption coefficient (). Filter-based optical instruments have been widely used to measure
; however, they typically suffer from measurement artifacts. Specifically, the multiple scattering effect (MSE) is one of the largest sources of uncertainty in filter-based optical instruments (Bond, Anderson, and Campbell Citation1999; Petzold and Schönlinner Citation2004; Sheridan et al. Citation2005; Subramanian et al. Citation2007; Virkkula et al. Citation2007; Lack et al. Citation2008; Kondo et al. Citation2009; Moosmüller, Charkrabarty, and Arnott Citation2009; Müller et al. Citation2011; Di Biagio et al. Citation2017; Ogren et al. Citation2017). Many previous studies have suggested MSE correction methods for aethalometer by applying a multiple scattering correction factor (
). Weingartner et al. (Citation2003; hereafter, W03) suggested a
correction scheme that determined
based on
measured by aethalometer relative to that measured by a reference instrument. Arnott et al. (Citation2005; hereafter, A05) suggested subtracting a portion of related aerosol light scattering measurements to correct for particle scattering, based on experiments with laboratory-generated aerosols and ambient aerosols. Schmid et al. (Citation2006; hereafter, S06) modified the W03 scheme by adopting the single scattering albedo (SSA) to correct for the particle scattering artifact using ambient aerosols. Collaud Coen et al. (Citation2010; hereafter, C10) suggested a
correction scheme for ambient aerosols. Despite the various improvements made by many studies, the basis of
determination has not been changed substantially from W03. It is still necessary to reduce the effect of any measurement artifact induced during the
determination procedure because not only the aethalometer but also the reference instruments include their own measurement artifacts (Arnott et al. Citation1999, Citation2003; Petzold and Schönlinner Citation2004; Ajtai et al. Citation2010; Nakayama et al. Citation2015).
In this study, we propose a determination method and validate its effects on accompanying aerosol optical properties, including
, SSA, and the absorption Ångström exponent (AAE). Our determination method uses a linear regression line (LRL) method outlined in Section 3.1. Estimated
values are then validated by applying them to year-round continuous aethalometer measurements and comparing our values to simultaneous measurements from other filter-based optical instruments in Section 3.2.
2. Methodology
2.1. Measurements and stations
A summary of the measurement setup is shown in . Multi-year measurement data from Gosan (GSN; 33.29°N, 126.17°E, 72 m a.s.l.; maritime), Lulin (LLN; 23.47°N, 120.87°E, 2862 m a.s.l.; high altitude), and Alert (ALT; 82.49°N, 62.51°W, 190 m a.s.l.; Arctic) stations were analyzed. An identical measurement protocol (WMO Citation2016) was implemented at all three stations. A brief description of the location, environment and measurements is given in Schmeisser et al. (Citation2017) and Andrews et al. (Citation2018). From August to September, 2008, the Cheju ABC plume monsoon experiment (CAPMEX) field campaign was performed at GSN (Flowers et al. Citation2010; Ramana et al. Citation2010).
Table 1. Instrument setup for measurements during CAPMEX and at GSN, LLN, and ALT.
2.2. Instrumentation
2.2.1. Aethalometer
A 7-wavelength aethalometer (AE-31, Magee Scientific Corp., Berkeley, CA, USA) measures the change of ATN and reports it as an equivalent black carbon mass concentration (Mebc). During CAPMEX and at GSN, the aethalometer was operated without any imposed size cut, with a flow rate of 3.9 L min−1, using an extended-range spot size (1.67 cm2) and a temporal resolution of 5 min. At LLN, the aethalometer was operated with a flow rate of 4.0 L min−1, using a high-sensitivity spot size (0.5 cm2). At ALT, the aethalometer was operated with a flow rate of 3.9 L min−1, using a high-sensitivity spot size (0.5 cm2). Müller et al. (Citation2011) reported that the noise level is 0.8 Mm−1 within 470–880 nm over a 3-min average. Aethalometer values were retrieved using the W03 scheme in this study, which is discussed more in Section 2.3.
2.2.2. Photoacoustic soot spectrometer (PASS-3)
A 3-wavelength Photoacoustic soot spectrometer (PASS-3, Droplet Measurement Technologies Inc., Longmont, CO, USA) (Flowers et al. Citation2010) was operated to obtain at 1 L min−1 and a 10 min time-base during CAPMEX. Even though PASS-3 measurement precision can be influenced by factors such as acoustic noise and RH, PASS-3 was set as the reference instrument of CAPMEX in this study because it is free from filter-induced measurement artifacts (Arnott et al. Citation2000; Citation2003; Lack et al. Citation2008). The manufacturer reported that the detection limit of PASS-3 is 10, 10, and 3 Mm−1 (2 second-averaged) at 405, 532, and 781 nm, respectively (http://www.dropletmeasurement.com/photoacoustic-soot-spectrometer-three-wavelength-pass-3-0). Using Equation (S4) (Supplementary Information C), this corresponds to 0.58, 0.58, and 0.17 Mm−1 for 10-min averages at 405, 532, and 781 nm, respectively. Flowers et al. (Citation2010) provide a more detailed description of PASS-3 measurements during CAPMEX.
2.2.3. Continuous light absorption photometer (CLAP)
The continuous light absorption photometer (CLAP) is a mechanically and electronically improved version of PSAP; the LRL slope of CLAP (
) to PSAP
is 0.94 (standard deviation: 0.08) and the intercept is small (mean: 0.1) for three wavelengths (Ogren et al. Citation2017). CLAP is operated at GSN, LLN, and ALT with ∼1 L min−1 and 1-min time-based measurements.
was retrieved using corrections derived by Bond, Anderson, and Campbell (Citation1999) and Ogren (Citation2010).
CLAP cannot strictly be the reference instrument for a comparison of aethalometer because CLAP is another filter-based optical instrument. Nevertheless, CLAP was employed as the reference for comparison of multi-year measurements at GSN, LLN, and ALT because CLAP exhibits lower uncertainties than aethalometer for spot area size (aethalometer ∼8%, CLAP 2%), instrumental noise (aethalometer ∼0.42 Mm−1, CLAP ∼0.07 Mm−1), and unit-to-unit variability (aethalometer ∼20%, CLAP ∼4%) (Müller et al. Citation2011; Ogren et al. Citation2017). Ogren et al. (Citation2017) reported that the noise level of the CLAP attenuation coefficient (i.e., raw absorption coefficient without any correction) is approximately 0.2 Mm−1 for a 1-min average. Although simultaneous observations of CLAP and PASS are not available in this study, it is worth noting that
from PSAP and PASS were well matched (e.g., Lack et al. Citation2008). Aerosols were sampled by the CLAP with both a PM1 and PM10 size cut; however, PM1 data were not analyzed in this study because of the comparison with aethalometer, which have no imposed size cut.
2.3. Data processing and quality assurance
Measurement data were averaged to an hourly resolution for the comparison, then a standard temperature and pressure (STP; 0 °C and 1013.25 hPa) correction was applied. During CAPMEX, values with high nephelometer RH (> 70%) were excluded from the analysis to avoid hygroscopic effects of the measurement (Arnott et al. Citation2003; Kim et al. Citation2006; Fierz-Schmidhauser et al. Citation2010).
2.3.1. Retrieval of  from aethalometer measurement
EquationEquations (1)–(3) show the aethalometer retrieval scheme suggested by W03.
(1)
(1)
(2)
(2)
(3)
(3)
where ATN is the light attenuation by filter-deposited aerosols, and
are emitted and particle attenuated light intensity, respectively. Q,
and A are flow rate, time and spot size area, respectively.
is the attenuation coefficient, which is the raw aethalometer absorption coefficient without any correction applied, R(ATN) is the filter-loading correction, and
is the shadowing factor. i represent the ith data point. Supplementary Information (A) summarizes the notations used in this study (subscripts indicate the type of parameter; superscripts indicate the method or instrument used to retrieve the parameter). Although S06 and C10 schemes are improved versions of W03, C10 reported that the W03 scheme agrees well with reference instruments and does not modify the spectral characteristics of
for all aerosol types in a comparison among several existing schemes including W03, A05, and S06. Therefore, the W03 scheme, which has the simplest multiple scattering compensation, was selected to retrieve aethalometer
in this study.
2.3.2. Determination method of
is determined using EquationEquation (4)
(4)
(4) .
(4)
(4)
where
is
with the filter-loading effect corrected by dividing by R(ATN) and N represents the number of total data points.
is the
measured by the reference instrument (PASS-3 during CAPMEX; CLAP at GSN, LLN, and ALT).
is determined by dividing
by
, but partly corrected only for the filter-loading effect to extend the sample number. Moreover, the ratio between
and
can also be retrieved by the slope of the least-square LRL between the two measurements, assuming that they are linearly correlated (Wilkinson and Rogers Citation1973). Ideally, the LRL between
and
does not have an intercept; however, it is possible that the LRL intercept is non-zero and is large enough to have a non-negligible impact on the determination of
.
determined by the least-square linear regression method (
) is defined in EquationEquation (5)
(5)
(5) .
(5)
(5)
is the slope and
is the intercept, when the LRL equation between
and
is
. Assuming b is zero or negligible, EquationEquation (5)
(5)
(5) will be the same as EquationEquation (4)
(4)
(4) . Otherwise, the LRL method, which is forced through the origin, will produce equal results to those of EquationEquation (4)
(4)
(4) . Hence, b is the factor that induces the difference between
and
(see Supplementary Information B for more details).
3. Results and discussion
3.1. Determination of during CAPMEX
shows a comparison between and
during CAPMEX. The
determination results during CAPMEX are summarized in .
Figure 1. Comparison between and
during CAPMEX (dashed line (black) is the LRL; color scale indicates the occurrence).
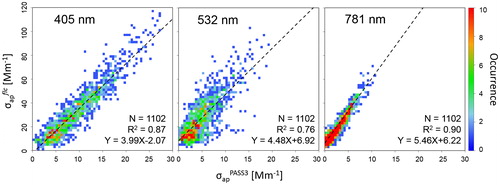
Table 2. Results of determination during CAPMEX.
It was observed that and PASS-3 (
) are linearly correlated with each other (R2 ∼ 0.76–0.90). The LRL between
and
is y = 3.99x–2.07 (405 nm), y = 4.48x + 6.92 (532 nm), and y = 5.46x + 6.22 (781 nm).
was determined using the slope (a) of the LRL (3.99, 4.48, and 5.46 at 405, 532, and 781 nm, respectively) and
was determined using EquationEquation (4)
(4)
(4) . The difference between
and
is statistically significant at all three wavelengths after considering that the difference is larger than the standard error of a (SEa; see Supplementary Information C). Likewise, b is statistically significant at all wavelengths considering the standard error of b (SEb). The percentage differences of
from
are –8.0 (405 nm), 20.1 (532 nm), and 30.2% (781 nm); they are relatively large at 532 and 781 nm because the LRL intercept is larger at 532 and 781 nm than at 405 nm. Considering EquationEquations (1)–(3), it can be inferred that the difference between
is propagated to
and that
is smaller than
by approximately –8% (405 nm), 21% (532 nm), and 25% (781 nm).
The box-whisker plot in shows and
values segmented by the 10th percentile interval of
. The maximum
values are 32.05 (405 nm), 18.92 (532 nm), and 11.19 Mm−1 (781 nm). At 405 nm, both
and
are relatively stable with increasing
percentile. In contrast, segmented
varies with increasing
percentile at 532 and 781 nm. The 0–10th percentile whisker plot of
reaches up to 19.8 (532 nm) and 26.2 (781 nm). shows the average segmented
value and its difference from the total
value (unsegmented). In the 0–10th percentile bin, the average
is larger than that of
by a factor of 0.71 (405 nm), 1.94 (532 nm), and 2.15 (781 nm). However, in the 90–100th percentile of
, the segment bin-averaged
is larger than that of
by a factor of 1.01 (405 nm), 0.91 (532 nm), and 0.92 (781 nm).
and
values become closer in the 90–100th percentile.
Figure 2. Box-whisker plot of (a) and (b)
segmented by percentiles of
(bottom and top whiskers represent the 5th and 95th percentiles; horizontal lines of the box represent the 25th, 50th, and 75th percentiles of
; dashed line (green) represents
; cross (red) represents the average value of each percentile of
; 0–10 on the x-axis represents the interval between the 0 and 10th percentile of
). Numbers in parentheses in x-axis are the range of
in each bin (unit in Mm−1).
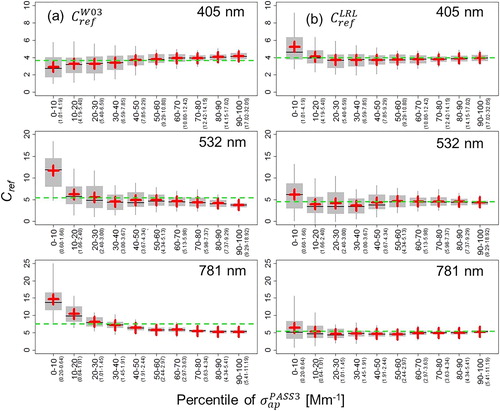
Table 3. -segmented
and their percentage difference from the unsegmented average of
during CAPMEX.
Notably, the percentage difference between segmented and total
varies by ±121.0% at all wavelengths; i.e. 13.1 (405 nm), –26.5 (532 nm), and –26.1% (781 nm) in the 90–100th percentile. The minimum percentage difference between segmented
and total
occurs in the 30–60th percentile. Conversely, the segmented average of
lies between ±36.8% at all wavelengths; i.e. 3.0 (405 nm), –2.9 (532 nm), and 4.2 (781 nm) in the 90–100th percentile. The minimum percentage difference of segmented
from total
occurs during the 90–100th percentile.
does not change with increasing
relative to
. This suggests that
produces less extreme values and is less affected by low signal-to-noise ratio (SNR).
and
are compared to values derived in previous studies in . Even though their measurement environment and wavelengths are not equal,
values from previous studies range from approximately 2–5.
can be separated into two groups by aerosol type: fresh soot (black) and ambient (coated/mixed) soot aerosols. Pure diesel soot and pure PALAS soot of W03 and kerosene soot of A05, which were laboratory-generated fresh soot aerosols, are relatively lower and their
values agree closely with other aerosol types with values of approximately 2, regardless of the reference instrument type. For ambient aerosols (including coated/mixed), unlike fresh aerosols,
exhibits increased values and a more dispersed distribution. This is likely because ambient aerosols consist of a more complex mixture of various aerosol species than fresh soot aerosols. Higher
values of approximately 2.8–5.4 were observed for ambient aerosols. Coating/mixing during the ambient aging procedure increases particle absorption efficiency, as well as the MSE, resulting in high
(Fuller, Malm, and Kreidenweis Citation1999; Lack et al. Citation2008; Gyawali et al. Citation2009; Knox et al. Citation2009; Cappa et al. Citation2012; Bond et al. Citation2013; Wang et al. Citation2014).
Figure 3. values from previous studies and those determined in this study (black:
using a filter-free instrument and laboratory-generated/fresh soot; blue:
using a filter-based optical instrument and ambient/coated aerosols; red:
using a filter-free instrument and ambient/coated aerosols).
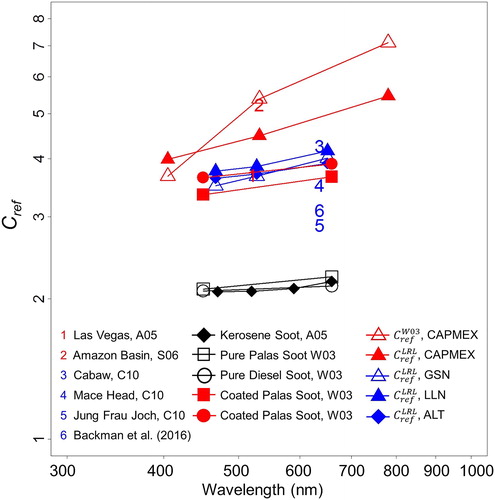
The of ambient aerosols can be divided into two groups according to the reference instrument type: filter-free reference instruments (red) and filter-based optical instruments (blue). The
of W03, A05, and S06 were determined using a filter-free reference instrument and are distributed around 3.7–5.4.
values during CAPMEX lie between the
values of A05 and S06. This is reasonable considering the type of reference instrument and the measurement environment.
during CAPMEX was determined using PASS-3 (A05: difference between extinction and scattering; S06: PhotoAcoustic Spectrometer, PAS) and the polluted maritime environment (A05: suburban; S06: remote area of Amazon basin).
values of C10 and Backman et al. (Citation2017) range from 2.8 to 4.1. Backman et al. (Citation2017) reported a
value of 3.1 using PSAP, CLAP, and MAAP at six Arctic stations. Saturno et al. (Citation2017) also reported
of 4.9–6.3 (637 nm) in Amazon region. In this study,
was determined by setting PASS-3 as the reference instrument (CAPMEX) and by setting CLAP as an arbitrary reference (GSN, LLN, ALT). As shown in the next section, the estimated
values (528 nm) using CLAP are 3.67 (GSN), 3.85 (LLN), and 3.71 (ALT). Even though the measurement periods do not correlate,
values during CAPMEX are higher than
values at GSN. Furthermore, they are lower than those determined using the reference instrument, including those measured during CAPMEX. These results also lie within the range of previous research results using a filter-based optical reference instrument. Many comparison studies have reported that the
of a filter-based optical instrument is larger than that of a filter-free instrument by a factor of 1.1–4.1 (Arnott et al. Citation2003; Virkkula et al. Citation2005; Torres et al. Citation2016). Specifically, liquid phase coating, organic aerosol fraction, organic gases, and their modification by filter media induce this difference (Subramanian et al. Citation2007; Lack et al. Citation2008; Lim et al. Citation2014; Shrestha et al. Citation2014; Vecchi et al. Citation2014). Therefore, it is likely that the organic (or liquid) portion of the aerosols increases the difference of
between filter-based optical and filter-free instruments. This difference is then propagated into the difference of
. It is likely that both the aerosol and instrument type affects the determination of
.
On the other hand, values generally increase with increasing wavelength. The Ångström exponent of
(–1.01) and
(–0.47) was much larger than those from previous works. The Ångström exponent for pure PALAS soot and pure diesel soot of W03 was estimated to be –0.06 and –0.18, respectively, whereas that for coated PALAS soot and coated diesel soot of W03 was –0.18 and –0.23, respectively. The laboratory-generated kerosene soot of A05 was estimated to be –0.15.
Finally, it is worth to noting that we did not find any significant change of with increasing ATN. Also, there was no special relationship among scattering coefficient, backscattering fraction, and
.
3.2. Validation of by application to year-round measurements
and
values determined during CAPMEX were applied to continuous aethalometer measurements at GSN, LLN, and ALT for the validation.
and
of PASS-3 wavelengths (405, 532, 781 nm) were adjusted to CLAP wavelengths using Ångström exponent interpolation. Adjusted
values are 4.24 (467 nm), 4.79 (528 nm), and 5.93 (652 nm). Adjusted
values are 4.27 (467 nm), 4.53 (528 nm), and 5.01 (652 nm). Retrieved
and
values were then compared to simultaneous
measurements of CLAP (
).
Period-averaged measurements of ,
, and
at GSN, LLN, and ALT are presented in , and the accompanying null hypothesis probability result of the student t-test is presented in Supplementary Information (D) . At GSN,
and
are smaller than
at all three wavelengths. The bias differences (BD) of
and
vary with increasing wavelength, from –0.3 to –1.2 Mm−1 and –0.3 to –0.4 Mm−1, respectively. However, considering the student t-test result, the difference of
and
from
at all three wavelengths are statistically significant (p-value >.05) except at 467 nm at ALT (because the
level and BD are small). BD of
is –3.2 (467 nm), –12.0 (532 nm), and –23.1% (652 nm) from
. BD of
is –3.9% (467 nm), –6.8% (532 nm), and –9.0% (652 nm) from
. The BD/RMSD ratio of
ranges from 0.19 to 0.90, but that of
ranges from 0.22 to 0.50. This shows that the difference between
and
is less than that between
and
at 528 and 652 nm. Moreover, at LLN and ALT, the comparison result is consistent in that the difference between
and
is less than that between
and
at 528 and 652 nm. It is suggested that
agrees better with
than
not only at GSN, but in all three environments. This result suggests that a more accurate estimation of
not only improves the accuracy of the light absorption parameter such as SSA, but also reduces the uncertainty of the estimation of the direct radiative forcing, especially atmospheric heating by light-absorbing aerosols.
Table 4. Results of the comparison between ,
, and
at GSN, LLN, and ALT.
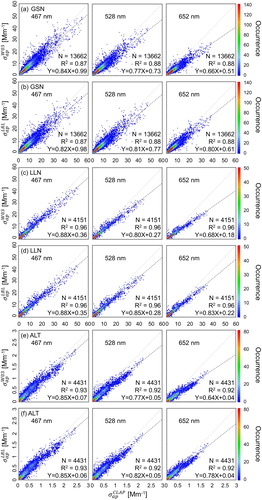
A linear regression of and
to
at GSN, LLN, and ALT is shown in , indicating a linear correlation (R2 ∼0.87-0.96). At GSN (), all LRL slopes are less than 0.84. LRL slopes between
and
depend on the wavelength (0.84 to 0.66); however, those between
and
remain relatively steady with varying wavelength (0.83 to 0.80) and lie closer to the 1:1 line. The ratio between
and
changes less with increasing wavelength than that between
and
. Moreover, the same trend is observed at LLN and ALT, in which the slope of
is steady relative to that of
.
Figure 4. Comparisons of aethalometer with
. (a)
and (b)
at GSN, (c)
and (d)
at LLN, and (e)
and (f)
at ALT (black and gray dashed lines are the LRL and 1:1 line, respectively; color scale represents the occurrence).
The frequency distribution of (=
) is shown in . At GSN, the peak of the
distribution ranges between -0.5 and 0 Mm−1 with increasing wavelength, whereas that of
remains at approximately 0 Mm−1. The period average of
(vertical dashed line) equals BD in . The frequency of the negative
value shows a greater increase with wavelength than that of
. Even though the
level is low, the trend is consistent at LLN and ALT in that the negative portion of the frequency distribution of
also increases with increasing wavelength ().
Figure 5. Frequency distributions of [= aethalometer
] at (a) GSN, (b) LLN, and (c) ALT. Solid lines indicate the distributions of
(
is black;
is red; vertical dashed line is the period average).
![Figure 5. Frequency distributions of Δσap [= aethalometer σap−σapCLAP] at (a) GSN, (b) LLN, and (c) ALT. Solid lines indicate the distributions of Δσap (σapW03 is black; σapLRL is red; vertical dashed line is the period average).](/cms/asset/c9c5d7f8-68f4-4de2-afa6-6fd16321192d/uast_a_1555368_f0005_c.jpg)
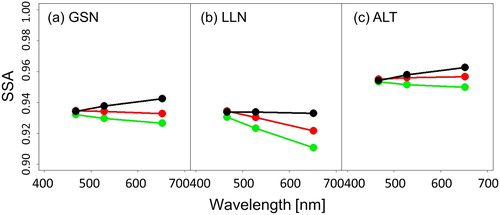
The SSA at each station using ,
, and
is shown in . Note that identical
values were used to calculate SSA at each site. At GSN, the difference of SSA between
and
is 0.22% (467 nm), 0.83% (528 nm), and 1.58% (652 nm). The difference of SSA between
and
is 0.28% (467 nm), 0.47% (528 nm), and 0.61% (652 nm). The SSA derived using
is closer to that using
in magnitude and in spectral dependency at 528 and 652 nm; this is also true at LLN and ALT. The difference of SSA between
and
is as much as ∼2.29% (652 nm) at LLN.
Figure 6. SSA retrieved at GSN, LLN, and ALT. SSA using ,
, and
are denoted as black, red, and green, respectively (
is identical at each station).
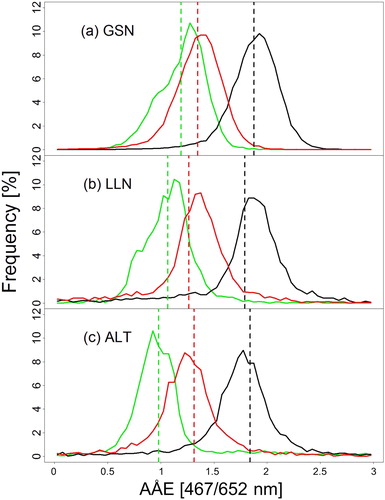
shows the AAE (467/652 nm) frequency distributions of ,
, and
at GSN, LLN, and ALT. At GSN, the AAE values of
,
, and
are 1.89 ± 0.35, 1.36 ± 0.35, and 1.20 ± 0.31 (). The difference of AAE values between
and
is 13.3%, while, that between
and
is 57.5%. This indicates that the spectral dependence of
(and
) agrees better with
than
(and
). The difference between AAE values of
and
propagates from
because the spectral dependence of
acts as a shift in AAE (Supplementary Information E). The AAE difference between
and
is also smaller than that between
and
at LLN and ALT ().
Figure 7. Frequency distributions of AÅE at (a) GSN, (b) LLN, and (c) ALT. Solid line is the distribution of (black/right),
(red/center), and
(green/left). Vertical dashed line is the average value.
Overall, (i.e., LRL method) adequately reproduces year-round aethalometer measurements and the accompanying aerosol optical properties (
, SSA, and AAE) are comparable to
.
agrees better with
than
for all three environments and aerosol types. Schmeisser et al. (Citation2017) compared aerosol characteristics from 24 global aerosol observation stations and classified the observed aerosol types ( and ). They also classified the environments of each station in this study as “marine polluted (GSN),” “other (LLN),” and “Arctic (ALT)” and aerosol types as “black carbon (BC) dominated (GSN),” “BC dominated (LLN),” and “small particles and low absorption (ALT),” respectively. The difference between
and
is greatest (∼23.1% at GSN) at 652 nm, and is propagated from b (LRL intercept induced by the measurement artifact) because b is large at longer wavelengths (532 and 781 nm) when
is determined during CAPMEX. It is also inferred that
is less affected by measurement artifacts at all locations and for all aerosol types than
.
4. Summary and conclusions
The multiple scattering correction factor () is one of the most uncertain parameters when retrieving the aerosol light absorption coefficient (
) from an aethalometer. In previous studies,
(
) was determined as the ratio between the aethalometer
(uncorrected raw
) and the reference instrument
. In this study,
(
) was determined using the linear regression line (LRL), which reduced the measurement artifact effect. The results of this study are summarized as follows.
In our procedure of determination, the LRL intercept (induced by measurement artifacts) can be sufficiently large to change
. Moreover, it is also possible that either aethalometer or other reference instrument have their own measurement artifacts. Thus, the measurement artifact effect on
determination can be reduced by applying
.
Supplemental Material
Download MS Word (41.1 KB)Acknowledgments
The authors are thankful to technicians and operators at Gosan, Lulin and Alert stations for maintenance and calibrations of instruments. We also acknowledge Canadian Forest Service for maintain the operations of the Alert station. The authors thank Dr. M. K. Dubey for providing PASS-3 data at Gosan during the CAPMEX campaign.
Disclosure statement
No potential conflict of interests was reported by the authors.
Additional information
Funding
References
- Ajtai, T., Á. Filep, M. Schnaiter, C. Linke, M. Vragel, B. Bozóki, G. Szabó, and T. Leisner. 2010. A novel multi-wavelength photoacoustic spectrometer for the measurement of the UV-vis-NIR spectral absorption coefficient of atmospheric aerosols. J. Aerosol Sci. 41 (11):1020–9.
- Andrews, E., P. J. Sheridan, J. A. Ogren, D. Hageman, A. Jefferson, J. Wendell, A. Alastuey, L. Alados-Arboledas, M. Bergin, M. Ealo, et al. 2018. Overview of the NOAA/ESRL federated aerosol network. Bull. Am. Meteorol. Soc. 10.1175/BAMS-D-17-0175.1.
- Arnott, W. P., H. Moosmüller, C. F. Rogers, T. Jin, and R. Bruch. 1999. Photoacoustic spectrometer for measuring light absorption by aerosol: Instrument description. Atmos. Environ. 33:2845–52.
- Arnott, W. P., H. Moosmüller, and J. Walker. 2000. Nitrogen dioxide and kerosene-flame soot calibration of photoacoustic instruments for measurement of light absorption by aerosols. Rev. Scient. Instrum. 7 (12):4545–52. doi: 10.1063/1.1322585.
- Arnott, W. P., H. Moosmüller, P. J. Sheridan, J. A. Ogren, R. Raspet, W. V. Slaton, J. L. Hand, S. M. Kreidenweis, and J. L. Collett. 2003. Photoacoustic and filter-based ambient aerosol light absorption measurements: Instrument comparisons and the role of relative humidity. J. Geophys. Res. 108 (D1). doi: 10.1029/2002JD002165.
- Arnott, W. P., K. Hamasha, H. Moosmüller, P. J. Sheridan, and J. A. Ogren. 2005. Towards aerosol light-absorption measurements with a 7-wavelength aethalometer: Evaluation with a photoacoustic instrument and 3-wavelength nephelometer. Aerosol Sci. Technol. 39 (1):17–29.
- Backman, J., L. Schmeisser, A. Virkkula, J. A. Ogren, E. Asmi, S. Starkweather, S. Sharma, K. Eleftheriadis, T. Uttal, A. Jefferson, et al. 2017. On aethalometer measurement uncertainties and multiple scattering enhancement in the arctic. Atmos. Measure. Tech. 10 (12):5039–62.
- Bond, T. C., T. L. Anderson, and D. Campbell. 1999. Calibration and intercomparison of filter-based measurements of visible light absorption by aerosols. Aerosol Sci. Technol. 30 (6):582–600.
- Bond, T. C., S. J. Doherty, D. W. Fahey, P. M. Forster, T. Berntsen, B. J. DeAngelo, M. G. Flanner, S. Ghan, B. Kärcher, D. Koch, et al. 2013. Bounding the role of black carbon in the climate system: A scientific assessment. J. Geophys. Res. 118:5380–552.
- Cappa, C. D., T. B. Onasch, P. Massoli, D. R. Worsnop, T. S. Bates, E. S. Cross, P. Davidovits, J. Hakala, K. L. Hayden, B. T. Jobson, et al. 2012. Radiative absorption enhancements due to the mixing state of atmospheric black carbon. Science 337 (6098):1078–81. doi: 10.1126/science.1223447.
- Collaud Coen, M., E. Weingartner, A. Apituley, D. Ceburnis, R. Fierz-Schmidhauser, H. Flentje, J. S. Henzing, S. G. Jennings, M. Moerman, A. Petzold, et al. 2010. Minimizing light absorption measurement artefacts of the aethalometer: Evaluation of five correction algorithms. Atmos. Measure. Tech. 3 (2):457–74.
- Di Biagio, C., P. Formenti, M. Cazaunau, E. Pangui, N. Marchand, and J. Doussin. 2017. Aethalometer multiple scattering correction Cref for mineral dust aerosols. Atmos. Measure. Tech. 10 (8):2923–39.
- Fierz-Schmidhauser, R., P. Zieger, G. Wehrle, A. Jefferson, J. A. Ogren, U. Baltensperger, and E. Weingartner. 2010. Measurement of relative humidity dependent light scattering of aerosols. Atmos. Measure. Tech. 3 (1):39–50.
- Flowers, B. A., M. K. Dubey, C. Mazzoleni, E. A. Stone, J. J. Schauer, S.-W. Kim, and S.-C. Yoon. 2010. Optical-chemical-microphysical relationships and closure studies for mixed carbonaceous aerosols observed at Jeju Island; 3-laserphotoacoustic spectrometer, particle sizing, and filter analysis. Atmos. Chem. Phys. 10 (21):10387–98. doi: 10.5194/acp-10-10387-2010.
- Fuller, K. A., W. C. Malm, and S. M. Kreidenweis. 1999. Effects of mixing on extinction by carbonaceous particles. J. Geophys. Res. Atmos. 104 (D13):15941–54. doi: 10.1029/1998JD100069.
- Gyawali, M., W. P. Arnott, K. Lewis, H. Moosmüller. 2009. In situ aerosol optics in reno, NV, USA during and after the summer 2008 California wildfires and the influence of absorbing and non-absorbing organic coatings on spectral light absorption. Atmos. Chem. Phys. 9 (20):8007–15.
- Hansen, A. D. A., H. Rosen, and T. Novakov. 1984. The aethalometer—An instrument for the real-time measurement of optical absorption by aerosol particles. Sci. Total Environ. 36:191–6.
- Kim, J., S.-C. Yoon, A. Jefferson, and S.-W. Kim. 2006. Aerosol hygroscopic properties during Asian dust, pollution, and biomass burning episodes at Gosan, Korea in April 2001. Atmos. Environ. 40 (8):1550–60.
- Knox, A., G. J. Evans, J. R. Brook, X. Yao, C.-H. Jeong, K. J. Godri, K. Sabaliauskas, and J. G. Slowik. 2009. Mass absorption cross-section of ambient black carbon aerosol in relation to chemical age. Aerosol Sci. Technol. 43 (6):522–32. doi: 10.1080/02786820902777207.
- Kondo, Y., L. Sahu, M. Kuwata, Y. Miyazaki, N. Takegawa, N. Moteki, J. Imaru, S. Han, T. Nakayama, N. T. K. Oanh, et al. 2009. Stabilization of the mass absorption cross section of black carbon for filter-based absorption photometry by the use of a heated inlet. Aerosol Sci. Technol. 43 (8):741–56.
- Lack, D. A., C. D. Cappa, D. S. Covert, T. Baynard, P. Massoli, B. Sierau, T. S. Bates, P. K. Quinn, E. R. Lovejoy, and A. R. Ravishankara. 2008. Bias in filter-based aerosol light absorption measurements due to organic aerosol loading: Evidence from ambient measurements. Aerosol Sci. Technol. 42 (12):1033–41.
- Lim, S., M. Lee, S.-W. Kim, S.-C. Yoon, G. Lee, and Y. J. Lee. 2014. Absorption and scattering properties of organic carbon versus sulfate dominant aerosols at Gosan climate observatory in northeast Asia. Atmos. Chem. Phys. 14 (15):7781–93. doi: 10.5194/acp-14-7781-2014.
- Moosmüller, H., R. K. Chakrabarty, and W. P. Arnott. 2009. Aerosol light absorption and its measurement: A review. J. Quantat. Spectrosc. Radiat. Transfer 110:844–78.
- Müller, T., J. S. Henzing, G. de Leeuw, A. Wiedensohler, A. Alastuey, H. Angelov, M. Bizjak, M. Collaud Coen, J. E. Engström, C. Gruening, et al. 2011. Characterization and intercomparison of aerosol absorption photometers: Result of two intercomparison workshops. Atmos. Measure. Tech. 4 (2):245–68. doi: 10.5194/amt-4-245-2011.
- Nakayama, T., H. Suzuki, S. Kagamitani, Y. Ikeda, A. Uchiyama, and Y. Matsumi. 2015. Characterization of a three wavelength photoacoustic soot spectrometer (PASS-3) and a photoacoustic extinctiometer (PAX). J. Meteorol. Soc. Japan 93 (2):285–308. doi: 10.2151/jmsj.2015-016.
- Ogren, J. A. 2010. Comment on “calibration and intercomparison of filter-based measurements of visible light absorption by aerosols”. Aerosol. Sci. Technol. 44:589–91. doi: 10.1080/02786826.2010.482111.
- Ogren, J. A., J. Wendell, E. Andrews, and P. J. Sheridan. 2017. Continuous light absorption photometer for long-term studies. Atmos. Measure. Tech. 10 (12):4805–18.
- Petzold, A., and M. Schönlinner. 2004. Multiple angle absorption photometry—A new method for the measurement of aerosol light absorption and atmospheric black carbon. J. Aerosol Sci. 35 (4):421–41.
- Ramana, M. V., V. Ramanathan, Y. Feng, S.-C. Yoon, S.-W. Kim, G. R. Carmichael, and J. J. Schauer. 2010. Warming influenced by the ratio of black carbon to sulphate and the black-carbon source. Nature Geosci. 3:542–5. doi: 10.1038/NGEO918.
- Saturno, J., C. Pöhlker, D. Massabò, J. Brito, S. Carbone, Y. Cheng, X. Chi, F. Ditas, I. Hrabě de Angelis, D. Morán-Zuloaga, et al. 2017. Comparison of different aethalometer correction schemes and a reference multi-wavelength absorption technique for ambient aerosol data. Atmos. Measure. Tech. 10 (8):2837–50. doi: 10.5194/amt-10-2837-2017.
- Schmeisser, L., E. Andrews, J. A. Ogren, P. J. Sheridan, A. Jefferson, S. Sharma, J. E. Kim, J. P. Sherman, M. Sorribas, I. Kalapov, et al. 2017. Classifying aerosol type using in situ surface spectral aerosol optical properties. Atmos. Chem. Phys. 17 (19):12097–120.
- Schmid, O., P. Artaxo, W. P. Arnott, D. Chand, L. V. Gatti, G. P. Frank, A. Hoffer, M. Schnaiter, and M. O. Andreae. 2006. Spectral light absorption by ambient aerosols influenced by biomass burning in the amazon basin. I: Comparison and field calibration of absorption measurement techniques. Atmos. Chem. Phys. 6 (11):3443–62.
- Sheridan, P. J., W. P. Arnott, J. A. Ogren, E. Andrews, D. B. Atkinson, D. S. Covert, H. Moosmüller, A. Petzold, B. Schmid, A. W. Strawa, et al. 2005. The reno aerosol optics study: An evaluation of aerosol absorption measurement methods. Aerosol Sci. Technol. 39 (1):1–16.
- Shrestha, R., S.-W. Kim, S.-C. Yoon, and J.-H. Kim. 2014. Attribution of aerosol light absorption to black carbon and volatile aerosols. Environ. Monit. Assess. 186 (8):4743–51. doi: 10.1007/s10661-014-3734-5.
- Subramanian, R., C. A. Roden, P. Boparai, and T. C. Bond. 2007. Yellow beads and missing particles: Trouble ahead for filter-based absorption measurements. Aerosol Sci. Technol. 41 (6):630–7. doi: 10.1080/02786820701344589.
- Torres, L. A., A. C. Aiken, M. Dubey, and A. Jefferson. 2016. Photo-acoustic and baseline filter absorption inter-comparison at SGP/ARM: Quantifying biases in long-term records. Poster presented at the 7th meeting of Atmospheric System Research Science Team Meeting, Tysons, Virginia, May 2.
- Vecchi, R., V. Bernardoni, C. Paganelli, and G. Valli. 2014. A filter-based light-absorption measurement with polar photometer: Effects of sampling artefacts from organic carbon. j. Aerosol Sci. 70:15–25.
- Virkkula, A., N. C. Ahlquist, D. S. Covert, W. P. Arnott, P. J. Sheridan, P. K. Quinn, and D. J. Coffman. 2005. Modification, calibration and a field test of an instrument for measuring light absorption by particles. Aerosol Sci. Technol. 39 (1):68–83. doi: 10.1080/027868290901963.
- Virkkula, A., T. MäKelä, R. Hillamo, T. Yli-Tuomi, A. Hirsikko, K. Hämeri, and I. K. Koponen. 2007. A simple procedure for correcting loading effects of aethalometer data. J. Air Waste Manage. Assoc. 57 (10):1214–22. doi: 10.3155/1047-3289.57.10.1214.
- Wang, Q., R.-J. Huang, J. Cao, Y. Han, G. Wang, G. Li, Y. Wang, W. Dai, R. Zhang, and Y. Zhou. 2014. Mixing state of black carbon aerosol in a heavily polluted urban area of China: Implications for light absorption enhancement. Aerosol Sci. Technol. 48 (7):689–97. doi: 10.1080/02786826.2014.917758.
- Weingartner, E., H. Saathoff, M. Schnaiter, N. Streit, B. Bitnar, and U. Baltensperger. 2003. Absorption of light by soot particles: Determination of the absorption coefficient by means of aethalometers. J. Aerosol Sci. 34 (10):1445–63.
- Wilkinson, G. N., and C. E. Rogers. 1973. Symbolic descriptions of factorial models for analysis of variance. Appl. Statist. 22 (3):392–99.
- World Meteorological Organization. 2016. WMO/GAW aerosol measurement procedures, guidelines and recommendations. WMO-No.1177 (GAW Report No. 227), World Meteorological Organization. ISBN 978-92-63-11177-7.