
 ?Mathematical formulae have been encoded as MathML and are displayed in this HTML version using MathJax in order to improve their display. Uncheck the box to turn MathJax off. This feature requires Javascript. Click on a formula to zoom.
Abstract
In vitro, direct aerosol nanoparticle exposure of cells cultured at the air-liquid interface (ALI) has shown great potential over the conventional submerged cell exposure methods due to exposure relevancy and more accurate dose determination. Here, we present a design of an ALI cell exposure device, the thermocollector, which applies thermophoresis to deposit aerosol particles onto the cells. Computational numerical simulations were used to estimate the deposition flux and how it depended on particle properties. The deposition flux was approximately 250 particles/m2s for particles smaller than 100 nm, corresponding to an aerosol concentration of 1 #/cm3. This was also confirmed with experimental studies. For larger particles, the deposition rate depended more on particle properties; however, for fractal combustion derived soot particles, the deposition rate is practically size independent at the size range studied here. Finally, epithelial cells were exposed with wood combustion aerosol, and the toxicologic responses were investigated. The cell viability decrease and DNA damage were detected after the exposure. These effects were not detected in cells after the exposure to clean air in this cell exposure system.
Copyright © 2019 American Association for Aerosol Research
EDITOR:
1. Introduction
Considerable public health consequences of air pollution and, especially, particulate matter (PM) and engineered nanoparticles (ENPs) have been widely documented. PM is considered to be one of the leading environmental risks for human health worldwide, having a vast economic significance and political concern. Concern has also arisen about the adverse health effects of ENPs, as their production and number of applications have recently increased (Oberdörster, Oberdörster, and Oberdörster Citation2005; Oberdörster, Stone, and Donaldson Citation2007; Gwinn and Vallyathan Citation2006). In addition, it has been estimated that in Europe the exposure for anthropogenic and biogenic fine particles decreases life expectancy by 6.5 months on average (Watkiss, Pye, and Holland Citation2005), whereas in China this decrease is up to 5.5 years (Chen et al. Citation2013). In both cases, inhalation is the major entrance pathway for the particles to enter human body (Kreyling, Hirn, and Schleh Citation2010; Maynard and Kuempel Citation2005); thus, lung cell responses due to exposure to fine and nanoparticles have been studied in vitro, ex vivo, and in vivo.
In vitro, conventional submerged cell exposure methods require a separate aerosol collection and extraction before the exposure. Moreover, during the exposure, the particle sample has to travel through a liquid layer before it can reach the cell (Paur et al. Citation2011). These steps affect the physical properties of the particles (e.g., by coagulation) and cause selection of chemical components, leading to potentially altered toxicologic responses as well as inaccurate dose determination (Teeguarden et al. 2006). These shortcomings are one reason for the recent development of novel in vitro exposure systems allowing direct nanoparticle exposure of cells cultured at the air-liquid interface (ALI). Another major advantage of the ALI exposure systems is that they allow more realistic exposure compared with the submerged methods. The cell exposure in the ALI system resembles the exposure conditions in the lungs, which are a major pathway for particles to enter the human body (Paur et al. Citation2011; Kreyling, Hirn, and Schleh Citation2010). Whereas, for airborne particles, the ALI exposure methods are more relevant to the in vivo situations than submerged methods. However, there are drawbacks attached to the relatively new ALI technology, such as high costs and low commercial availability (Lacroix et al. Citation2018).
Several in vitro ALI exposure systems have been recently developed. They differ from each other by their main deposition mechanisms, the geometry of introducing the aerosol sample to the vicinity of the cells, or whether a continuous aerosol flow or single batch method is used. Exposure methods based on diffusion and gravitation have been designed and used by several groups (Comouth et al. Citation2013; Tippe, Heinzmann, and Roth Citation2002; Mülhopt et al. Citation2016). In these methods, the deposition rate strongly depends on the particle size: diffusion dominates over the sub-100 nm particles and gravitation over the micron particles. The deposition of the particles of a few hundred of nanometers in size is the lowest, as none of these deposition mechanisms is efficient in that size range. While these methods are viable to deposit larger particles or to some extent diffuse very small particles, the deposition rates of nanoparticle aerosols are quite low for efficient screening studies, especially for low aerosol concentration samples (Paur et al. Citation2011). To overcome this, electric fields (DC or AC) have been established to substantially enforce the deposition rate (Aufderheide et al. Citation2011; de Bruijne et al. Citation2009; Saffari et al. Citation2012; Mertes et al. Citation2013; Jeannet et al. Citation2015, Citation2016; Savi et al. Citation2008). Bipolar Kr85 and unipolar corona chargers have been used for the particle charging, however, these methods include potential shortcomings such as a size dependent charging probability and ozone generation (Savi et al. Citation2008; de Bruijne et al. Citation2009). While there is also a concern that the cells, the particle uptake, or the toxicology involved are affected by the electrical charge of the particles (Schrade et al. Citation2012; Schaeublin et al. Citation2011), authors (Savi et al. Citation2008; Stevens et al. Citation2008; Jeannet et al. Citation2015; de Bruijne et al. Citation2009; Volckens et al. Citation2009) have not found the electrical field or the charges carried over to the cells to have a significant effect on the viability of the cells. Another approach to deposit particles onto the cells is the use of thermophoresis. An ALI exposure device based on parallel plate thermal precipitator was presented (Broßell et al. Citation2013), allowing almost size-independent deposition for less than several hundred nanometer particles. Whereas the previously described methods allow continuous aerosol flow, there are also one-shot devices such as the ALICE system, which combines cloud settling with single particle sedimentation as the deposition mechanism (Lenz et al. Citation2009).
In many of the continuous flow ALI exposure systems, the cells are located in a cup-like cell culture insert (Comouth et al. Citation2013; Savi et al. Citation2008; Jeannet et al. Citation2015; Grabinski, Hussain, and Mohan Sankaran Citation2015; Massey et al. Citation1998; Tippe, Heinzmann, and Roth Citation2002). In these systems, aerosol flow is directed into the insert with a tubing and then released just above the cultured cell surface area. A stagnation point over the cell area is generated and the flow diverts radially toward the outlet. This approach tends to produce inhomogeneous spatial deposition radially over the cell area for nanoparticles regardless of whether the deposition is diffusion- or inertia-driven (Comouth et al. Citation2013) or aided by electrical field (Jeannet et al. Citation2015). Savi et al. (Citation2008) addressed this problem and optimized their electric field to be homogeneous. They reported spatially uniform deposition except for the outermost 2 mm of the 13-mm radius cell surface area. However, the last annular 2 mm is 30% of the total circular cell area. Hsiao et al. (Citation2017) altered the design geometry by releasing the particles above the cell insert. They found out that the deposition was spatially uniform for 200 nm particles, however they reported that the spatial uniformity decreased with particle size. Stevens et al. (Citation2008) reported uniform deposition in the area of interest for 400-nm particles in their electrostatically driven deposition system. Authors have also reported continuous flow designs in which aerosol flow passes over or under the cultured cells instead of flowing perpendicularly toward the cells (Broßell et al. Citation2013; de Bruijne et al. Citation2009). However, no thorough deposition uniformity studies were conducted. Most of the ALI exposure systems are house-built devices, and only a few are commercially available (Lacroix et al. Citation2018).
There are several requirements that an ALI exposure device has to fulfill to become a viable option. First, the particle deposition on the cells should be predictable and uniform over the cell area. Then, the deposition rate of the particles of interest should be sufficiently high. Finally, the method itself or the conditions inside the device should not have adverse effects on the cells. While every system has its pros and cons, we recognized a need for an ALI exposure system that is spatially uniform, predictable, and preferably has size-independent deposition for submicron particles. We also wanted to exclude the use of electric fields, although to date no negative effects on cells have been found. Thus, we chose the approach used by Broßell et al. (Citation2013) and developed an ALI cell exposure system based on thermophoretic deposition. Computational fluid dynamics (CFD) and an analytical method were applied to estimate the deposition rates, and experimental studies were conducted to confirm these results. Experiments were also conducted to evaluate whether the conditions in the device affected the well-being of the cells. Finally, epithelial cells were exposed with wood combustion aerosol, and the toxicologic responses were investigated.
2. Methods
2.1. Design and operation
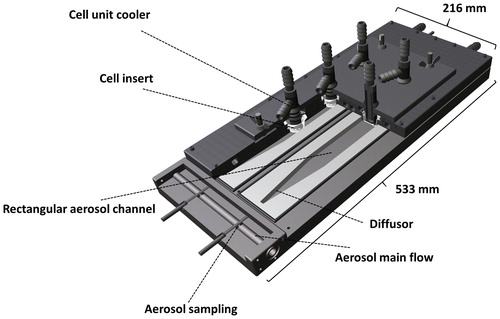
A thermophoretic sampler for cell exposure with the ALI method was designed. The basic operation principle in both devices is similar: thermophoresis is applied on humidified aerosol samples to produce aerosol particle flux on the cultured cell surface. The aerosol sample is first humidified by introducing it into a humidifier (Permapure PD) in which purified water is translocated into the aerosol sample through a membrane. The humidifier was heated with separate water circulation, which was shared in series with the lower part of the thermocollector heating. The water concentration was controlled by leading the aerosol flow rate through the humidifier, with target concentration equal to the water content in air at 37 °C and 100% relative humidity. Partial flow of the humidified aerosol sample was then introduced to the thermocollector’s aerosol inlet channel. The flow rate in aerosol channel was 0.15 lpm. At the aerosol channel inlet, an aerosol line of 4 mm inner diameter was converted to match the rectangular aerosol channel with a diffuser (). The function of the diffuser is to slow down the flow velocity and spread the flow evenly to the rectangular air channel so that the flow remains laminar and does not separate from the walls. This is important for the steady and homogenous flow and, therefore, for the deposition inside the device. The overall opening angle of the diffuser was set to 14°. A similar diffuser was also placed at the outlet. In the aerosol channel (length 254 mm; width 33 mm; height 2 mm) of the thermocollector, the aerosol experiences the thermophoretic force toward the colder upper surface due to the temperature gradient and begins to drift toward the upper surface. The temperature of the thermocollector was controlled with two separate water-cooling circulations. The lower section of the device was heated to 57 °C, and the upper section with cell temperature control was maintained close to 37 °C. The upper and lower plates were thermally isolated from each other to prevent unnecessary heat exchange that may distort the temperature gradient in the flow channels. The cells are located on the bottom of the membrane surface of the cell insert (), and this surface was aligned with the upper cold plate. Cooling probes were deployed to the culture medium to help maintain the temperature at the right level, which is important for cell viability and for a consistent temperature gradient below the cells. The thermocollector was mostly built from aluminum to ensure good heat conduction; however, the cooler units in contact with the cell culture medium were built from stainless steel to prevent chemical interaction with the culture medium and cells. Silver particle experiments in Section 2.2.2 were conducted with earlier version of the thermocollector which is similar to current design but with only one aerosol channel and one cell insert placement.
Figure 1. Design of ALI exposure device.
The device is operated by the following procedure. The device is allowed to heat to the desired temperature, after which pure humidified air is introduced to the aerosol main flow and aerosol channels until humidification has been stabilized to the desired level. During the placement of the cell inserts, the flow is diverted with valves from the aerosol main flow so that the upper plate may be lifted without affecting the flow. After the inserts are placed inside the device, the humidified flow with aerosols is returned to the aerosol main flow and aerosol channels and the exposure is under way.
2.2. Deposition
2.2.1. Deposition simulation
The deposition rate was solved with two different approaches: numerically using computational flow dynamics and analytically. The numerical method is described first.
The flow field and the particle tracking were simulated using CFD ANSYS Fluent 16.0 software. The simulations were performed in three dimensions for the flow between two plates. The diffuser was not considered here. The flow was modeled using the SST-k-ω-turbulence transfer model. Rectangular meshes consisting of approximately 560,000 computation cells were used and a boundary layer was created for the walls. The first cell height at the wall was set to satisfy non-dimensional wall coordinate y+ ∼1 requirement. A second order upstream scheme was used to discretize the flow equations. The boundary conditions consisted of fixed mass flow rate at the inlet boundary and pressure outlet at the outlet boundary. The particles were released from a plane 5 cm downstream of the inlet to ensure that the flow field was fully developed at the release point. For each particle size, 10 000 random release locations were used and the particles were tracked until they deposited onto the wall or escaped from the outlet. This allowed calculating the size dependent deposition flux. The initial velocity of the particles was defined the same as the fluid flow. Each particle’s contribution to the deposition was weighted with the initial velocity of the said particle. This takes into account the parabolic flow profile in the channel, that is, the flow rate is higher at the center of the channel than on the edge. Thermophoresis, gravitation, and the drag force were included in the solution. The fluent predicts the particle trajectory by integrating the force-per-unit-mass balance, that is, the acceleration of the particle of unit mass on the particle
(1)
(1)
where u is gas velocity, up is particle velocity, g is gravitation, ρ is gas density, ρp is particle bulk density, FD is the drag force per unit mass, and Fx is the thermophoretic force per unit mass. The drag force is defined as
(2)
(2)
where dp is particle size, ρp is particle density, and Cc is Cunningham correction.
The thermophoretic force on an aerosol particle in a temperature gradient is due to differential bombardment of the gas molecules. The molecules on the warmer side have higher kinetic energy than those on the colder side, resulting in a net force in the direction of decreasing temperature. The thermophoretic force depends strongly on the Knudsen number, and formulation depends on the Knudsen number range. In a free-molecular regime, the thermophoretic force has been shown to approach Waldmann’s limit (Waldmann and Schmitt Citation1966) as the Kn → infinity
(3)
(3)
where p is the pressure, λ is free mean path, dp is particle diameter, ∇T is temperature gradient far away from the particle, and T is the average gas temperature at the particle. In this paper, submicron particles are considered (Kn > 0.1) thus the regimes of interest are transitional and free-molecular. To include both of these regimes, the thermophoretic force may be written as proposed by Beresnev and Chernyak (Citation1995)
(4)
(4)
(5)
(5)
(6)
(6)
where
is the thermophoretic force in the free-molecular limit and
is the dimensionless thermophoretic force. The energy and momentum accommodation factors αE and αt take into account the way that colliding molecules are reflected by the particle. Here complete accommodation (αE = αt = 1) is presumed. In EquationEquation (6)
(6)
(6) , λg is the thermal conduction of the gas, λp is the thermal conduction of the particle, dp is the particle diameter, mm is the weight of the gas molecule, and
. The coefficients Φk are
(7)
(7)
where factors fij are given in the original paper (Beresnev and Chernyak Citation1995). The thermophoretic force expressed by Beresnev and Chernyak (Citation1995) is applied here, as it has shown (Sagot, Antonini, and Buron Citation2009; Prodi et al. Citation2007) to be more relevant model compared with the often used Talbot’s model (Talbot et al. Citation1980) or the model of Yamamoto and Ishihara (Citation1988). More recently, Young (Citation2011) applied G13 method to calculate the thermophoretic force at low Knudsen number (Kn < 0.2) and adapted an interpolation formula for the transition regime. Young (Citation2011) stated their adaptation provided a reasonable working compromise between the Yamamoto and Ishihara approach and Beresnev and Chernyak theory while biasing toward the Beresnev and Chernyak theory. They did not compare their model with the available experimental data. Rosner and Tandon (Citation2017) extended the theory by Young to involve aggregates. They numerically studied how the Knudsen number of the primary particle, among the other parameters, affected the thermophoretic diffusivity of the aggregate. Rosner and Tandon (Citation2017) suggested that the insensitivity of the dimensionless thermophoretic diffusivity of aggregates does not hold any more when the primary particle moves from free-molecule regime to transition regime.
The deposition rate may also be evaluated analytically because the particle flux toward the colder surface depends on the particle concentration c and the particle velocity vz toward the colder plate (Online supplementary Information (SI))
(8)
(8)
Here, the particle experiences thermophoretic and gravitational forces, which affect the particle at the opposite direction and yield
(9)
(9)
The effect of particle diffusion is not considered in these calculations. However, the estimated diffusion deposition velocity was compared with the deposition velocities arising from the thermophoresis and gravitation in SI. The diffusion velocity had only a minor contribution to the deposition for particles of 20 nm or larger.
2.2.2. Deposition experimental studies
2.2.2.1. Deposition
The deposition efficiency was measured with two experiments. In the first experiment, silver (Ag) nanoparticles were applied to find out how well the numerical model agrees with the experimental data. In this experiment, the upper surface of the aerosol channel in the thermocollector was covered with aluminum foil to enable offline study. A scanning electron microscope (SEM; Leo DSM982 Gemini, LEO Electron Microscopy Inc., Germany) was applied to visualize the aerosol particles and observe particle size distribution. The aerosol population was also measured online upstream of the thermocollector with a scanning mobility particle sizer (SMPS, model 3080, TSI Inc., Shoreview, MN, USA), which characterizes particles by their electrical mobility diameter and allows the measurement of number and size distribution of the aerosol population. The mass of the aerosol phase was measured with a tapered element oscillating microbalance (TEOM; Thermo Scientific, Waltham, MA, USA), which allows the comparison of the predicted mass deposition to the one estimated from the SEMs. Here, an aluminum tape was placed under the three cell inserts of the same aerosol channel. Zinc oxide (ZnO) particles were deposited using a 0.15 lpm aerosol flow rate and a 19.3 K temperature difference of the plates. SEM was applied to investigate the aerosol surface coverage of the aluminum foil at four different locations, at the center of each insert, and at the edge of the middle insert.
2.2.2.2. Ag particle generation
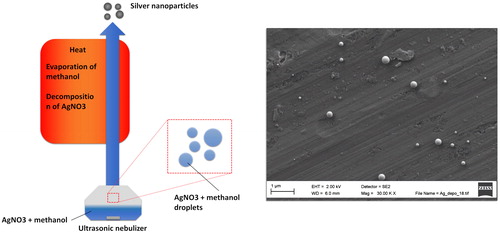
Spray pyrolysis was applied to generate Ag particles for the thermocollector deposition determination experiment (). A liquid solution of AgNO3 and methanol was used as a precursor material, which was atomized/sprayed with an ultrasonic nebulizer (Pyrosol 7901, RBI, France). The nebulized solution droplets were then carried with N2 flow to a hot wall reactor (800 °C), where the methanol evaporates and AgNO3 decomposes. The Ag in the given solution droplet then forms a solid particle, and the particle size depends on the amount of Ag in one solution droplet. The final solid particle size increases with AgNO3 concentration and solution droplet size. The N2 carrier gas flow rate was 1.7 lpm, which gives approximately 30 s of residence time in the reactor. Downstream from the reactor, the aerosol was diluted with a porous tube diluter to lower the temperature and prevent the condensation of the non-decomposed methanol. The dilution ratio applied was approximately 10.
Figure 2. Ag particle generation method and a micrograph of Ag particles measured with SEM.
2.2.2.3. ZnO particle generation
Zno particles were generated with physical/chemical vapor synthesis. The principle of ZnO production is presented in . First, solid Zn powder was evaporated to N2 carrier gas at a relatively high temperature. Then, the mixture of Zn vapor and N2 gas was diluted with air, lowering the mixture temperature and exposing Zn vapor to oxygen. Zinc reacts with oxygen producing ZnO, which has a much lower vapor pressure than elemental Zn. The decreased vapor pressure combined with the cooling of the mixture leads to particle formation through nucleation, condensation, coagulation, and agglomeration processes. The particle-air mixture was heated once again to ensure that the Zn particles were properly oxidized. The chemical composition of the produced particles were analyzed with X-ray diffraction (XRD; Bruker D8 Discover) from a filter sample, which was found to contain greater than 99% of ZnO.
Figure 3. (a) ZnO generation method and (b) typical size distributions with varying reactor temperature.
2.2.2.4. Wood combustion aerosol generation
Wood combustion aerosols were generated using a typical European logwood-fired chimney stove (Aduro 9-3) as the source. The stove was fired with beech logs, which were combusted in four consecutive, 2-kg batches. Each 1-hour cell exposure included combustion of one full batch from ignition to char-burning phase and an additional 15 to 20 min of a sequential batch. In “cold stove” measurements, the ignition of the first batch was carried out using wood sticks as kindling on top of the (logwood) batch. The burning time of the 1st batch was 45 min, after which the following batch was ignited by placing it on the glowing embers. In “hot stove” experiments, the sample included a full 3rd batch (40 min) and an additional 20 min of the 4th batch.
Flue gas stack under pressure was regulated to be in the range of 6 to 12 Pa. A partial sample of the aerosol was taken from the flue gas stack and diluted by a factor of 1:40 using a porous tube-ejector diluting sampling system (Venacontra, Finland). The diluted sample was supplied for ALI, while simultaneously the size and concentration of particulate phase was monitored with a scanning mobility particle sizer (SMPS, range 14.6–661.2 nm); alveolar deposition surface area with a nanoparticle surface area monitor (NSAM 3350); and total particulate mass with a TEOM. In addition, PM1 filter samples on polytetrafluoroethylene, (PTFE, Pall Corporation, P/N R2PJO47) and Quartz fiber (Pall corporation, Tissuequartz) filters were collected simultaneously with the ALI exposures. The PTFE filters were used for determining the total particulate mass by weighing filters before and after the collection in a microbalance (MT5, Mettler Toledo). Organic carbon and elemental carbon fractions of particles were analyzed with the quartz fiber filters, using the thermal-optical carbon analyzer (Sunlab) and following the protocol NIOSH5040 (Birch Citation1999). The CO2, NO, and NO2 were measured from the exposure aerosol using trace level single-gas analyzers. The properties of the wood combustion exhaust for each operation condition are shown in .
Table 1. Properties of diluted wood combustion exhaust used in each cell exposure experiment. For online measurements, averages, and standard deviations over the exposure periods are shown.
2.3. Cell exposure
The human alveolar epithelial cell line A549 (ATCC®, USA) was exposed to beech combustion emission in 2-day experiments. The cells were cultured in a humidified incubator at +37 °C and 5% CO2 in Dulbecco modified Eagle medium (DMEM) with 10% heat-inactivated fetal bovine serum (FBS) (Sigma), 2 mM L-glutamine, and 100 U/mL penicillin/streptomycin (all Sigma). A549 cells were seeded at 250,000 cells/mL in a six-well insert (Falcon) at the basolateral side and cultured for 4 to 5 days. Cells were allowed to form an ALI 48 h before exposure, and the medium was changed to medium containing 5% FBS. Twenty-four hours before exposure, the medium was changed to serum-free medium. Right before exposure, the medium was changed to serum-free medium with 25-µM N-2-hydroxyethylpiperazine-N-2-ethanesulfonic (HEPES) buffer (Sigma). Cell inserts were placed into the thermocollecter at six insert per beech combustion emission exposure, where exposure lasted for 1 h at 100% relative humidity in 150 mL/min exposure gas flow. Control cells were treated in an incubator with 5% CO2, +37 °C without CO2 or in the thermocollector with clean air in a similar manner as in exposure.
Cells were allowed to recover for 24 h after exposure in a humidified incubator at +37 °C and 5% CO2 with fresh serum-free medium. After the 24-hour recovery, the cells were washed with phosphate-buffered saline (PBS) and detached from the membrane by 5 min of trypsin treatment in an incubator at +37 °C and 5% CO2. Thereafter, FBS was added and cells were collected by rinsing the membrane with PBS with 10% FBS. Cells were centrifuged (1500 × g for 5 min at +4 °C, Heraeus megafuge 1.0R, Germany) and resuspended in PBS with 10% FBS. Collected cells were used in a toxicologic test for the formation of reactive oxygen species (ROS), vitality, and genotoxicity. ROS formation was analyzed using the fluorescent probe, 2´,7´-dichlorodihydrofluorescein diacetate (H2DCFDA; Molecular Probes). Vitality was tested using propidium iodium (PI) staining. The remaining cells were frozen at −80 °C for subsequent genotoxicity assay.
2.3.1. Toxicologic experiments
ROS: Induced amounts of ROS in exposed cells were measured using dichlorofluorescin (DCF) on three different time points; immediately after adding the DCF, and 30 and 60 min later after adding the H2DCFDA. Cells from the cell suspension were centrifuged (6081 × g, +4 °C, Heraeus Biofuge Fresco, Germany), and the pellet was resuspended in Hanks’ balanced salt solution (Sigma). Cells were transported to 96-well plate with 1 µM H2DCFDA, and zero-time point was measured at wavelengths of 492/530 nm with the multilabel plate reader (VICTOR3™ Multilabel Counter model 1420-051, PerkinElmer, USA). The measurement was repeated at 30- and 60-min time points. Between the measurements, the plate was kept at +37 °C with 5% CO2. Time points were normalized using vitality results and then used to calculate area under the curve (AUC). AUC was the parameter used in the statistical analysis.
Vitality: Cells from the ROS test were used in the vitality test. Immediately after the last DCF measurement, 50 µM of PI staining solution was added into the cells, and the proportion of dead cells was measured at wavelengths of 540/610 nm with the multilabel plate reader (VICTOR3™ Multilabel Counter model 1420-051, PerkinElmer). The test was continued by adding 10% Triton X-100, and the plate was incubated for 20 min in slight shaking at room temperature. The spectrophotometrical measurement was then repeated, and both measurements were used to calculate vitality.
DNA damage: Genotoxity was measured using a slightly modified alkaline version of the single-cell gel (SCG) comet assay that was used to detect DNA damage in the cells present in A549 cells (Jalava et al. Citation2010). The analysis was done on the ethidium bromide-stained slides (100 cells from each sample) that were analyzed using the comet assay IV software (perspective instruments ltd., Suffolk, UK). The comet response parameter used in the statistical analyses and presented figures was the olive tail moment (OTM) [(tail mean – head mean) × tail% dna/100].
3. Results and discussion
3.1. Deposition validation
3.1.1. Theoretical deposition
The deposition rates of particles were simulated using CFD and analytical formula (EquationEquation (8)(8)
(8) ). The results are shown in . Three cases of particles were considered here: spherical Ag particles, spherical soot particles, and soot particles with a fractal structure. The temperature gradient considered was 9500 K/m and the Knudsen number ranges from approximately 0.2 to 10. The fluxes of the Ag particles were solved using both the CFD and analytical methods, which showed very similar results. For Kn > 1 (sub-100 nm particles), the deposition velocity depended little on the particle size and was approximately 250 μm/s. This is equal to a particle flux of 250 #/m2s with 1 #/cm3 initial aerosol concentration. As the Knudsen number decreased (Kn < 1), the deposition efficiency decreased due to the weakening thermophoretic force and ever increasing effect of gravity. With spherical soot particles, the flux reduction for Kn < 1 particles was lower than for Ag particles, as both the lower particle density and the lower heat conductivity favor the flux based on thermophoresis in the current system. Rosner and Khalil (Citation2000) suggested that the poor effective heat conductivity of fractal agglomerates (fractal dimension 1.7) compared to heat conductivity of the bulk material allows the thermophoretic deposition rate to remain high and insensitive to Kn number even for larger particles (low Kn number). This insensitivity has also been experimentally observed for soot aggregates (Messerer, Niessner, and Pöschl Citation2003). Here, the ratio of heat conductivity
was set to unity for the fractal soot particles, as this was found to be a feasible value for combustion-derived particles (Messerer, Niessner, and Pöschl Citation2003; Brugière et al. Citation2014). The particle flux of soot aggregates (fractal dimension approximately 1.7) based on this assumption is shown in . It should be noted that Rosner and Tandon (Citation2017) showed numerically that these predictions fail if the Knudsen number of the primary particle (Kn1) approaches or exceeds unity. With these particle properties, the flux of the particles becomes insensitive to aggregate size in the particle range simulated here. The almost size-independent deposition rate further simplifies the estimation of the dose for aggregated particles.
Figure 4. Analytical and numerically simulated deposition velocities.
3.1.2. Deposition experiments
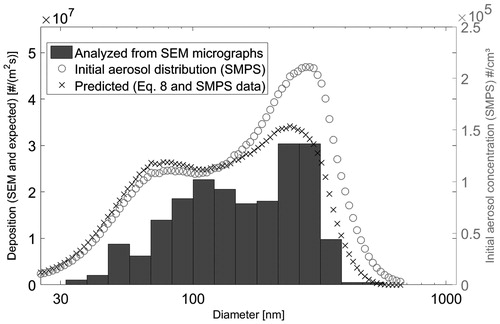
Ag and ZnO particles were used to investigate the deposition predictability and uniformity, respectively. In , SEM micrographs of Ag and ZnO particles deposited after the exposure are shown. Also, a transmission electron microscope (TEM) micrograph of a typical single ZnO particle is shown. The size distribution of the Ag particles found on the foil is compared with the one predicted with the theory from the initial size distribution measured with the SMPS (). The total concentration deposited on the foil was approximately 70% of the predicted concentration. The size distribution followed the predicted one quite well for particles larger than 100 nm. For smaller particles, however, not all the predicted particles were found on the foil. This may be due to the magnification of the SEM used to analyze the particles, as the particles approaching 50 nm are equal to only less than ten pixels on the micrograph. The magnification used here was, nevertheless, justified with the requirement of reasonable number of particles per micrograph to be analyzed. This issue also affected the geometric mean diameter (GMD) values of the deposited particle size distribution. The GMD of the Ag particles analyzed from the SEM micrographs was 148 nm while the predicted (SMPS and EquationEquation (8)(8)
(8) ) GMD was 132 nm. The GMD of the initial Ag aerosol size distribution was 152 nm (measured by SMPS).
Figure 5. Micrographs of (a) deposited Ag particles (SEM) at two magnifications, (b) typical ZnO particle (TEM) applied in this study, and (c) deposited ZnO particles (SEM).
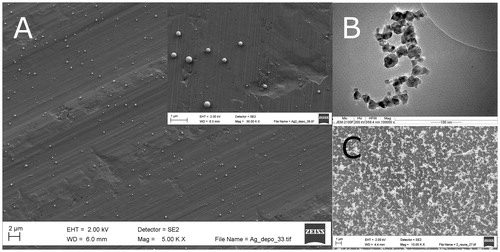
Figure 6. Ag particle population measured in aerosol phase (SMPS) and from aluminum foil (SEM). Approximately 350 Ag particles were analyzed from SEM micrographs to obtain the size histogram.
The mass of the particles collected on the foil was estimated by assuming spherical particle shape, which is a reasonable assumption, as seen in . This mass was then converted to mass concentration in the aerosol phase. The collected mass was approximately 65% of the mass measured with a TEOM. For Ag particles larger than 500 nm, the deposition rate was reduced to zero due to gravitation (), thus leaving these particles without deposition. However, these particles are still measured with the TEOM; and, even though their number is very low, their effect on the mass measured by the TEOM may be quite substantial.
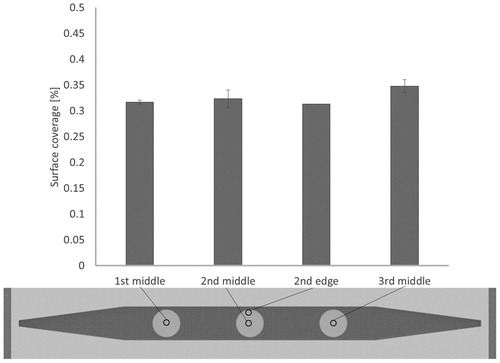
The uniformity of the deposition was studied with the second generation of the thermocollector. The deposition of four different locations was compared, and the results are shown in . The deposition coverage was very similar at each location, ranging from 31 to 33%. This finding showed that the deposition was uniform over the deposition area of interest.
Figure 7. Deposition uniformity study by counting the particle coverage from SEM micrographs at four different locations. At middle locations, three samples (nearby locations) were analyzed. At “2nd edge” location, the number of sample analyzed was one. The average values and their standard deviations are shown.
The deposition efficiencies have been reported by many authors describing the deposition performance of their ALI exposure devices (Jeannet et al. Citation2015). This is a plausible approach for cases where limited supply of particles are available, and it is essential to direct most of these particles on the cell surface as, on principle, the deposition efficiency describes the fraction of the available particles ending up on the cell surface area. However, the deposition efficiency has been defined differently depending on the author, and the comparison of these values is not straightforward. Here the deposition efficiency of the device is described as the deposition velocity (EquationEquation (8)(8)
(8) and ), as it illustrates the flux the particles deposit onto the cells when initial concentration is known. In cases where the aerosol supply is not rigorously limited, this kind of definition better serves to describe the performance of the ALI exposure device, as it instantly shows how long a sampling time or how high initial concentration is needed to obtain the desired exposure dose.
3.2. The dose
The dose of the wood combustion emission to the cells was calculated using aerosol phase measurement data (SMPS, TEOM, and NSAM) and EquationEquation 8(8)
(8) . The flux data from (
=1) were applied for the size resolved SMPS data to evaluate the particle number and mass dose. The mass dose was estimated by assuming that the particles followed size
dependent effective density
found for combustion particles (Leskinen et al. Citation2014)
(10)
(10)
The particle mass and surface area measured with a TEOM and NSAM, respectively, were not size resolved; thus, flux value 0.250 mm/s * c was applied. The doses for 1-hour exposures are presented in .
Table 2. Calculated cell exposure dose.
3.3. Cell exposure results
The thermocollector requires cells to be grown in the basolateral side of the insert membrane when depositing combustion particles onto cells. To confirm that the viability and cell response will neither differ nor alter when cells are grown in inserts at the basolateral side was tested by seeding the cells in opposite sides of the insert membrane and comparing outcomes of apical and basolateral sides. The testing showed that cells in the insert will behave in an identical manner when seeded on either side of the membrane (data not shown). Growing cells in the basolateral side allows the use of the thermocollector and the possibility of co-culturing different cell lines in both sides of the membrane in ALI. The thermocollector in cell exposure was tested by applying two combustion situations with beech in a cold and hot stove as the PM emission source for cytotoxic effects to A549 cells. The cells were exposed to combustion emissions for 1 h, and the outcomes indicating oxidative stress were measured after 24 h by DCF fluorescence measurement. No significant effect in DCF fluorescence compared with clean-air control was detected (data not shown). A minor decrease in cell viability of the same cells, measured by PI staining, was detected when compared with clean-air control (13%; ). Furthermore, the viability of cells exposed to emissions from the cold stove decreased 17% and those from the hot stove by up to 24%. However, a decrease in cell viability after the exposure to clean air and cold stove emissions can be considered to be in the range of normal variation of viability of cells in inserts. Instead, the cells exposed to hot stove emissions had noteworthy decreased viability.
Figure 8. Cell viability of A549 assessed with the PI exclusion assay after exposure of the cells in the thermocollector. Each bar represents the average of four samples with SEM.
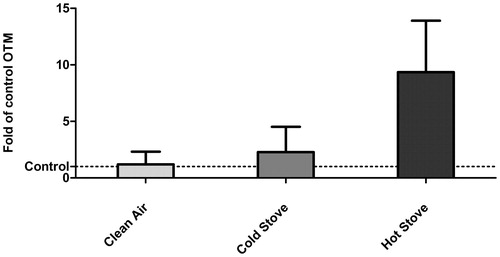
A similar result was seen in the genotoxicity, where olive tail moment (OTM) was measured using the comet test (). Combustion emissions induced a much higher genotoxic effect compared with the clean-air control cells. This is well in line with the results from ROS and cell viability analyses. An increase in DNA damages was seen after the exposure to beech combustion emission: exposure to cold stove emissions produces two times higher responses and hot stove emissions nine times higher amounts of OTM after the hot stove emissions when compared with control.
Figure 9. A549 cell DNA damage assessed with the Comet assay after exposure in the thermocollector. Each bar represents the average of two samples OTM fold difference of control mean with SEM.
4. Conclusions
The thermocollector method for ALI cell exposure studies was developed and validated. CFD and analytical methods were applied to help the design process of the thermocollector as well as for quantifying the deposition efficiency. These deposition results were validated experimentally with Ag and ZnO particles. The deposition efficiency of the current sampler is approximately 250 #/m2s, with a corresponding particle concentration of 1 #/cm3 and a particle size less than 100 nm. For larger particles, the deposition efficiency decreases due to decreasing thermophoretic force and increasing role of the gravity which, here, affects the opposite direction than the thermophoretic force. For fractal soot particles with lower effective heat conduction, the deposition rate remained practically size independent even up to the largest particle size considered here, 1 µm. The experimental results were coherent with those of numerically simulated results and were analytically calculated.
To quantify the deposited dose accurately, the aerosol size distribution of the desired parameter (e.g., number, area, or mass) should be measured and combined with the size-dependent deposition rate. For an accurate estimation of the deposition rates, the material and structural information of the aerosol particles are also required. However, for small particles (<100–200 nm) and for combustion-based fractal soot particles, the deposition rate is easy to derive and remains practically size independent.
To have an idea of the toxicologic effects on cells, a few parameters should be always measured from cells. These parameters are viability, ROS amounts, and genotoxicity. These parameters allow the formation of a basic picture of the cells well-being and reaction to exposure substance, being it combustion origin or engineered aerosol.
In toxicologic analysis, the developed thermocollector was sensitive and able to detect differences in induced toxicologic responses in the exposed cells. This was confirmed by the results showing that cell viability decreased and DNA damages were detected after the exposure to beech combustion emission from the cold or hot stove. Instead, these effects were not detected in cells after the exposure to clean air in this cell exposure system. The particle number and mass dose during a 1 h exposure ranged from approximately 5e5 to 1e6 #/mm2 and 1 to 3 ng/mm2, respectively.
Supplemental Material
Download MS Word (104 KB)Additional information
Funding
Related Research Data
References
- Aufderheide, M., S. Scheffler, N. Möhle, B. Halter, and D. Hochrainer. 2011. Analytical in vitro approach for studying cyto- and genotoxic effects of particulate airborne material. Anal. Bioanal. Chem. 401 (10):3213–20. doi: 10.1007/s00216-011-5163-4.
- Beresnev, S., and V. Chernyak. 1995. Thermophoresis of a spherical particle in a rarefied gas: Numerical analysis based on the model kinetic equations. Phys. Fluids 7 (7):1743–56. doi: 10.1063/1.868489.
- Birch, M. E. 1999. Elemental carbon (diesel particulate): Method 5040, issue 3 (interim). NIOSH Manual of Analytical Methods, DHHS (NIOSH) Publ. 94 113:1–9.
- Broßell, D., S. Tröller, N. Dziurowitz, S. Plitzko, G. Linsel, C. Asbach, N. Azong-Wara, H. Fissan, and A. Schmidt-Ott. 2013. A thermal precipitator for the deposition of airborne nanoparticles onto living cells—Rationale and development. J. Aerosol. Sci. 63:75–86. doi: 10.1016/j.jaerosci.2013.04.012.
- Brugière, E., F. Gensdarmes, F. X. Ouf, J. Yon, and A. Coppalle. 2014. Increase in thermophoretic velocity of carbon aggregates as a function of particle size. J. Aerosol. Sci. 76:87–97. doi: 10.1016/j.jaerosci.2014.06.007.
- Chen, Y., A. Ebenstein, M. Greenstone, and H. Li. 2013. Evidence on the impact of sustained exposure to air pollution on life expectancy from China’s Huai river policy. Proc. Natl. Acad. Sci. USA 110 (32):12936–41. doi: 10.1073/pnas.1300018110.
- Comouth, A., H. Saathoff, K.-H. Naumann, S. Muelhopt, H.-R. Paur, and T. Leisner. 2013. Modelling and measurement of particle deposition for cell exposure at the air–liquid interface. J. Aerosol. Sci. 63:103–114. doi: 10.1016/j.jaerosci.2013.04.009.
- de Bruijne, K., S. Ebersviller, K. G. Sexton, S. Lake, D. Leith, R. Goodman, J. Jetters, G. W. Walters, M. Doyle-Eisele, R. Woodside, et al. 2009. Design and testing of electrostatic aerosol in vitro exposure system (EAVES): An alternative exposure system for particles. Inhal. Toxicol. 21 (2):91–101. Taylor & Francis: doi: 10.1080/08958370802166035.
- Grabinski, C. M., S. M. Hussain, and R. Mohan Sankaran. 2015. Simulations of submicron aerosol deposition at an air–liquid interface for in vitro toxicology. J. Aerosol. Sci. 90:87–102. doi: 10.1016/j.jaerosci.2015.08.005.
- Gwinn, M. R., and V. Vallyathan. 2006. Nanoparticles: Health effects—pros and cons. Environ. Health Perspect. 114 (12):1818. doi: 10.1289/ehp.8871.
- Hsiao, T.-C., H.-C. Chuang, C.-W. Chen, T.-J. Cheng, and Y.-C. Chang Chien. 2017. Development and collection efficiency of an electrostatic precipitator for in-vitro toxicity studies of nano- and submicron-sized aerosols. J. Taiwan Inst. Chem. Eng. 72:1–9. doi: 10.1016/j.jtice.2017.01.003.
- Jalava, P. I., M. Tapanainen, K. Kuuspalo, A. Markkanen, P. Hakulinen, M. S. Happo, A. S. Pennanen, M. Ihalainen, P. Yli-Pirilä, U. Makkonen, et al. 2010. Toxicological effects of emission particles from fossil- and biodiesel-fueled diesel engine with and without DOC/POC catalytic converter. Inhalation Toxicology 22 (sup2):48–58. doi: 10.3109/08958378.2010.519009.
- Jeannet, N., M. Fierz, M. Kalberer, H. Burtscher, and M. Geiser. 2015. Nano aerosol chamber for in-vitro toxicity (NACIVT) studies. Nanotoxicology 9 (1):34–42. doi: 10.3109/17435390.2014.886739.
- Jeannet, N., M. Fierz, S. Schneider, L. Künzi, N. Baumlin, M. Salathe, H. Burtscher, and M. Geiser. 2016 Acute toxicity of silver and carbon nanoaerosols to normal and cystic fibrosis human bronchial epithelial cells. Nanotoxicology 10 (3):279–291. doi: 10.3109/17435390.2015.1049233.
- Kreyling, W. G., S. Hirn, and C. Schleh. 2010. Nanoparticles in the lung. Nat. Biotechnol. 28 (12):1275–76. doi:10.1038/nbt.1735.
- Lacroix, G., W. Koch, D. Ritter, A. C. Gutleb, S. T. Larsen, T. Loret, F. Zanetti, S. Constant, S. Chortarea, B. Rothen-Rutishauser, et al. 2018. Air–liquid interface in vitro models for respiratory toxicology research: Consensus workshop and recommendations. Applied in vitro toxicology. 4 (2):91–106.
- Lenz, A. G., E. Karg, B. Lentner, V. Dittrich, C. Brandenberger, B. Rothen-Rutishauser, H. Schulz, G. A. Ferron, and O. Schmid. 2009. A dose-controlled system for air-liquid interface cell exposure and application to zinc oxide nanoparticles. Part. Fibre Toxicol. 6 (1):32. doi: 10.1186/1743-8977-6-32.
- Leskinen, J., M. Ihalainen, T. Torvela, M. Kortelainen, H. Lamberg, P. Tiitta, G. Jakobi, J. Grigonyte, J. Joutsensaari, O. Sippula, et al. 2014. Effective density and morphology of particles emitted from small-scale combustion of various wood fuels. Environ. Sci. Technol. 48 (22):13298–306. ACS Publications: doi: 10.1021/es502214a.
- Massey, E., M. Aufderheide, W. Koch, H. Lodding, G. Pohlmann, H. Windt, P. Jarck, and J. W. Knebe. 1998. Micronucleus induction in V79 cells after direct exposure to whole cigarette smoke. Mutagenesis 13 (2):145–49. doi: 10.1093/mutage/13.2.145.
- Maynard, A. D., and E. D. Kuempel. 2005. Airborne nanostructured particles and occupational health. J. Nanopart. Res. 7 (6):587–614. doi: 10.1007/s11051-005-6770-9.
- Mertes, P., A. P. Praplan, L. Künzi, J. Dommen, U. Baltensperger, M. Geiser, E. Weingartner, J. Ricka, M. Fierz, and M. Kalberer. 2013. A compact and portable deposition chamber to study nanoparticles in air-exposed tissue. J. Aerosol. Med. Pulm. Drug Deliv. 26 (4):228–35. doi: 10.1089/jamp.2012.0985.
- Messerer, A., R. Niessner, and U. Pöschl. 2003. Thermophoretic deposition of soot aerosol particles under experimental conditions relevant for modern diesel engine exhaust gas systems. J. Aerosol. Sci. 34 (8):1009–21. doi: 10.1016/S0021-8502(03)00081-8.
- Mülhopt, S., M. Dilger, S. Diabaté, C. Schlager, T. Krebs, R. Zimmermann, J. Buters, S. Oeder, T. Wäscher, C. Weiss, et al. 2016. Toxicity testing of combustion aerosols at the air–liquid interface with a self-contained and easy-to-use exposure system. J. Aerosol. Sci. 96:38–55. doi: 10.1016/j.jaerosci.2016.02.005.
- Oberdörster, G., E. Oberdörster, and J. Oberdörster. 2005. Nanotoxicology: An emerging discipline evolving from studies of ultrafine particles. Environ. Health Perspect. 113 (7):823. doi: 10.1289/ehp.7339.
- Oberdörster, G., V. Stone, and K. Donaldson. 2007. Toxicology of nanoparticles: A historical perspective. Nanotoxicology 1 (1):2–25. doi: 10.1080/17435390701314761.
- Paur, H.-R., F. R. Cassee, J. Teeguarden, H. Fissan, S. Diabate, M. Aufderheide, W. G. Kreyling, O. Hänninen, G. Kasper, M. Riediker, et al. 2011. In-vitro cell exposure studies for the assessment of nanoparticle toxicity in the lung—A dialog between aerosol science and biology. J. Aerosol. Sci. 42 (10):668–92. doi: 10.1016/j.jaerosci.2011.06.005.
- Prodi, F., G. Santachiara, L. Di Matteo, A. Vedernikov, S. A. Beresnev, and V. G. Chernyak. 2007. Measurements of thermophoretic velocities of aerosol particles in microgravity conditions in different carrier gases. J. Aerosol. Sci. 38 (6):645–55. doi: 10.1016/j.jaerosci.2007.04.002.
- Rosner, D. E., and Y. F. Khalil. 2000. Morphology-and Knudsen transition-effects on thermophoretically dominated total mass deposition rates from “coagulation-aged” aerosol population. J. Aerosol. Sci. 31 (3):273–92. doi: 10.1016/S0021-8502(99)00054-3.
- Rosner, D. E., and P. Tandon. 2017. Knudsen transition effects on the thermophoretic properties of fractal-like aggregates: Implications for thermophoretic sampling of high-pressure flames. Aerosol. Sci. Technol. 51 (11):1262–74. Taylor & Francis: doi: 10.1080/02786826.2017.1353061.
- Saffari, H., A. Malugin, H. Ghandehari, and L. F. Pease. 2012. Electrostatic deposition of nanoparticles into live cell culture using an electrospray differential mobility analyzer (ES-DMA). J. Aerosol. Sci. 48:56–62. doi: 10.1016/j.jaerosci.2012.01.004.
- Sagot, B., G. Antonini, and F. Buron. 2009. Annular flow configuration with high deposition efficiency for the experimental determination of thermophoretic diffusion coefficients. J. Aerosol. Sci. 40 (12):1030–49. doi: 10.1016/j.jaerosci.2009.09.009.
- Savi, M., M. Kalberer, D. Lang, M. Ryser, M. Fierz, A. Gaschen, J. Ricka, and M. Geiser. 2008. A novel exposure system for the efficient and controlled deposition of aerosol particles onto cell cultures. Environ. Sci. Technol. 42 (15):5667–74. doi: 10.1021/es703075q.
- Schaeublin, N. M., L. K. Braydich-Stolle, A. M. Schrand, J. M. Miller, J. Hutchison, J. J. Schlager, and S. M. Hussain. 2011. Surface charge of gold nanoparticles mediates mechanism of toxicity. Nanoscale 3 (2):410–20. doi: 10.1039/c0nr00478b.
- Schrade, A., V. Mailänder, S. Ritz, K. Landfester, and U. Ziener. 2012. Surface roughness and charge influence the uptake of nanoparticles: Fluorescently labeled pickering-type versus surfactant-stabilized nanoparticles. Macromol. Biosci. 12 (11):1459–71. doi: 10.1002/mabi.201200166.
- Stevens, J. P., J. Zahardis, M. MacPherson, B. T. Mossman, and G. A. Petrucci. 2008. A new method for quantifiable and controlled dosage of particulate matter for in vitro studies: The electrostatic particulate dosage and exposure system (EPDExS). Toxicol. Vitro 22 (7):1768–74. doi: 10.1016/j.tiv.2008.05.013.
- Talbot, L., R. K. Cheng, R. W. Schefer, and D. R. Willis. 1980. Thermophoresis of particles in a heated boundary layer. J. Fluid Mech. 101 (04):737–58. doi: 10.1017/S0022112080001905.
- Teeguarden, J. G., P. M. Hinderliter, G. Orr, B. D. Thrall, and J. G. Pounds. 2007. Particokinetics in vitro: Dosimetry considerations for in vitro nanoparticle toxicity assessments. Toxicol. Sci. 95 (2):300–12. Oxford University Press. doi: 10.1093/toxsci/kfl165.
- Tippe, A., U. Heinzmann, and C. Roth. 2002. Deposition of fine and ultrafine aerosol particles during exposure at the air/cell interface. J. Aerosol. Sci. 33 (2):207–18. doi: 10.1016/S0021-8502(01)00158-6.
- Volckens, J., L. Dailey, G. Walters, and R. B. Devlin. 2009. Direct particle-to-cell deposition of coarse ambient particulate matter increases the production of inflammatory mediators from cultured human airway epithelial cells. Environ. Sci. Technol. 43 (12):4595–99. doi: 10.1021/es900698a.
- Waldmann, L., and K. H. Schmitt. 1966. Thermophoresis and diffusiophoresis of aerosols. In Aerosol science, 137–62. New York, NY: Academic Press.
- Watkiss, P., S. Pye, and M. Holland. 2005. CAFE CBA: Baseline analysis 2000 to 2020. Report AEAT/ED51014/Baseline Issue 5, AEA Technology Environment, Oxon, UK.
- Yamamoto, K., and Y. Ishihara. 1988. Thermophoresis of a spherical particle in a rarefied gas of a transition regime. Phys. Fluids 31 (12):3618–24. doi: 10.1063/1.866878.
- Young, J. B. 2011. Thermophoresis of a spherical particle: Reassessment, clarification, and new analysis. Aerosol. Sci. Technol. 45 (8):927–48. doi: 10.1080/02786826.2011.569777.