
 ?Mathematical formulae have been encoded as MathML and are displayed in this HTML version using MathJax in order to improve their display. Uncheck the box to turn MathJax off. This feature requires Javascript. Click on a formula to zoom.
Abstract
Highly charged macromolecular ions exhibit various conformations in gas. Intramolecular charge-to-charge interaction induces a transformation from a globular structure into a stretched one. The change in the molecular conformation brings a complex dynamic behavior of ions under an electrostatic field. In the present study, we visualized the movement of a monovalent and multiply charged straight chain macromolecules, polyethylene glycol (PEG), by a molecular dynamics (MD) simulation. The simulation showed that a singly charged PEG ion (899 < MW < 4,643) takes a globular conformation. The electrical mobilities of these ions determined from the migration distance under an electric field were compared with the experimental data and those determined by the classical Mason–Schamp theory under an assumption of spherical shape. As a result, we obtained a good agreement between the MD, theoretical, and experimental data for the monovalent ions. We also found that the MD simulation successfully predicts the electrical mobility of the multiply charged stretched PEG ions, but the classical theory fails. We were able to visualize the periodic bending and stretching motion by the MD simulation. This unique motion results from the localization of charges on the PEG molecule and may have a significant effect on the dynamic behavior of macromolecule ions in gas.
Copyright © 2019 American Association for Aerosol Research
1. Introduction
When airborne ions are placed in an electrostatic field, they migrate in the direction of electric field while experiencing drag by the collisions of gas molecules. The migration velocity under unit electrostatic field, that is, the electrical mobility, is a basic transport property of ions that reflects their size, charge state, and molecular structure. Ion mobility spectrometry (IMS) has been widely used for analyzing the molecular structures of bio-molecules by coupling it with electrospray ionization (ESI) (Ude, Fernandez de la Mora, and Thomson Citation2004; Ude and Fernandez de la Mora Citation2005; Trimpin et al. Citation2007; Brunelli, Flagan, and Giapis Citation2009; Larriba and Fernandez de la Mora Citation2012; Devine et al. Citation2017). The molecular structure analysis by the ESI/IMS is based on the hypothesis that the electrical mobility of airborne molecules is closely related to the molecular structure in a solution (Loo et al. Citation1997; Greig et al. Citation1995). However, previous studies (Ude, Fernandez de la Mora, and Thomson Citation2004; Trimpin et al. Citation2007; Larriba and Fernandez de la Mora Citation2012) suggested that the electrosprayed highly charged polymer chain takes various molecular conformations in gas as a result of charge-to-charge interactions in the molecule. According to the molecular dynamics (MD) simulation (in vacuum) of the molecular structure of polyethylene glycol (PEG) (Ude, Fernandez de la Mora, and Thomson Citation2004; Larriba and Fernandez de la Mora Citation2012), the molecular conformation of PEG (11 kDa) changed from a globular to a stretched conformation as the number of charge increased. Such transformation of molecular structure results in a complex dynamic behavior, causing a difficulty in the molecular structure analysis by the measurement of electrical mobility. The complexity in dynamic behavior may also have introduced a significant uncertainty in the filtration efficiency measurement using highly-charged macromolecular ions as test particles (Omori et al. Citation2017).
Molecular dynamics simulations are a powerful tool to estimate not only the molecular structure but also the transport properties of molecules (Liang et al. Citation2004; Ren, Shi, and Wang Citation2014). Our group has reported the applicability of an MD simulation for calculating the molecular diffusion coefficient in an ionic liquid system (Higashi et al. Citation2017) and the evaporation rate of electrosprayed nanodroplets (Higashi et al. Citation2015). In the present study, we applied the MD simulation to predict the electrical mobility of highly charged macromolecular ions accounting for the drag caused by the collisions of surrounding gas molecules (nitrogen).
2. Method
The simulations were carried out using a commercial MD software (Material Explorer 5.0 [FUJITSU Co., Ltd]). Several kinds of positively charged tetra-alkyl ammonium (TAA) ions (MW = 74–579) and PEG ions (MW = 899–4,643) were chosen as test molecules. The Dreiding force field (Mayo, Olafson, and Goddard Citation1990) was adopted to describe inter-and intra-molecular interaction (see supplementary information).
shows an example of a simulation cell. 200 N2 molecules were randomly located in the cubic cell (L = 20 nm) which corresponds to the atmospheric pressure condition. summarizes the molecular ions (TAA and PEG) used in the simulation. Molecular weights (Mw) of TAA ions were varied by the alkyl chain length from tetra methyl ammonium (Mw = 74) to tetra decyl ammonium (Mw = 579). PEG ions with 20, 30, 40, 60, 80, and 105 degrees of polymerization were also used (Mw = 899–4,643). The number of charges of the TAA ions were set to unity and the partial charge was calculated by the three-dimensional charge equilibration method (Pople and Gordon Citation1967). The PEG ions were multiply charged by attaching the ammonium ions (NH4+) to the PEG molecule. The value of partial charges of the neutral PEG molecules and singly charged ammonium ion were taken from the reference (Consta and Chung Citation2011) and from NIH database values (https://pubchem.ncbi.nlm.nih.gov/compound/223#section=Top), respectively, as shown in . The molecular image in shows an equilibrium structure of the singly charged PEG899 after a certain time of MD calculations (>0.5 ns). As shown in this image, NH4+ ion was electrically fixed by surrounding oxygen atoms with partial negative charge. Similar electrical fixing of the NH4+ ions was also observed for the multiply charged PEG ion systems depending on the PEG Mw. For example, four ions (z = 4) could be mounted on PEG899, while z = 7 on PEG4,643. Thus, PEG + zNH4+ complex could be regarded as a single molecular ion. Consta and Chung also showed similar equilibrium conformation for sodiated (Na+-bonded) PEG molecules after certain time of pre-calculation (Consta and Chung Citation2011). Based on their report, we also conducted the calculation without electric field to obtain equilibrium molecular ion structures (typically for >0.5 ns). This pre-calculation was carried out at least for three times for each condition.
Figure 1. An example of the molecular dynamics simulation, 200 nitrogen gas molecules and an ion (TAA or PEG). The arrows are electric field direction of each component (Ex, Ey, and Ez) and total one (E).
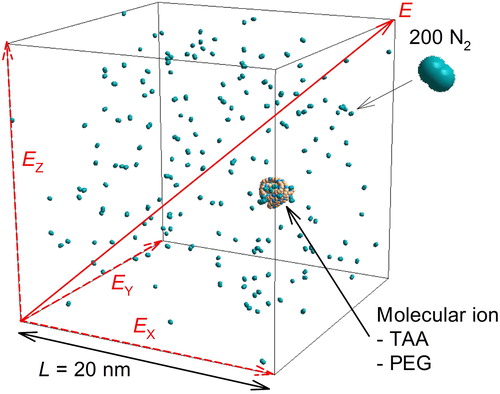
Table 1. Calculation conditions for the TAA and PEG molecules.
Table 2. Partial charges on the PEG and NH4 molecules.
To calculate the electrical mobility, an electrostatic field, Ex = Ey = Ez = 10 kV/cm (E in ), was applied as an external field by introducing the external electric field acting on all the partial charges across the entire system in the field’s direction. Calculation with the electrostatic field to x, y, and z directions has an advantage to compare the calculated velocities to three directions. The electric potential V is equal to product of electric field strength, E, and length of simulation cell, L (V = EL). The electrical mobility calculation was typically carried out for 5 ns. The number of calculation steps were set to 107 (time step of calculation was 0.5 fs). In this simulation, a constant particle number, constant temperature (T = 298 K), and constant volume (Canonical ensemble) were applied in a simulation cell with periodic boundary conditions. In order to control the temperature of the system, velocity rescaling method (Woodcock Citation1971) was used. The rescaling was performed at each step. Two common integrators using the velocity Velret method and the Gear-predictor-corrector method are installed in the present MD simulator (Material Explorer 5.0). These methods have been widely used in molecular dynamics simulation because of the low calculation cost. In the present simulation, the gear-predictor-corrector method was chosen because of the higher accuracy. The accuracy of the calculation was insured by the gear 5th order predictor corrector method. The calculation was carried out five times for each condition.
3. Results and discussion
3.1. Singly charged ion
, and Movie 1 in supplemental material show the time variation of the snapshot and a visualization of the calculation result, respectively. As shown in , the singly charged PEG3,538 ion migrated in the same direction as the electric field, collided with nitrogen molecules, and retained its globular conformation. Such time variation of migration velocity was plotted in . The open round symbol was the velocity averaged over five times calculation. As a result of acceleration of the ion in the small calculation cell, the nitrogen molecules also accelerated along the field direction, which causes an overall translation of the system. In order to cancel this effect, the relative velocity with respect to the center of gravity of nitrogen molecules was taken as the ion migration velocity. The solid line in represents theoretical velocity of the ions when the external forces acting on the molecular ion are electric force and drag force, which is expressed by equation S-6 in supplementary information. As the line in shows, the velocity rapidly increases for periods of up to 2 ns because the electrostatic force accelerating the ions is larger than the fluid resistance. Simultaneously, the fluid resistance increases as the velocity increases. After 2 ns, the mobility is presumably asymptotic to the constant value because the electric force and drag force are balanced. In general, the relaxation time (∼2 ns) is short enough to measure the experimental electrical mobility as a constant value.
Figure 2. Position of z charged PEG3,538 ion and nitrogen gas molecules against time in the simulation cell, (A) z = 1 (B) z = 5, (C) z = 7.
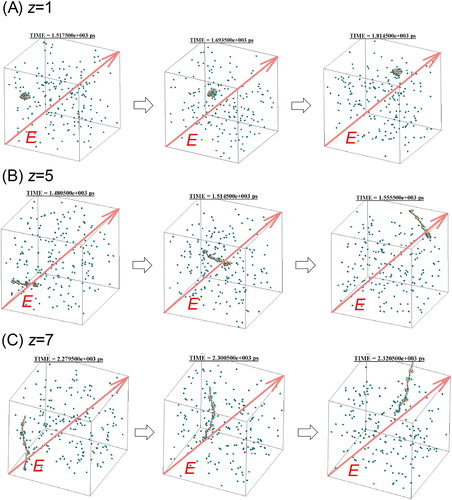
Figure 3. Time variation of electrical velocity of singly charged PEG3,538. Open circle and solid line represents the simulation result and the theoretical velocity.
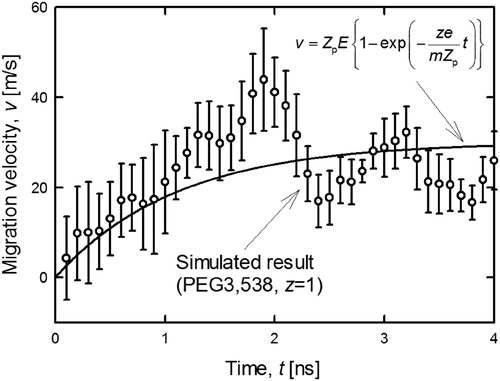
As shown in , the steady-state simulated migration velocity almost agreed with the theoretical calculation, though the random collisions with the N2 molecules induced a slight jittering up and down. To compare this simulated velocity with experimental data, the electrical mobility was calculated by the following equation:
(1)
(1)
where, vrelaxation is the steady-state velocity averaged over the period from 3 to 5 ns.
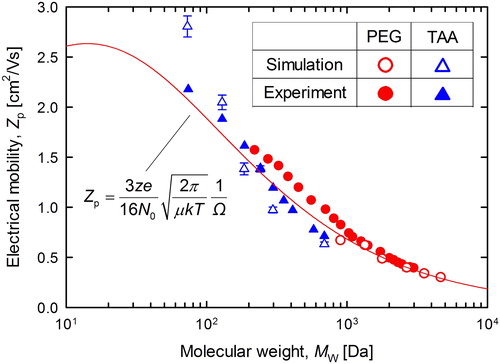
shows the electrical mobility of singly charged TAA and PEG ions as a function of the Mw. The simulated results are compared with the experimental results taken from the reference (Ude and Fernandez de la Mora Citation2005; Trimpin et al. Citation2007). The simulated electrical mobility and experimental electrical mobility are represented by open and closed symbols, respectively. As shown in , the simulated electrical mobility of TAA and PEG are in good agreement with the mobility determined experimentally. The line in represents the theoretical calculation result for a singly charged spherical PEG ion by assuming the bulk density of PEG, ρ = 1,260 kg/m3, using the following Mason–Scamp equation (Mason and McDaniel Citation1988):
(2)
(2)
where N0 is the number of gas molecules [m−3], μ is the reduced mass of the ion and gas molecules [kg], k is the Boltzmann constant [J/K], T is temperature [K], Ω is the collision cross section, d is the ion diameter [m], and dg is the diameter of the gas molecules [m]. The values in were set as dg = 0.30 nm and ξ = 1.36, obtained from the measurements of Millikan (Millikan Citation1923; Davies Citation1945). The simulated results also reasonably follow the theoretical line with the bulk density because the singly charged PEG in this simulation took an almost spherical conformation as predicted by MD simulation. For this reason, the MD simulation appears to serve capably for predicting the mobility of the molecular ion.
Figure 4. Molecular weight dependence of electrical mobility: experimental, simulated, and theoretical.
3.2. Multiply charged ion
show the simulation results for multiply charged PEG ions as a comparison with the singly charged ions (). The multiply charged ions (z = +5 and z = +7) also migrated in the same direction as the electric field, but the repulsive force between the charges on the ions caused them to take a straight-chain conformation rather than the spherical conformation of the singly charged ions. This transformation depending on the number of charges.
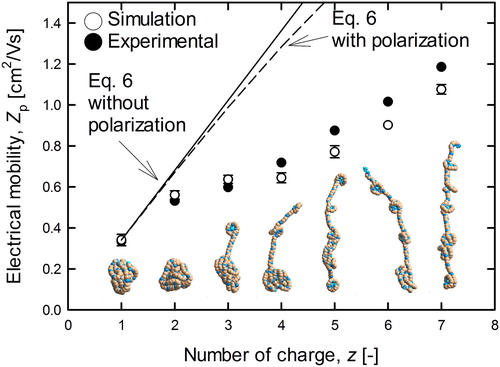
shows the time variation of the migration velocity of the singly (z = +1, closed circles) and multiply charged (z = +7, open circles) PEG ions (MW = 3,538 Da). Each plot represents the averaged value of the calculation results (5 times) at each calculation time step. The solid line in shows the steady state value of electrical velocity (per charge) for the singly charged spherical ion expressed as vsph = Zp,sphE, where Zp,sph is the experimentally measured mobility for singly charged PEG ions (Ude, Fernandez de la Mora, and Thomson Citation2004). The vertical axis of the 7-charged was set to be 1/7 of the simulated migration velocity (velocity per charge) for the comparison. As shown in , the average value of the migration velocity of z = +1 was close to the theoretical value of the spherical ions, while that of multiple charged ion was much smaller than the spherical assumption. Such variation of the electrical velocity may be caused by the change in the molecular conformation from globular (z = +1) to stretched (z = +7). It is worth noting that the singly charged ion shows higher fluctuation of the velocity than that of the multiply charged ion. These fluctuations are triggered by the random collisions with nitrogen molecules. On the other hand, the normalized velocity of 7-charged ion was relatively stable because seven times higher electrical force was applied to the 7-charged ion. To compare to experimental results and investigate the effect of the structural transformation on the electrical velocity, we calculated the electrical mobility from the migration velocity. The open and closed symbols in , respectively, represent the simulated and previous experimental results (Ude, Fernandez de la Mora, and Thomson Citation2004) for each number of charge. The solid line in represents the theoretical values for the spherical ion (EquationEquation 2(2)
(2) ) with the bulk density, ρ = 1,260 kg/m3. The broken line in is the theoretical line including the influence of polarization (Kumar et al. Citation2014; Larriba and Hogan Citation2013; Higashi et al. Citation2015). To take into account for ion-induced polarization of gas molecules, the collision cross section was represented as follow:
(4)
(4)
where, L is the correction factor for polarization expressed as follow:
(5)
(5)
where, Ψpol is the polarization energy to thermal energy ratio expressed as follow:
(6)
(6)
where, αpol is polarizability of gas molecule approximated as 1.7 × 10⁻³⁰ m3 for N2 and O2. also presents a snapshot of molecular image during the transition of the conformation (MW = 3,538). As shown in the molecular model image of z = +7, the molecule took the form of a fibrous structure consisting of two components: a ball-shaped structure surrounding the ammonium ion and a fibrous structure stretching from ball to ball. The length of the fibrous structure gradually shortened as the charge number decreased, until the molecule finally assumed the globular shape shown in the images for z = +1, and +2. The tendency shown in the conformation was reflected in the difference between simulated and theoretical mobilities. The simulated mobility of the z = +1 PEG ion agreed with the theoretical line of the spherical ion. The mobility gradually diverged from the theoretical line as the number of charges increased. More importantly, the simulated mobility values of the multiply charged molecular ions agreed well with the experimental results. On this basis, we can assert that our simulation can also reproduce the conformation and dynamics of the multiply charged stretched ions under an electrostatic field.
Figure 5. Migration velocity per charge number of PEG3,538 ion against time. Open/Closed symbols and solid line were represented singly/septuple charged ion and the experimental migration velocity (Ude, Fernandez de la Mora, and Thomson Citation2004), respectively. The vertical axis of the 7-charged ion was set to be 1/7 of the simulated migration velocity (velocity per charge) for comparison.
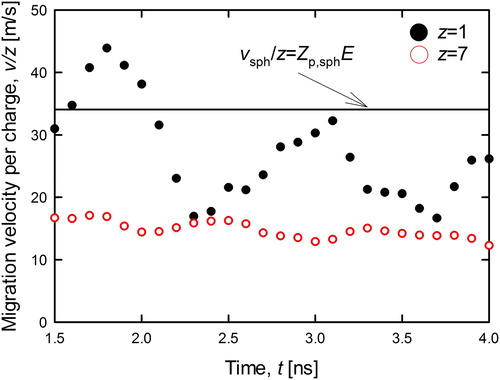
Figure 6. Relationship between the electrical mobility and charge number (PEG3,538).
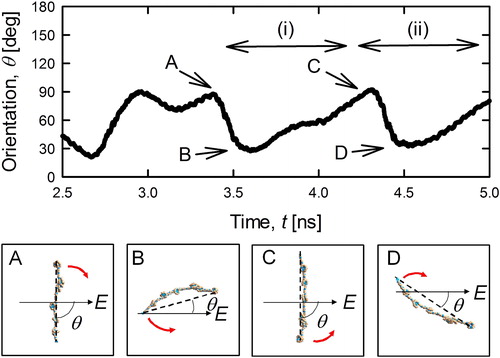
Next, we investigated the dynamics of the straight-chain (z = +7, MW = 3,538 Da) PEG ions in an electrostatic field in detail. The orientation θ was defined as the angle made by the molecular stretching direction and the electric field. In the calculation of θ, the direction of the stretched PEG ion was determined by the line connecting the two ammonium ions at the both ends of PEG as shown by the lines in . The time variation of this orientation is plotted in the upper part of . As demonstrates, none of the PEG ions were orientated in a parallel direction, though theta fluctuated between 20° and 90°. More specifically, the two waves (i) and (ii) seen at 3.5–5 ns showed almost the same wavelengths and heights. Hence, the orientation was determined by another factor in addition to the random collision with gas molecules. As seen in the snapshots in , the highly charged PEG ion was stretched perpendicularly to the electric field because the charges on the ion received the force uniformly. The charges were in fact unevenly distributed on the PEG ion, imposing a torque. The PEG ion rotated in an arbitrary direction (forward rotation) as a result, as shown in positions A to B. The macro molecular ion was flexible, however, resulting in a torque in the reverse direction that strained the molecule, as shown in B. The strain imposed during this rotation gradually decreased the torque in both the forward direction and reverse directions, although the decrease in the reverse-direction torque was less pronounced. As a result, the molecule rotated in the reverse direction and its orientation returned to the original position A. Such torque for rotation of forward and back direction may be changed by the non-uniformly distributed ions on the PEG molecule. The interaction between the charge and the electric field causes dipole moment to bend the PEG molecule. Therefore, the degree and frequency of the pendulum rotation may be dependent on the field strength and dipole moment. We regret that this hypothesis could not be reproduced in the simulation, however, as the dynamics was also affected by the collisions with the N2 molecules. Our findings might indicate that the straight-chain molecular ion was transported with the periodic bending and stretching motion.
Figure 7. Time dependence of the orientation of the 7-charged PEG3,538 ion (upper subfigure) and the conformations and the orientation of PEG ion at the specific calculation time A, B, C and D (lower subfigure).
4. Conclusion
An MD simulation of singly and multiply charged molecular ions (TAA and PEG) in N2 gas was performed. The conformation of the molecular ions was visualized, and the electrical mobility was calculated. The migrating singly charged TAA and PEG ions took almost spherical shapes, and the simulated mobility was in good agreement with previous experimental data as well as theory. The multiply charged PEG ions took various conformations depending on number of charges and Mw. A reasonable agreement between calculated electrical mobility and previous experimental data was obtained. Consequently, our MD simulation was confirmed to capably reproduce the dynamics and conformation of the multiply charged ions under transportation in an electric field. We also investigated the periodicity of the orientation. We thus, conclude that the highly charged PEG ion vibrated as it migrated under an electrostatic field in the gas phase, and that the vibration might influence the transport properties.
Supplemental Material
Download MP4 Video (1.8 MB)Supplemental Material
Download MS Word (44.7 KB)Additional information
Funding
Related Research Data
References
- Brunelli, N. A., R. C. Flagan, and K. P. Giapis. 2009. Radial differential mobility analyzer for one nanometer particle classification. Aerosol Sci. Technol. 43 (1):53–59. doi: 10.1080/02786820802464302.
- Consta, S., and J. K. Chung. 2011. Charge-induced conformational changes of PEG-(Na+)n in a vacuum and aqueous nanodroplets. J. Phys. Chem. B. 115 (35):10447–10455. doi: 10.1021/jp204559y.
- Davies, C. N. 1945. Definitive equations for the fluid resistance of spheres. Proc. Phys. Soc. 57 (4):259–270. doi: 10.1088/0959-5309/57/4/301.
- Devine, P. W. A., H. Fisher, A. Calabrese, F. Whelan, D. R. Higazi, J. R. Potts, D. C. Lowe, S. E. Radford, and A. E. Ashcroft. 2017. Investigating the structural compaction of biomolecules upon transition to the gas-phase using ESI-TWIMS-MS. J. Soc. Mass Spec. 28 (9):1855–1862. doi: 10.1007/s13361-017-1689-9.
- Greig, M. J., H. Gaus, L. L. Cummins, H. Sasmor, and R. H. Griffey. 1995. Measurement of macromolecular binding using electrospray mass spectrometry. Determination of dissociation constants for oligonucleotide: Serum albumin complexes. J. Amer. Chem. Soc. 117 (43):10765–10766. doi: 10.1021/ja00148a028.
- Higashi, H., M. Kumita, T. Seto, and Y. Otani. 2017. Calculation of self-diffusion coefficients of the [BMIM][TFSA]/water system by molecular dynamics simulation. Mol. Sim. 43 (17):1430–1435. doi: 10.1080/08927022.2017.1319055.
- Higashi, H., T. Tokumi, C. J. Hogan, H. Suda, T. Seto, and Y. Otani. 2015. Simultaneous ion and neutral evaporation in aqueous nanodrops: experiment, theory, and molecular dynamics simulations. Phys. Chem. Chem. Phys. 17 (24):15746–15755. doi: 10.1039/C5CP01730K.
- Kumar, A., S. Kang, C. Larriba, H. Ouyang, C. J. Hogan, and R. M. Sankaran. 2014. Ligand-free Ni nanocluster formation at atmospheric pressure via rapid quenching in a microplasma process. Nanotechnol. 25 (38):385601. doi: 10.1088/0957-4484/25/38/385601.
- Larriba, C., and C. J. Hogan. 2013. Ion mobilities in diatomic gases: Measurement versus prediction with non-specular scattering models. J. Phys. Chem. A. 117 (19):3887–3901. doi: 10.1021/jp312432z.
- Larriba, C., and J. Fernandez de la Mora. 2012. The gas phase structure of coulombically stretched polyethylene glycol ions. J. Phys. Chem. B. 116 (1):593–598. doi: 10.1021/jp2092972.
- Liang, W., H. Li, Y. Lei, and S. Han. 2004. Transport properties of acetone aqueous solutions: Molecular dynamics simulation and NMR studies. J. Mol. Struct. Theochem. 686 (1–3):109–113. doi: 10.1016/j.theochem.2004.08.024.
- Loo, J. A., P. Hu, P. McConnell, W. T. Mueller, T. K. Sawyer, and V. Thanabal. 1997. A study of SRC SH2 domain protein-phosphopeptide binding interactions by electrospray ionization mass spectrometry. J. Amer. Soc. Mass Spec. 8(3):234–243. doi: 10.1016/S1044-0305(96)00238-3.
- Mason, E. A., and E. W. McDaniel. 1988. Transport properties of ions in gases. New York: Wiley.
- Mayo, S. L., B. D. Olafson, and W. A. Goddard. 1990. Dreiding: A generic force field for molecular simulations. J. Phys. Chem. 97:8897–8909. doi: 10.1021/j100389a010.
- Millikan, R. A. 1923. The general law of fall of small spherical body through a gas, and its bearing upon the nature of molecular reflection from surfaces. Physical Rev. 22 (1):1–23. doi: 10.1103/PhysRev.22.1.
- Omori, Y., H.-J. Choi, Y. Mukai, T. Fujimoto, T. Tamadate, T. Seto, Y. Otani, and M. Kumita. 2017. Experimental evidence of a strong image force between highly charged electrosprayed molecular ions and a metal screen. Aerosol Air Qual. Res. 16 (12):3055–3062. doi: 10.4209/aaqr.2016.04.0147.
- Pople, J. A., and M. Gordon. 1967. Molecular orbital theory of the electronic structure of organic compounds. J. Amer. Chem. Soc. 89 (17):4253–4261. doi: 10.1021/ja00993a001.
- Ren, G., R. Shi, and Y. Wang. 2014. Structural, dynamics, and transport properties of concentrated aqueous sodium chloride solutions under as external static electric field. J. Phys. Chem. B. 118 (16):4404–4411. doi: 10.1021/jp4118387.
- Trimpin, S., M. D. Plasencia, D. E. Isailovic, and D. E. Clemmer. 2007. Resolving oligomers from fully grown polymers with IMS-MS. Anal. Chem. 79 (21):7965–7974.
- Ude, S., and J. Fernandez de la Mora. 2005. Molecular monodisperse mobility and mass standards from electrosprays of tetra-alkyl ammonium halides. J. Aerosol Sci. 36 (10):1224–1237. doi: 10.1016/j.jaerosci.2005.02.009.
- Ude, S., J. Fernandez de la Mora, and B. A. Thomson. 2004. Charge-induced unfolding of multiply charged polyethylene glycol ions. J. Amer. Chem. Soc. 126 (38):12184–12190. doi: 10.1021/ja0381306.
- Woodcock, L. V. 1971. Isothermal molecular dynamics calculations for liquid salts. Chem. Phys. Lett. 10 (3):257–261. doi: 10.1016/0009-2614(71)80281-6.