
 ?Mathematical formulae have been encoded as MathML and are displayed in this HTML version using MathJax in order to improve their display. Uncheck the box to turn MathJax off. This feature requires Javascript. Click on a formula to zoom.
Abstract
The microbial composition of bioaerosols is an important issue to investigate to better understand occupational risks linked to exposure to airborne particles. Traditional methods are based on culture followed by colony identification by morphological, molecular biology or biochemical approaches. We have carried out a preliminary study which aims to generate reproducible complex bioaerosols and compares a high-throughput sequencing approach to the traditional culture-based approach. Mixed fungal bioaerosols containing four fungal strains (Aspergillus niger, Cladosporium cladosporioides, Penicillium brevicompactum and Wallemia melicolla) were generated in the laboratory using a bubbling aerosolizer. The fungal composition was assessed by culture and sequencing. Two genetic targets were sequenced and two assignment methods were compared. Wallemia was poorly detected by the culture-based approach, whereas Aspergillus was readily observed, in significant proportions, only by this method. The proportions in the liquid suspensions and in the bioaerosols generated were nearly identical. Sequencing of the ITS2 region provided results better reflecting the theoretical composition than 18S rDNA sequencing. The findings show that results of fungal composition investigations are strongly dependent on the analysis method used. Further studies will be required to assess the impact of these findings when considering biodiversity in complex and unknown environments.
Copyright © 2019 American Association for Aerosol Research
1. Introduction
In many workplaces, workers are exposed to fungal bioaerosols. This exposure has been associated with several health effects, particularly impacting the respiratory tract including allergies (asthma, rhinitis or hypersensitivity pneumonitis), irritation and infection (Douwes et al. Citation2003; Fung and Hughson Citation2003). The biodiversity of fungal aerosols has been investigated in several working environments; such as waste composting plants, wastewater treatment stations or pig confinement buildings, and complex and variable compositions are reported (Tolvanen Citation2001; Bru-Adan et al. Citation2009; Kristiansen et al. Citation2012; Ding et al. Citation2016). Consequently, the specific microbial agents responsible for the health effects observed are incompletely known, and their precise roles in triggering symptoms are poorly understood (Dyląg Citation2017). This lack of knowledge probably explains why dose–response relationships have yet to be established for most non-infectious airborne microorganisms, and why occupational exposure limit values have yet to be established for airborne fungi (Douwes et al. Citation2003; Fung and Hughson Citation2003). Thus, biodiversity in bioaerosols is an important issue to investigate to better understand the occupational risks associated with exposure to airborne biological particles.
The measurement of bioaerosols has received a lot of attention during last decades, and a wide variety of methods has been proposed for that purpose. Indeed, airborne microorganisms and compounds can be collected using different sampling methods such as filtration, impaction, impingment and electrostatic samplers that were previously investigated and reviewed (Reponen Citation2011; Reponen et al. Citation2011; Haig et al. Citation2016). The analysis of bioaerosol samples is performed using culture-based and culture-independent methods including chemical, biochemical, microscopic and molecular assays (Reponen et al. Citation2011; Duquenne, Marchand, and Duchaine Citation2013; Mbareche et al. Citation2017). Various methods are used to study biodiversity, and include culture-dependent methods with morphological, microscopic and biochemical identification, as well as molecular methods such as high-throughput sequencing (HTS). Each of these methods has specific advantages and limitations that have been reviewed (Yoo et al. Citation2017; Duquenne Citation2018). Culture-based methods are known to underestimate the true biodiversity of environmental samples for a number of reasons, the main one of which is the viable but non-culturable state of most of microorganisms, selective pressure during culture conditions, slow growth rates for certain microbial strains, and difficulties identifying other ones (Amann, Ludwig, and Schleifer Citation1995; Heidelberg et al. Citation1997; Yoo et al. Citation2017). The advantages of culture-based methods include identification at the species level, based on macroscopic and microscopic observations at biochemical, chemical and bio-molecular tests. In addition, microbial isolates can be obtained for further study (Duquenne Citation2018). In contrast, molecular-based methods such as HTS avoid the need for a culture step, consisting rather of several analytical steps (DNA extraction, library preparation, sequencing and bioinformatics analysis). These multiple steps may introduce biases. For example, species may be favorably detected due to the preferential extraction of DNA from their cells (Haugland, Heckman and Wymer Citation1999), or DNA amplification of some fungi may be easier due to the primers used to prepare the library (Bellemain et al. Citation2010). A number of bioinformatics tools are available to analyze sequencing data, such as mothur (Schloss et al. Citation2009), QIIME (Caporaso et al. Citation2010) and FHiTINGS (Dannemiller et al. Citation2014). Sequence assignment may also be performed by a range of methods or using databases. All these different options may lead to differences in biodiversity results.
Thus, biases in biodiversity methods have been identified, but their respective impact on biodiversity results remains to be clarified for bioaerosols. A relevant investigation of the methods used to assess microbial composition of bioaerosols requires the use of bioaerosols of known and controlled composition. Most published studies dealing with bioaerosol biodiversity were carried out in real exposure conditions (Hoisington et al. Citation2014; Yoo et al. Citation2017). As the actual composition of field bioaerosols is unknown, comparative studies of biodiversity methods may be difficult to interpret.
We have carried out a preliminary study which aims were: (1) to produce and to characterize a reproducible fungal bioaerosols and (2) to test the impact of analytical approach on composition results. Various parameters were investigated using results from biodiversity measurements of laboratory-generated fungal bioaerosols: (a) the biodiversity analysis method (culture vs. HTS); (b) the target gene for sequencing; (c) the method used to assign sequences.
2. Materials and methods
2.1. General organization of experimental assays
Two independent sets of experiments (SET A and B) were carried out with experimental bioaerosols in laboratory conditions.
2.1.1. Set A: Generation and characterization of bioaerosols produced from pure liquid fungal suspensions
The first set of experiments aimed to investigate the main characteristics of bioaerosols composed of a pure fungal strain (for four different fungal strains). A bioaerosol was produced from each pure fungal liquid suspension for a single experimental run. The bioaerosol was (i) sampled using three parallel closed-face filter cassettes (CFC) to determine the number of airborne cultivable fungi and (ii) measured in real-time using an optical particle counter and an aerodynamic particle sizer to monitor the number concentration and the size distribution of airborne particles, respectively.
2.1.2. Set B: Generation and characterization of bioaerosols produced from mixed liquid fungal suspensions
Set B experiments aimed to investigate the biodiversity of bioaerosols produced from mixed liquid fungal suspensions, and especially to study the effects of changes to analytical procedures on biodiversity results. A mixed liquid fungal suspension was prepared with four different pure liquid fungal suspensions. This mixture was used to produce a mixed experimental bioaerosol for three independent experimental runs. The bioaerosols were sampled using three parallel CFCs to assess cultivable fungi and biodiversity by analysis of cultivated fungal isolates.
For each experimental run, one CFC was randomly selected for DNA sequencing-based biodiversity measurement. Biodiversity in each mixed liquid fungal suspension was also investigated by identification of fungal isolates and direct DNA sequencing. The size distribution of culturable fungi in the bioaerosols was also investigated using a cascade impactor. Real-time measurements of airborne particles were performed with an optical particle counter and an aerodynamic particle sizer. One negative control was included in each run, by adding 10 mL of a sterile solution of 0.01% of Tween 80 in an ultra-pure water to a clean CFC.
2.2. Preparation of liquid fungal suspensions
Four fungal suspensions were prepared with the following strains: Aspergillus niger (ATCC 11431.83, CRBIP, France), Penicillium brevicompactum (UMIP 2338.96, CRBIP, France), Cladosporium cladosporioides (ATCC 16022, LGC standard, France) and Wallemia melicolla (initially identified as Wallemia sebi by the manufacturer) (ATCC® MYA-4683™, LGC standard, France). Each strain was sub-cultured on malt extract agar (MEA) medium (BD Difco™ Malt Agar) for 7 d at 25 °C. Then, the agar surfaces were scraped and fungal entities were transferred into 10-mL sterile water. This preparation was filtered on a glass frit of porosity 2 (40–100 µm, Duran). The frit was then rinsed with sterile water to obtain a final volume of 25 mL. The suspension was centrifuged twice at 5100×g for 7 min. The two pellets were re-suspended in 25-mL sterile pure water. The optical density at 600 nm was adjusted to 1.3, which corresponded to a cultivable fungal concentration of about 1 × 10⁶ CFU/m3. To prepare the fungal mixture, 20 mL of each spore suspension were mixed. Filtration was used to retain large solid particles (agglomerates, mycelium strands, etc.) which are more difficult to generate and which can impede the passage of the fungal suspension through the peristaltic pump. The centrifugation steps were used to remove medium, impurities and fungal fragments which can generate undesired small particles. Microscopic examination of fungal suspensions prepared with this protocol indicated that they contained mostly spores and few mycelium fragments or strands (Simon and Duquenne Citation2013).
2.3. Description of the setup for bioaerosol generation, characterization and sampling
The test rig includes a bubbling-type generator and a chamber to condition and sample bioaerosols (). This setup is fully described elsewhere (Simon et al. Citation2011).
Figure 1. Diagram of the test rig used to generate and sample the experimental bioaerosols. QG: bubbling airflow; QE: entraining airflow; T: temperature of air; RH: relative humidity of air; CFC: closed-face cassette; MARPLE: cascade impactor.
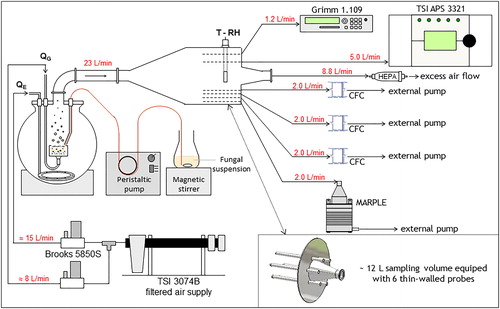
Briefly, a peristaltic pump feeds the liquid culture onto the upper surface of a 2-mm thick stainless steel porous disk (Stemm, 30 mm in diameter, 1 µm pore diameter), the liquid settles as a film. Prior to passage through the peristaltic pump, the fungal suspension was continuously stirred using a magnetic stirrer to prevent spore sedimentation and ensure a more homogeneous distribution of the hydrophobic particles throughout the liquid volume. A dispersion cell is used to produce a constant, reproducible liquid film height (Hliq = 8 mm) for the full duration of a test and between distinct tests. Fungal particles are dispersed by bubbling compressed air (flow rate 5 ≤ QG ≤ 10 L/min) through the film of liquid culture. Transport of the aerosolized particles toward the generator outlet is improved by an upward injection of entraining air (flow rate 13 ≤ QG ≤ 18 L/min), composed of a mixture of dry and humid air in proportions adjusted to maintain a constant RH (RH = 50 ± 1.5% – thermo-hygrometer Rotronic®, HygroPalm2) throughout the assay. Temperature and RH are continuously measured by the thermo-hygrometer probe (Rotronic®, HygroClip®). Depending on the day of generation, the 60-min averaged values for air temperature comprised between 21.5 and 25 °C. The compressed air was first dried and filtered in a treatment unit (TSITM, model 3074B); airflow rates are adjusted using regulated thermal mass flow meters (Brooks®, models 5850S) and a mass flow meter read-out and control unit (Brooks®, model 0154–0.1 L/min accuracy).
The test rig is completed by a 12-L sampling chamber where the bioaerosol is conditioned and sampled. This chamber is equipped with six 20 cm long, 10 mm i.d. sampling probes, for simultaneous connection of devices (real-time instruments, samplers, etc.).
Each bioaerosol generated was simultaneously sampled by three closed-face cassettes (Millipore®, 37-mm polystyrene 3-piece closed-face cassette – CFC) connected to the sampling chamber. Each cassette contained a support pad (Millipore®, thick cellulose absorbent pad) and a filter (Whatman®, Nuclepore® polycarbonate membrane, 0.8 µm pore size). Sampling was performed at a flow rate of 2 L/min with a personal sampling pump (Gilian®, GilAir-3) for 60 min.
As it can be seen in , each pure fungal strain bioaerosol was generated once (Set A, Section 2.1.1.) and the 4-strains mixing bioaerosol was generated for three independent experimental runs (Set B, Section 2.1.2.). An optical particle counter (OPC-Grimm®, G1109) was used to monitor the particle number concentration in real-time. The OPC-Grimm® works at a sampling airflow rate of 1.2 L/min and classes particles according to size (optical diameter, dopt) between 0.25 and 32 µm, across 31 channels; particle counting was integrated over 6 s. Particles with an optical diameter greater than 1 µm were assumed to be fungal entities (spores, mycelium fragments and strands, agglomerates of spores), whether they are culturable, non-culturable or dead. The cumulated particle number concentration with an optical diameter greater than 1 µm, CN(dopt > 1 µm), was considered to be an indicator of the total fungal concentration in the bioaerosol generated. All experiments were performed using a target value for CN(dopt > 1 µm) as close as possible to 7000 #/L (upper limit for the particle concentration in the liquid cultures). More information on how this limit was determined and achieved can be found in section S1 in the online supplemental information (SI).
Table 1. General generation runs data.
The size distribution of the particles generated was also assessed with an Aerodynamic Particle Sizer® (APS-TSI™, model 3321). The APS spectrometer measures the aerodynamic diameter (dae) in real-time (over 120 s) for particles from 0.5 to 20 µm, using 52 channels and a sampling flow rate of 5 L/min. 60-min average number size distributions were used to adjust a log-normal distribution (least squares optimization) and determine the median aerodynamic diameter (), and the associated geometric standard deviation (σg) of the particles contained in aerosols.
2.4. Elution of fungal particles collected in the CFC
Following sampling, 10 mL of a sterile solution of 0.01% of Tween 80 in ultra-pure water was introduced into the cassettes through the inlet. Cassette inlets and outlets were closed with caps and the cassette was placed on a rocker (Heildolph®, Multi-Reax shaker) at 2000 rpm and room temperature for 20 min.
2.5. Counting and identification of cultivable fungi
Bioaerosol, mixed liquid suspensions and pure-culture samples were all assessed to determine culturable fungal concentrations and biodiversity. Three successive dilutions were spread onto Petri dishes containing MEA medium (Duquenne et al. Citation2012). Dishes were incubated at 25 °C for 5 d, and fungal colonies were counted on each Petri dish. The culturable fungal concentrations were expressed as Colony Forming Unit per milliliter of liquid analyzed (CFU/mL) for suspensions, and as CFU per cubic meter of air sampled (CFU/m) in the CFC. In mixed liquid suspensions and mixed bioaerosols, each colony was identified at the genus level based on macroscopic morphology.
2.6. DNA extraction
DNA extraction was performed on 500 µL of each mixed bioaerosol and mixed liquid suspension using the FastDNA®SPIN kit for soil (MP Biomedicals, Illkirch, France) according to the manufacturer’s instructions. Each sample was analyzed in triplicate. DNA samples were stored at –20 °C until analysis. To assess the efficiency of the DNA extraction, the DNA concentration was measured using a Nanodrop 2000c spectrophotometer (Thermo Fischer Scientific, Illkirch, France); it was 6.7 ± 1.9 ng/µL
2.7. Sequencing and data analysis
One mixed bioaerosol per generation (one CFC per day, three in total) was randomly selected for sequencing analysis. The liquid suspensions were also sequenced. Two DNA barcodes were sequenced to assess their impact on results of fungal biodiversity analysis. DNA purification, amplification and sequencing were performed by INRA Transfert Environnement (Narbonne, France). The universal primers used to amplify Eukaryote DNA were w553 CTTTCCCTACACGACGCTCTTCCGATCTGCGGTAA TTCCAGCTCCAA and w554 GGAGTTCAGACGTG TGCTCTTCCGATCTTTGGCAAAT GCTTTCGC. These primers target the V1 variable region of eukaryotic 18S rDNA. The primers used to amplify the specific fungal barcode ITS2 were w404 CTTTCCCTACACGACGCTCTTCCGATCTTGTGART CATCGAATCTTTG and w40 GGAGTTCAGACGTG TGCTCTTCCGATCTTCCTCCGCTTATTGATATGC (primers generally used by INRA Transfert Environnement). Each PCR mixture consisted of: 5 µL DNA template, 4 µL dNTPs (25 mM), 1 µL each primer (100 ng/µL), and 0.5 µL Taq polymerase in a total volume of 50 µL. The PCR temperature cycle was 95 °C for 2 min, 56 °C for 1 min and 72 °C for 1 min. The two genetic targets were sequenced using MiSeq technology (Illumina, San Diego, CA, USA). Preprocessing for sequence analysis was performed by INRA Transfert Environnement using a mothur pipeline (version 1.37.4; Schloss et al. Citation2009). Chimera were detected and deleted using UCHIME (Edgar et al. Citation2011) in mothur. Reads with 100% identity were clustered as a unique sequence. Then, the unique 18S rDNA sequences were assigned at genus level (min E value: 10−100) using the BLASTn algorithm through Genbank (NCBI database; https://blast.ncbi.nlm.nih.gov). To assess the impact of the data analysis step, unique ITS2 sequences were assigned in two different ways: (1) massBLASTer algorithm with the UNITE database (https://unite.ut.ee/analysis.php), (2) Wang method performed in mothur with the UNITE database (Wang et al. Citation2007). This version of the UNITE database contains almost 817,130 ITS sequences from https://unite.ut.ee/statistics.php. Fastq files from this study are available on request.
3. Results
3.1. Size distribution of airborne fungal particles
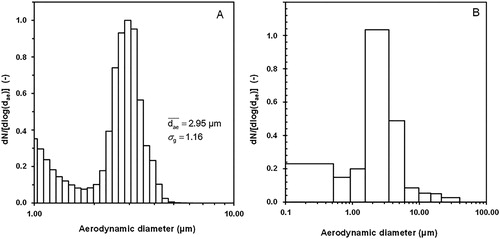
The experimental design allowed bioaerosols to be generated from the 4-strain mixture of liquid cultures. A representative example of the size distribution of airborne particles as a function of their aerodynamic diameter is shown in . The main population had a count median aerodynamic diameter (CMAD) of 2.95 µm, with a geometric standard deviation of 1.16. Airborne experimental particles presented aerodynamic diameters between around 1.7 and 6.0 µm. A second population of particles with a diameter less than about 1.7 µm is also visible in .
Figure 2. Size distribution of airborne particles in the bioaerosol generated from a liquid consortium of the four fungal strains. The aerodynamic diameter was measured using (A) the TSITM APS 3321 (normalized number size distribution); (B) the Marple Cascade Impactor (normalized number of CFU, total number of CFUs measured when considering all the stages = 2.7 × 10⁶ CFU/m3).
The size distributions for the 4-strain mixture experimental bioaerosols were almost identical for the three independent generation runs performed (Figure S2).
The size distribution of the bioaerosols generated from pure cultures of each individual fungal strain was also investigated. The population of W. melicolla spores had a CMAD of 2.45 µm, with a geometric standard deviation of 1.11 (Figure S3). Like P. brevicompactum, W. melicolla particles presented aerodynamic diameters between around 1.7 and 5.0 µm. Aspergillus niger and C. cladosporioides presented slightly higher CMADs: 3.45 (mainly between 2.5 and 6.0) and 2.75 (mainly between 1.7 and 7.0), respectively.
3.1.1. Repeatability and reproducibility of bioaerosol generation
The different parameters measured during and after bioaerosol generation in each experiment are shown in . The particle number concentration was 6.77 ± 0.2 × 10⁶ p/m3 for mixed bioaerosols and 7.24 ± 0.24 × 10⁶ p/m3 for pure bioaerosols. The concentration of cultivable fungi ranged from 7.32 × 10⁶ CFU/mL (mixed bioaerosol 1) to 2.0 × 10⁸ CFU/mL (Wallemia melicolla bioaerosol). The number of colonies counted ranged from 271 to 302 per generation in the three CFC in which the bioaerosol was collected (). The standard variation was higher for the liquid suspensions. For the sequencing analysis, the numbers of ITS2 and 18S rDNA reads also varied between runs. Read numbers were about 50,000–60,000; no significant differences were found between the liquid suspensions and the bioaerosols (Wilcoxon–Mann–Whitney test, p = .17).
3.2. Fungal composition
3.2.1. Impact of analytical tools
The fungal composition of mixed bioaerosols was assessed using various methods and analytical strategies. Results indicate that three out of four molds were identified when the fungal composition was assessed morphologically following culture on nutrient-rich medium (). Wallemia melicolla was poorly represented in the samples, both in the mixed bioaerosols and in the mixed liquid cultures. Penicillium brevicompactum tended to dominate (53%), and A. niger and C. cladosporioides were found in equivalent proportions (23% and 24%, respectively). Similar results were found in mixed liquid suspensions (Figure S4).
Figure 3. Fungal biodiversity in the mixed bioaerosols found using several methods. The value of each fungal proportion correspond to the mean of proportions found in the three mixed bioaerosols.
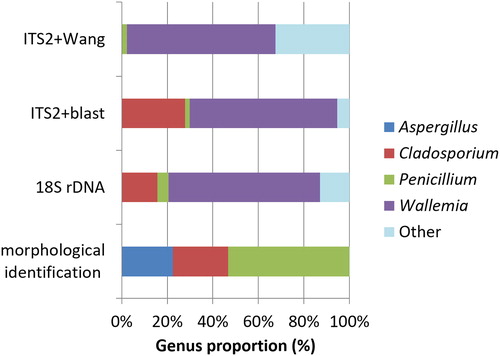
In contrast, when the fungal composition was assessed by sequencing and reads were assigned at the genus level, Wallemia was the predominant genus (about 65%) for both target genes and either analytical strategy (). The proportion of Cladosporium differed depending on the analytical method; it was 15.6% with 18S rDNA sequencing, and 27.3% with ITS2 sequencing followed by BLAST-based assignment. It was undetected when ITS2 sequences were assigned using the Wang method run in mothur. Penicillium was detected with all the methods, and represented 4.8% of the 18S rDNA reads and about 2% of the ITS2 reads (with both assignment algorithms). Aspergillus was the least detected mold when using sequencing methods. It was undetected by 18S rDNA sequencing and was only detected in low proportions with ITS2 sequencing (<1%). In addition to the four fungal strains generated, DNA sequencing identified other Fungi or Eukaryota (labeled “others” in ). These organisms represented 13% of the 18S rDNA reads, 5.4% of the ITS2 reads assigned using the BLAST algorithm, and 32.5% of the ITS2 reads assigned when using the Wang method in mothur. Among the strains detected, 18S rDNA sequencing also identified DNA from Viridiplantae (1.2%), Metazoa (0.3%) and other fungi (11.4%), in particular Zygosaccharomyces (11.1%). With ITS2 sequencing, the other fungi identified depended on the algorithm used to assign reads. For example, Basidiomycota and Ascomycota, such as Malassezia (2.8%), were identified by the BLAST algorithm. Using the Wang method in mothur, 28 other fungal genera were detected, predominantly Davidiella (27.9%). Malassezia was also detected using this method, and represented 3.0% of the ITS2 reads.
3.2.2. Comparing mixed liquid suspension and mixed bioaerosol compositions
The composition of the mixed liquid suspensions and mixed bioaerosols were assessed by the culture method, ITS2 and 18S rDNA sequencing and using BLAST to assign reads. The results showed that Cladosporium was found in lower proportions in the bioaerosols than in the liquid culture, with a decrease of 6% by the culture method, 7.4% by ITS2 sequencing, and 2.4% by 18S rDNA sequencing ().
Figure 4. Fungal biodiversity in the mixed bioaerosols and liquid suspensions found using morphological identification after culture, 18S rDNA and ITS2 sequencing. The value for each fungal proportions corresponded to the mean of proportions found in the three bioaerosols and the corresponding liquid suspension.
In contrast, Aspergillus (+ 2.7%) and Penicillium (+ 3.4%) were detected in higher proportions based on sequencing of the ITS2 barcode. The “Other” group was also detected in higher proportions in bioaerosols by the HTS s approach (+ 5.0% and + 12.5% by ITS2 and 18S rDNA sequencing, respectively) (Wallemia was detected at higher levels (+2.0%) in bioaerosols based on the ITS barcode data; 18S rDNA sequencing returned a higher proportion in liquid suspensions (+ 9.7%).
4. Discussion
One of the objectives of this study was to investigate how the analytical methods used impact biodiversity measurements when analyzing fungal bioaerosols produced in laboratory conditions. To be able to do so, a complex experimental bioaerosol of known and reproducible characteristics (composition, concentration and size distribution) had to be generated. In addition, it was important that neither the generation nor the sampling processes used during experiments induced additional biases in biodiversity measurements.
4.1. Characterization of the complex fungal bioaerosols
A complex fungal bioaerosol was generated from a mixed liquid suspension of A. niger, P. brevicompactum, C. cladosporioides and W. melicolla. These strains were among the main fungal genera identified in bioaerosols sampled in a waste-sorting plant in a previous study (Degois et al. Citation2017). The bioaerosols generated had a mean dae of 2.95 µm ().
When single strains were generated as bioaerosols, the median aerodynamic diameters determined from the size distributions for A. niger, P. brevicompactum, C. cladosporioides and W. melicolla were 3.45 µm, 2.45 µm, 2.75 µm and 2.45 µm, respectively (Figure S3). These values are close to those reported in previous studies; some slight differences compared to previous experimental works were noted (Reponen et al. Citation1996; Lee, Kim, and Kim Citation2002), but could be explained by differences between generation devices, particle size measuring instruments, aerosolization operating conditions (e.g. RH) or bioaerosol composition (e.g. proportion of mycelium, growth conditions before aerosolization). Aspergillus niger spores are globose or subglobose in shape and range from 2.5 to 5.0 µm in physical diameter (Raper and Fenell 1965). Based on scanning electron microscope, Scheermeyer and Agranovski (Citation2009) reported average sizes of generated spores of A. niger between 3.2 and 3.9 µm; the smallest diameter measured was 2.1 µm (deflated spores) and the largest was 5.1 µm (rounded spores). Kanaani et al. (Citation2008) measured a mean aerodynamic diameter for aerosolized A. niger spores of 3.51 ± 0.08 µm, with more than 99% between 2.3 and 5.8 µm. Penicillium brevicompactum spores are spherical or slightly ellipsoidal and range from 3 to 4.5 μm in physical diameter (Samson et al. Citation1995). Previous studies reported a mean aerodynamic diameter for aerosolized P. brevicompactum spores of 1.8–2.4 μm (1.11 < σg < 1.17) (Reponen et al. Citation1996) or 2.56 µm (σg < 1.15) (Jankowska et al. Citation2000). Cladosporium cladosporioides spores are ellipsoidal or lemon-shaped with diameters ranging from 3 to 7 × 2 to 4 µm (Samson et al. Citation1995). Previous studies reported a mean aerodynamic diameter for aerosolized C. cladosporioides spores of 1.75–1.87 μm (1.14 < σg < 1.17) (Reponen et al. Citation1996) or a modal aerodynamic diameter of 2.65 ± 0.08 µm (Jung et al. Citation2009).
4.2. Control and reproducibility of the generation process
With our generation method, we assume that particles with an optical diameter greater than 1 µm are fungal entities. Consequently, the cumulated particle number concentration for entities with an optical diameter greater than 1 µm, CN(dopt > 1 µm), was considered an indicator of the total fungal concentration in the bioaerosol generated. Experimental reproducibility was determined by setting a target value for CN(dopt > 1 µm): as close as possible to 7000 #/L. The protocol used to prepare liquid cultures before aerosolization was specifically adapted for aerosol generation with our bubbling system. Thus, the populations of fungal spores of interest could easily be monitored by optical counter without being randomly affected by undesired residual particles. These residual, undesired particles correspond to residual culture medium, salt, fungal debris or other impurities still present in the suspension despite the washing steps included during preparation (further details are provided in Sections S1 and S2 of the SI). The use of a real-time indicator such as CN(dopt > 1 µm) is only possible because the diameters of the biological particle populations do not overlap with another unknown and uncontrolled particle population ( and S3). This allowed better control/predictability of the biological parameters which were only measurable after subsequent sample analysis.
To obtain a cultivable concentration as close as possible to 106 CFU/m3, the target particle count concentration was 7 × 10⁶ p/m3. This target was achieved within ±6% for all the mixed and pure-strain fungal bioaerosols in three independent generation runs each (). As a result, the culturable concentration (about 106 CFU/m3) was also reproducible, except for W. melicolla, which had a 10-fold lower cultivable airborne concentration than expected. This result may be due to this fungal species being more sensitive to the stress caused by the generation method and sampling on CFC than the other species aerosolized. Although W. sebi is reportedly the only species of Wallemia capable of growth on media without additional solutes (NaCl, glucose), it remains a xerophilic species and the restricted growth conditions provided by the MEA medium probably impaired its growth (Zalar et al. Citation2005). Despite our expectations, Wallemia mellicola was detected on MEA medium in the single-strain suspension and in bioaerosols. Thus, W. mellicola can grow on this particular medium.
The composition of the different bioaerosols varied over a wider range than the relative strain concentrations reflect. The confidence interval was found to be broader for the culture method than for the HTS method. For example, a confidence interval of more than 10% (Penicillium and Aspergillus proportions in liquid suspension) was calculated for cultures, compared to 6% (Wallemia 18S rDNA in bioaerosols) when using HTS (Figure S4). Indeed, the number of colonies counted (about 100–200 per sample) was very low compared to the numbers provided by sequencing (about 50,000–60,000). As a result, small differences in colony numbers would cause larger variations compared to small differences in number of reads.
4.3. Biodiversity biases due to sampling and generation processes
Previous studies carried out in real exposure conditions reported an effect of bioaerosol sampling methods on biodiversity results (Fahlgren et al. Citation2010; Hoisington et al. Citation2014). The impact of bioaerosol samplers is linked to their physical efficiency regarding the capture of airborne particles through the inlet, their transmission inside the device (particularly potential deposits on the inner surfaces of samplers), and their collection along with potential contaminations. In the present study, the CFC inlets were directly connected to the bioaerosol chamber, and possible deposition of fungal particles was taken into account during the elution step. Thus, only the collection efficiency would affect the biodiversity measured. The fungal bioaerosols generated were sampled on 37-mm closed-face cassettes containing a 0.8-µm pore size polycarbonate membrane as collection support. The physical collection efficiency of a 1-µm pore size polycarbonate filter is close to 90% for particles with an optical diameter of 0.2 µm, and close to 100% for particles with an optical diameter greater than 0.3 µm (Burton, Grinshpun, and Reponen Citation2007). The recovery efficiencies of the sampled spores from the polycarbonate membrane were not studied in this particular works. Our previous feedback (data not shown) revealed that the used extraction method based on 20-min vortex agitation exhibited an extraction efficiency of > 95% when the microorganisms were extracted from non-fibrous surface collection polycarbonate membranes. Such flat filters where biological particles can easily been washed from the surface have been commonly used and proven to have high recovery efficiencies for multiple bioaerosols (Wang et al. Citation2015). Thus, airborne fungal particles were fully collected on filters with equal efficiency in our experiments, and the sampling process should not have induced selective biases affecting the composition of samples compared to the actual biodiversity in the bioaerosols generated.
Results from previous studies indicated preferential aerosolization of certain microorganisms (Hongxia et al. Citation2004; Perrott et al. Citation2017), thus the impact of the generation step on biodiversity results may be an important issue. Our results confirm that the four fungal strains mixed in the liquid suspensions were aerosolized. However, we cannot affirm that strains were aerosolized with equal efficiency from the liquid culture. The fungal proportions in the bioaerosols are determined by the initial composition in the liquid suspension and by the aerosolization efficiency for the individual strains. The results showed an equivalent fungal composition in the mixed bioaerosols and in the liquid suspensions. Based on this result, we assume that the bioaerosol generation step did not influence the fungal proportions.
4.4. Analytical tools to assess biodiversity
To assess how the analytical tools used affected the evaluation of fungal composition, culture-dependent and non-culture-dependent methods were used. For the sequencing, two genetic targets (18S rDNA and ITS2 region) and two sequence-assignment methods were compared. All four fungal strains were detected throughout the study, but no single method detected the four strains in the expected proportions. Furthermore, fungal species other than those initially added were detected in the bioaerosols generated.
Wallemia mellicola was poorly detected in culture and morphological identification. Of the 867 colonies analyzed, only about 20 were identified as W. melicolla. The competitive conditions were unfavorable for this xerophilic fungus due to its slow growth rate on most common culture media, particularly MEA medium (Flannigan Citation1997; Zeng et al. Citation2004). Furthermore, W. melicolla forms small colonies (1–2 mm diameter) that are only usually observed in the absence of propagules of faster-growing species (Flannigan Citation1997). In contrast, by sequencing, regardless of the target sequence and sequence-analysis tools, Wallemia was the main genus found in bioaerosols and in liquid suspensions. Comparatively, Aspergillus was detected in significant proportions (> 20%) by culture, but only poorly detected by sequencing. To date, no universal efficient DNA extraction method has been defined, and DNA extraction is critical for PCR-dependent analysis (Manian, Sreenivasaprasad, and Mills Citation2001; Fredricks, Smith, and Meier Citation2005; Karakousis et al. Citation2006; White et al. Citation2010). We therefore suppose that the DNA extraction method used here was inefficient with A. niger spores.
Among the “other” fungal strains detected, the genus Davidiella was assigned to several fungal reads in the database (NCBI database for 18S rDNA assignment). Davidiella is a Cladosporium-like genus and the two genera are close from a taxonomical point of view (Braun et al. Citation2003). Data interpretation is dependent on the accuracy of sequencing, and the uniformity of the taxonomic assignment of the databases. Indeed, several reports indicate that the ITS barcode performed poorly at the species rank for fungal communities due to misidentification of fungal sequences, sequencing errors or short reads (Nilsson et al. Citation2009; Ovaskainen et al. Citation2010). However, assigning fungal sequences at the genus rank using the BLASTn method appears to be reliable (Yamamoto et al. Citation2014).
The proportions of fungal strains determined could also be affected by the primers used or by the copy number for 18S rDNA and ITS2 (Bellemain et al. Citation2010).
Taken together, the results presented here show that biodiversity results depend on the methods used to assess it, with effects observed related to the principle of the method (culture vs. sequencing) and to bioinformatics steps. Neither the culture method nor the HTS methods allowed recovery of all fungal strains from liquid cultures and bioaerosols. However, the culture-based method and ITS2 sequencing followed by BLASTn assignment gave complementary results, with both methods providing useful data for a better understanding of the composition of environmental bioaerosols.
4.5. Limitations of the study and scientific benefits
Several limitations should be mentioned with regard to the present study. Firstly, only four fungal species were used to produce the mixed bioaerosols studied. This mixture is not representative of the taxonomic diversity of bioaerosols sampled in real exposure conditions. In such bioaerosols, several hundred fungal species can be present, along with other biological agents (Degois et al. Citation2017). Secondly, we used only a single culture condition (MEA medium and 5-d incubation at 25 °C) to investigate the fungal composition in the mixed cultures and bioaerosol samples. This is not ideal as the culture conditions for microbial communities are known to influence the microbial groups, which will grow; and, indeed, studies have reported that they can affect biodiversity measurements in environmental samples (Duquenne Citation2018). Consequently, the use of other culture conditions (different culture media, temperatures and durations of incubation) in our experiments could have changed the proportions of strains, particularly for slow-growing fungi such as Wallemia. Thus, the study would have been more complete if additional culture conditions were tested. Thirdly, biodiversity results provided by molecular methods were obtained by sequencing fungal DNA extracted using only one method. The FastDNA®SPIN kit for soil (MPBio) used in the study is well known for its reproducibility and its efficiency. However, it appears to have failed to efficiently extract DNA from Aspergillus spores. Indeed, the impact of the DNA extraction method on molecular biology approaches has been extensively described in the literature (Nieguitsila et al. Citation2007; Dannemiller et al. Citation2014; Guo, Yu, and Zhang Citation2015; Kumari and Choi Citation2015). Previous studies carried out on bioaerosols and other matrices showed that PCR results were influenced by the method used to extract nucleic acids from microbial cells (Haugland, Brinkman, and Vesper Citation2002; Hospodsky, Yamamoto, and Peccia Citation2010; Desneux and Pourcher Citation2014). Other studies also highlighted the impact of the DNA extraction method on sequencing results (Feinstein, Sul, and Blackwood Citation2009; Morgan, Darling, and Eisen Citation2010, Vishnivetskaya et al. Citation2014). Thus, other DNA extraction methods could have resulted in different conclusions on the biodiversity of the samples. We are also aware that concentration of the DNA extracts would have increased the limit of detection for the overall biodiversity measurement process. Finally, fungi other than those initially used to compose the liquid microbial consortia were detected in the experimental bioaerosols produced. This could be due to contamination of the generation and sampling (CFCs or filter) equipment, or erroneous sequence assignment. In support of this hypothesis, the composition of the liquid microbial suspension was as expected given the strains added, and thus we suspect slight contamination of the devices used to sample the bioaerosol. In addition, other studies indicated that microbial components, such as glucans, were present on filters despite decontamination before use (Shogren and Park Citation2011). Contamination may occur during DNA extraction, handling of DNA extracts or be the result of cross-contamination during processing for sequencing analysis. This type of contamination is suggested by the detection of Malassezia, which is a yeast generally found on human skin, suggesting human contamination during the process (generation, sample treatment, library preparation) or in the sampling devices (the filters used for sampling were not considered sterile by the supplier). Although negative controls were included, none contained enough DNA for successful sequencing. We were therefore unable to determine the origin of the other fungi detected. Consequently, results and conclusions from the present study should be restricted to the experimental conditions applied in this study.
In spite of these limitations, our study provides a new contribution to current knowledge related to the measurement methods applicable to determine bioaerosol biodiversity, and the technical means required to investigate biases. On one hand, our results provide additional evidence of the complementarity of HTS-based methods and culture-based methods when seeking to accurately describe microbial communities. Recent culture-based studies have triggered renewed interest in these methods when assessing microbial communities (Lagier et al. Citation2015). Indeed, new bacteria never previously described in gut microbiome studies were identified, as well as bacterial strains generally not seen in culture (Lagier et al. Citation2012, Citation2016). On the other hand, microbial consortia were used to produce experimental microbiomes of known composition for biodiversity studies in simulated liquid environments (Coronado et al. Citation2005; Schäfer, Weiß, and Jäckel Citation2017) and in soil (Liebich et al. Citation2007). However, attempts to generate mixed bioaerosols are rare, and the very few published studies reported bioaerosols composed of a mixture of five bacteria (Perrott et al. Citation2017) or one bacterium and one fungus (Forthomme et al. Citation2013). Thus, our fungal model, composed of four different strains generated simultaneously, is an original methodology. Environmental bioaerosols are, naturally, more complex than our model bioaerosol, and the impact of the analytical methods used could be different with a more complex fungal community. Investigations in which realistic aerosols, in terms of composition at the species level, are generated will probably become widespread in the future (Madsen et al. Citation2016).
5. Conclusion
The results of this preliminary study show that several parameters involved in the analytical process (method of identification, DNA extraction, gene targeted for sequencing, and bioinformatics methods applied) considerably affected biodiversity measurements performed on experimental bioaerosols in laboratory conditions. In particular, culture-dependent methods (e.g. identification of cultivable isolates) and culture-independent methods (e.g. ITS2 sequencing followed by BLASTn assignment) returned complementary results and both provided information for a relevant description of microbial communities in bioaerosols. Thus, the present study identified some of the limitations and biases associated with the analytical tools commonly used to assess fungal biodiversity in bioaerosols. Indeed, the DNA extraction is not the only limiting step of the HTS analysis. This is a preliminary step for developing reliable methods and to further optimize each step of the measurement processes, and highlights the need for standardization of measurement methods when performing comparative studies. The use of microbial consortia to produce experimental airborne microbiomes of known composition appears to be a key approach when investigating biases in biodiversity measurement methods. The reproducible and characterized fungal bioaerosols produced, with known and controlled composition allowed a better interpretation of results and understanding of analytical limits than environmental samples of unknown composition. Further investigations regarding methodological biases will be needed to better understand the advantages and limitations of the methods used to measure biodiversity among microbial communities in bioaerosols. For that purpose, the development of experimental airborne microbiomes with graduated complexity should be considered in combination with assays of bioaerosols collected in real exposure conditions.
Supplemental Material
Download MS Word (530.3 KB)Related Research Data
References
- Amann, R., W. Ludwig, and K. Schleifer. 1995. Phylogenetic identification and in situ detection of individual microbial cells without cultivation. Microbiol. Rev. 59 (1):143–69.
- Bellemain, E. T., T. Carlsen, C. Brochmann, E. Coissac, P. Taberlet, and H. Kauserud. 2010. ITS as an environmental DNA barcode for fungi: An in silico approach reveals potential PCR biases. BMC Microbiol. 10 (1):189–98. doi: 10.1186/1471-2180-10-189.
- Braun, U., P. W. Crous, F. Dugan, J. Z. Groenewald, and G. Sybren De Hoog. 2003. Phylogeny and taxonomy of cladosporium-like hyphomycetes, including davidiella gen. nov., the teleomorph of cladosporium s. str. Mycol. Progr. 2 (1):3–18. doi: 10.1007/s11557-006-0039-2.
- Bru-Adan, V., N. Wéry, M. Moletta-Denat, P. Boiron, J.-P. Delgènes, and J.-J. Godon. 2009. Diversity of bacteria and fungi in aerosols during screening in a green waste composting plant. Curr. Microbiol. 59 (3):326–35. doi: 10.1007/s00284-009-9438-3.
- Burton, N. C., S. A. Grinshpun, and T. Reponen. 2007. Physical collection efficiency of filter materials for bacteria and viruses. Ann. Occup. Hyg. 51 (2):143–51. doi: 10.1093/annhyg/mel073.
- Caporaso, J. G., J. Kuczynski, J. Stombaugh, K. Bittinger, F. D. Bushman, E. K. Costello, N. Fierer, A. G. Peña, J. K. Goodrich, J. I. Gordon, et al. 2010. QIIME allows analysis of high-throughput community sequencing data. Nat. Meth. 7 (5):335–36. doi: 10.1038/nmeth.f.303.
- Coronado, J. M., J. Soria, J. C. Conesa, R. Bellod, C. Adán, H. Yamaoka, V. Loddo, and V. Augugliaro. 2005. Photocatalytic inactivation of Legionella pneumophila and an aerobic bacteria consortium in water over TiO2/SiO2 fibres in a continuous reactor. Top. Catal. 35 (3–4):279–86. doi: 10.1007/s11244-005-3835-z.
- Dannemiller, K. C., D. Reeves, K. Bibby, N. Yamamoto, and J. Peccia. 2014. Fungal high-throughput taxonomic identification tool for use with next-generation sequencing (FHiTINGS). J. Basic Microbiol. 54 (4):315–21. doi: 10.1002/jobm.201200507.
- Dannemiller, K. C., N. Lang-Yona, N. Yamamoto, Y. Rudich, and J. Peccia. 2014. Combining real-time PCR and next-generation DNA sequencing to provide quantitative comparisons of fungal aerosol populations. Atmos. Environ. 84:113–21. doi: 10.1016/j.atmosenv.2013.11.036.
- Degois, J., F. Clerc, X. Simon, C. Bontemps, P. Leblond, and P. Duquenne. 2017. First metagenomic survey of the microbial diversity in bioaerosols emitted in waste sorting plants. Ann. Work Expos. Health 61 (9):1076–86. doi: 10.1093/annweh/wxx075.
- Desneux, J., and A. M. Pourcher. 2014. Comparison of DNA extraction kits and modification of DNA elution procedure for the quantitation of subdominant bacteria from piggery effluents with real-time PCR. Microbiol. Open 3 (4):437–45. doi: 10.1002/mbo3.178.
- Ding, W., L. Li, Y. Han, J. Liu, and J. Liu. 2016. Site-related and seasonal variation of bioaerosol emission in an indoor wastewater treatment station: Level, characteristics of particle size, and microbial structure. Aerobiologia 32 (2):211–24. doi: 10.1007/s10453-015-9391-5.
- Douwes, J., P. Thorne, N. Pearce, and D. Heederik. 2003. Bioaerosol health effects and exposure assessment: Progress and prospects. Ann. Occup. Hyg. 47 (3):187–200. doi: 10.1093/annhyg/meg032.
- Duquenne, P. 2018. On the identification of culturable microorganisms for the assessment of biodiversity in bioaerosols. Ann. Work Expos. Health 62 (2):139–46. doi: 10.1093/annweh/wxx096.
- Duquenne, P., G. Marchand, and C. Duchaine. 2013. Measurement of endotoxins in bioaerosols at workplace: A critical review of literature and a standardization issue. Ann. Occup. Hyg. 57 (2):137–72. doi: 10.1093/annhyg/mes051.
- Duquenne, P., X. Simon, V. Koehler, S. Goncalves-Machado, G. Greff, T. Nicot, and P. Poirot. 2012. Documentation of bioaerosol concentrations in an indoor composting facility in France. J. Environ. Monit. 14 (2):409–19. doi: 10.1039/c2em10714g.
- Dyląg, M. 2017. Fungi present in home and their impact on human health - A short review. Insights Biol. Med. 1:16–25.
- Edgar, R. C., B. J. Haas, J. C. Clemente, C. Quince, and R. Knight. 2011. UCHIME improves sensitivity and speed of chimera detection. Bioinformatics 27 (16):2194–200. doi: 10.1093/bioinformatics/btr381.
- Fahlgren, C., G. Bratbak, R.-A. Sandaa, R. Thyrhaug and U. L. Zweifel. 2010. Diversity of airborne bacteria in samples collected using different devices for aerosol collection. Aerobiologia 27 (2):107–20. doi: 10.1007/s10453-010-9181-z.
- Feinstein, L. M., W. J. Sul, and C. B. Blackwood. 2009. Assessment of bias associated with incomplete extraction of microbial DNA from soil. Appl. Environ. Microbiol. 75 (16):5428–33. doi: 10.1128/AEM.00120-09.
- Flannigan, B. 1997. Air sampling for fungi in indoor environments. J. Aerosol Sci. 28 (3):381–92. doi: 10.1016/S0021-8502(96)00441-7.
- Forthomme, A., Y. Andres, A. Joubert, X. Simon, P. Duquenne, D. Bemer, and F. Le Coq. 2013. Evolution of microbial aerosol behaviour in heating, ventilating and air-conditioning systems – Quantification of Staphylococcus epidermidis and penicillium oxalicum viability. Environ. Technol. 34 (8):993–97. doi: 10.1080/09593330.2012.728731.
- Fredricks, D. N., C. Smith, and A. Meier. 2005. Comparison of six DNA extraction methods for recovery of fungal DNA as assessed by quantitative PCR. J. Clin. Microbiol. 43 (10):5122–28. doi: 10.1128/JCM.43.10.5122-5128.2005.
- Fung, F., and W. G. Hughson. 2003. Health effects of indoor fungal bioaerosol exposure. Appl. Occup. Environ. Hygiene 18 (7):535–44. doi: 10.1080/10473220301451.
- Guo, H., Z. Yu, and H. Zhang. 2015. Phylogenetic diversity of microbial communities associated with coalbed methane gas from Eastern ordos basin, China. Int. J. Coal Geol. 150–151:120–6. doi: 10.1016/j.coal.2015.08.012.
- Haig, C. W., W. G. Mackay, J. T. Walker, and C. Williams. 2016. Bioaerosol sampling: Sampling mechanisms, bioefficiency and field studies. J. Hosp. Infect. 93 (3):242–55. doi: 10.1016/j.jhin.2016.03.017.
- Haugland, R. A., J. L. Heckman and L. J. Wymer. 1999. Evaluation of different methods for the extraction of DNA from fungal conidia by quantitative competitive PCR analysis. Journal of Microbiological Methods 37 (2):165–76. doi: 10.1016/S0167-7012(99)00061-5.
- Haugland, R. A., N. Brinkman, and S. J. Vesper. 2002. Evaluation of rapid DNA extraction methods for the quantitative detection of fungi using real-time PCR analysis. J. Microbiol. Meth. 50 (3):319–23. doi: 10.1016/S0167-7012(02)00037-4.
- Heidelberg, J. F., M. Shahamat, M. Levin, I. Rahman, G. Stelma, C. Grim, and R. R. Colwell. 1997. Effect of aerosolization on culturability and viability of gram-negative bacteria. Appl. Environ. Microbiol. 63:3585–88.
- Hoisington, A. J., J. P. Maestre, M. D. King, J. A. Siegel, and K. A. Kinney. 2014. Impact of sampler selection on the characterization of the indoor microbiome via high-throughput sequencing. Build. Environ. 80:274–82. doi: 10.1016/j.buildenv.2014.04.021.
- Hongxia, X. W., T. Reponen, A. Adhikari, K. Willeke, and S. A. Grinshpun. 2004. Effect of fluid type and microbial properties on the aerosolization of microorganisms from metalworking fluids. Aerosol Sci. Technol. 38 (12):1139–48. doi: 10.1080/027868290891488.
- Hospodsky, D., N. Yamamoto, and J. Peccia. 2010. Accuracy, precision, and method detection limits of quantitative PCR for airborne bacteria and fungi. Appl. Environ. Microbiol. 76 (21):7004–12. doi: 10.1128/AEM.01240-10.
- Jankowska, E., T. Reponen, K. Willeke, S. A. Grinshpun, and K. J. Choi. 2000. Collection of fungal spores on air filters and spore reentrainment from filters into air. J. Aerosol Sci. 31 (8):969–78. doi: 10.1016/S0021-8502(00)00017-3.
- Jung, J. H., C. H. Lee, J. E. Lee, J. H. Lee, S. S. Kim, and B. U. Lee. 2009. Design and characterization of a fungal bioaerosol generator using multi-orifice air jets and a rotating substrate. J. Aerosol Sci. 40 (1):72–80. doi: 10.1016/j.jaerosci.2008.09.002.
- Kanaani, H., M. Hargreaves, J. Smith, Z. Ristovski, V. Agranovski, and L. Morawska. 2008. Performances of UVAPS with respect to detection of airborne fungi. J. Aerosol Sci. 39 (2):175–89. doi: 10.1016/j.jaerosci.2007.10.007.
- Karakousis, A., L. Tan, D. Ellis, H. Alexiou, and P. J. Wormald. 2006. An assessment of the efficiency of fungal DNA extraction methods for maximizing the detection of medically important fungi using PCR. J. Microbiol. Meth. 65 (1):38–48. doi: 10.1016/j.mimet.2005.06.008.
- Kristiansen, A., A. M. Saunders, A. A. Hansen, P. H. Nielsen, and J. L. Nielsen. 2012. Community structure of bacteria and fungi in aerosols of a pig confinement building. FEMS Microbiol. Ecol. 80 (2):390–401. doi: 10.1111/j.1574-6941.2012.01305.x.
- Kumari, P., and H. Choi. 2015. Manure removal system influences the abundance and composition of airborne biotic contaminants in swine confinement buildings. Environ. Monit. Assess. 187 (8):1–10. doi: 10.1007/s10661-015-4759-0.
- Lagier, J., F. Armougom, M. Million, P. Hugon, I. Pagnier, C. Robert, F. Bittar, G. Fournous, G. Gimenez, M. Maraninchi, et al. 2012. Microbial culturomics: Paradigm shift in the human gut microbiome study. Clin. Microbiol. Infect. 18 (12):1185–93. doi: 10.1111/1469-0691.12023.
- Lagier, J. C., P. Hugon, S. Khelaifia, P. E. Fournier, B. La Scola, and D. Raoult. 2015. The rebirth of culture in microbiology through the example of culturomics to study human gut microbiota. Clin. Microbiol. Rev. 28 (1):237–64. doi: 10.1128/CMR.00014-14.
- Lagier, J. C., S. Khelaifia, M. T. Alou, S. Ndongo, and N. Dione. 2016. Culture of previously uncultured members of the human gut microbiota by culturomics. Nat. Microbiol. 1: article 16203.
- Lee, B. U., S. H. Kim, and S. S. Kim. 2002. Hygroscopic growth of E. coli and B. subtilis bioaerosols. J. Aerosol Sci. 33 (12):1721–23. doi: 10.1016/S0021-8502(02)00114-3.
- Liebich, J., M. Schloter, A. Schäffer, H. Vereecken, and P. Burauel. 2007. Degradation and humification of maize straw in soil microcosms inoculated with simple and complex microbial communities. Eur. J. Soil Sci. 58 (1):141–51. doi: 10.1111/j.1365-2389.2006.00816.x.
- Madsen, A. M., S. T. Larsen, I. K. Koponen, K. I. Kling, A. Barooni, D. G. Karottki, K. Tendal, and P. Wolkoff. 2016. Generation and characterization of indoor fungal aerosols for inhalation studies. Appl. Environ. Microbiol. 82 (8):2479–93. doi: 10.1128/AEM.04063-15.
- Manian, S., S. Sreenivasaprasad, and P. R. Mills. 2001. DNA extraction method for PCR in mycorrhizal fungi. Lett. Appl. Microbiol. 33 (4):307–10. doi: 10.1046/j.1472-765X.2001.01001.x.
- Mbareche, H., E. Brisebois, M. Veillette, and C. Duchaine. 2017. Bioaerosol sampling and detection methods based on molecular approaches: No pain no gain. Sci. Total Environ. 599:2095–104. doi: 10.1016/j.scitotenv.2017.05.076.
- Morgan, J. L., A. E. Darling, and J. A. Eisen. 2010. Metagenomic sequencing of an in vitro-simulated microbial community. PLoS One. 5 (4):e10209. doi: 10.1371/journal.pone.0010209.
- Nieguitsila, A., M. Deville, T. Jamal, L. Halos, M. Berthelemy, R. Chermette, S. Latouche, P. Arné, and J. Guillot. 2007. Evaluation of fungal aerosols using temporal temperature gradient electrophoresis (TTGE) and comparison with culture. J. Microbiol. Meth. 70 (1):86–95. doi: 10.1016/j.mimet.2007.03.021.
- Nilsson, R. H., M. Ryberg, K. Abarenkov, E. Sjökvist, and E. Kristiansson. 2009. The ITS region as a target for characterization of fungal communities using emerging sequencing technologies. FEMS Microbiol. Lett. 296 (1):97–101. doi: 10.1111/j.1574-6968.2009.01618.x.
- Ovaskainen, O.,. J. Nokso-Koivisto, J. Hottola, T. Rajala, T. Pennanen, H. Ali-Kovero, O. Miettinen, P. Oinonen, P. Auvinen, L. Paulin, K.-H. Larsson, and R. Mäkipää. 2010. Identifying wood-inhabiting fungi with 454 sequencing – What is the probability that BLAST gives the correct species?. Fungal Ecol. 3 (4):274–83. doi: 10.1016/j.funeco.2010.01.001.
- Perrott, P.,. N. Turgeon, L. Gauthier-Levesque, and C. Duchaine. 2017. Preferential aerosolization of bacteria in bioaerosols generated in vitro. J. Appl. Microbiol. 123 (3):688–97. doi: 10.1111/jam.13514.
- Raper, K. B., and D. I. Fennell. 1965. The genus aspergillus. Baltimore, MA: Williams & Wilkins Company, 686 p.
- Reponen, T. 2011. Methodologies for assessing bioaerosol exposures. In Encyclopedia of environmental health, ed. E.-I.-C. J. O. Nriagu, 722–30. Burlington: Elsevier.
- Reponen, T., K. Willeke, S. Grinshpun, and A. Nevalainen. 2011. Biological particle sampling. In Aerosols measurement – Principles, techniques and applications, 3rd ed., ed. P. Kulkani, P. A. Baron, and K. Willeke, 549–70. New York, NY: A John Willey & Sons, Inc.
- Reponen, T., K. Willeke, V. Ulevicius, A. Reponen, and S. A. Grinshpun. 1996. Effect of relative humidity on the aerodynamic diameter and respiratory deposition of fungal spores. Atmos. Environ. 30 (23):3967–74. doi: 10.1016/1352-2310(96)00128-8.
- Samson, R. A., E. Hoekstra, J. C. Friswald, and O. Filtenborg. 1995. Introduction to foodborne fungi, 3rd ed. Baarn, Delft: Centraalbureau voor Schimmelcultures, The Netherlands.
- Schäfer, J., S. Weiß, and U. Jäckel. 2017. Preliminary validation of a method combining cultivation and cloning-based approaches to monitor airborne bacteria. Ann. Work Expos. Health 61 (6):633–42. doi: 10.1093/annweh/wxx038.
- Scheermeyer, E., and I. E. Agranovski. 2009. Design and evaluation of a new device for fungal spore aerosolization for laboratory applications. J. Aerosol Sci. 40 (10):879–89. doi: 10.1016/j.jaerosci.2009.06.003.
- Schloss, P. D., S. L. Westcott, T. Ryabin, J. R. Hall, M. Hartmann, E. B. Hollister, R. A. Lesniewski, B. B. Oakley, D. H. Parks, C. J. Robinson, et al. 2009. Introducing mothur: Open-source, platform-independent, community-supported software for describing and comparing microbial communities. Appl. Environ. Microbiol. 75 (23):7537–41. doi: 10.1128/AEM.01541-09.
- Shogren, E. S., and J. H. Park. 2011. Pre-sampling contamination of filters used in measurements of airborne (1,3)-beta-d-glucan based on glucan-specific limulus amebocyte lysate assay. J. Environ. Monit. 13 (4):1082–87. doi: 10.1039/c0em00495b.
- Simon, X., and P. Duquenne. 2013. Feasibility of generating peaks of bioaerosols for laboratory experiments. Aerosol Air Qual. Res. 13 (3):877–86. doi: 10.4209/aaqr.2012.12.0340.
- Simon, X., P. Duquenne, V. Koehler, C. Piernot, C. Coulais, and M. Faure. 2011. Aerosolisation of Escherichia coli and associated endotoxin using an improved bubbling bioaerosol generator. J. Aerosol Sci. 42 (8):517–31. doi: 10.1016/j.jaerosci.2011.05.002.
- Tolvanen, O. K. 2001. Airborne bio-aerosols and noise in a dry waste treatment plant in pietarsaari, Finland. Waste Manag. Res. 19 (2):108–14. doi: 10.1177/0734242X0101900203.
- Vishnivetskaya, T. A., A. C. Layton, M. C. Y. Lau, A. Chauhan, K. R. Cheng, A. J. Meyers, J. R. Murphy, A. W. Rogers, G. S. Saarunya, D. E. Williams, et al. 2014. Commercial DNA extraction kits impact observed microbial community composition in permafrost samples. FEMS Microbiol. Ecol. 87 (1):217–30. doi: 10.1111/1574-6941.12219.
- Wang, C.-H., B. T. Chen, B.-C. Han, A. C.-Y. Liu, P.-C. Hung, C.-Y. Chen, and H. J. Chao. 2015. Field evaluation of personal sampling methods for multiple bioaerosols. PLoS ONE. 10 (3):e0120308. doi: 10.1371/journal.pone.0120308.
- Wang, Q., G. M. Garrity, J. M. Tiedje, and J. R. Cole. 2007. Naïve bayesian classifier for rapid assignment of rRNA sequences into the new bacterial taxonomy. Appl. Environ. Microbiol. 73 (16):5261–67. doi: 10.1128/AEM.00062-07.
- White, P. L., M. D. Perry, J. Loeffler, W. Melchers, L. Klingspor, S. Bretagne, E. McCulloch, M. Cuenca-Estrella, N. Finnstrom, J. P. Donnelly, and R. A. Barnes. 2010. Critical stages of extracting DNA from Aspergillus fumigatus in whole-blood specimens. J. Clin. Microbiol. 48 (10):3753–55. doi: 10.1128/JCM.01466-10.
- Yamamoto, N., K. C. Dannemiller, K. Bibby, and J. Peccia. 2014. Identification accuracy and diversity reproducibility associated with internal transcribed spacer-based fungal taxonomic library preparation. Environ. Microbiol. 16 (9):2764–76. doi: 10.1111/1462-2920.12338.
- Yoo, K., T. K. Lee, E. J. Choi, J. Yang, S. K. Shukla, S-I Hwang, and J. Park. 2017. Molecular approaches for the detection and monitoring of microbial communities in bioaerosols: A review. J. Environ. Sci. 51:234–47. doi: 10.1016/j.jes.2016.07.002.
- Zalar, P., G. Sybren de Hoog, H. J. Schroers, J. M. Frank, and N. Gunde-Cimerman. 2005. Taxonomy and phylogeny of the xerophilic genus wallemia (Wallemiomycetes and wallemiales, cl. et ord. nov.). Antonie Van Leeuwenhoek. 87 (4):311–28. doi: 10.1007/s10482-004-6783-x.
- Zeng, Q. Y., S. O. Westermark, Å. Rasmuson-Lestander, And, and X. R. Wang. 2004. Detection and quantification of wallemia sebi in aerosols by real-time PCR, conventional PCR, and cultivation. Appl. Environ. Microbiol. 70 (12):7295–302. doi: 10.1128/AEM.70.12.7295-7302.2004.