
 ?Mathematical formulae have been encoded as MathML and are displayed in this HTML version using MathJax in order to improve their display. Uncheck the box to turn MathJax off. This feature requires Javascript. Click on a formula to zoom.
Abstract
The louvered 16.7 L min−1 PM10 inlet is commonly used in PM10 and PM2.5 FRM samplers or FEM monitors. Its sampling efficiency is influenced by particle bounce, re-entrainment, and overloading since the PM10 inlet contains a PM10 impactor with an uncoated impaction surface. In this study, a modified PM10 (M-PM10) inlet with an oil-soaked glass fiber filter substrate supported by an oil-soaked porous metal disc was developed to eliminate the particle bounce and overloading effects. The oiled M-PM10 inlet and the traditional PM10 inlets with and without grease coating were collocated at the field for long-term comparison tests. The results show that the traditional uncoated PM10 inlet which is cleaned initially but not cleaned daily afterwards oversamples PM10 concentration after one 24-h sampling day and has the high positive average sampling bias during 14 sampling days due to particle bounce and re-entrainment. The grease-coated PM10 inlet without daily cleaning shows a better performance with a smaller sampling bias, but it still oversamples PM10 concentrations after the first three 24-h sampling days and then undersamples after 10 sampling days due to particle bounce and overloading effects, respectively. In comparison, the M-PM10 inlet shows a good performance with a small average sampling bias during 35 sampling days since vacuum oil wicks up through the deposit to eliminate particle bounce and overloading. It is suggested that the oiled M-PM10 inlet can be used to replace the traditional EPA PM10 inlet and for long-term sampling of over 1 month without the frequent maintenance need.
Copyright © 2019 American Association for Aerosol Research
1. Introduction
PM10 and PM2.5 (particles with aerodynamic diameter ≤10 and ≤2.5 µm, respectively) are among regulated air quality metrics because they can deposit in the tracheobronchial and alveolar regions and pose health risks to humans (Rückerl et al. Citation2011). To determine the compliance with the national air quality standard, PM10 and PM2.5 concentrations are measured by using federal reference method (FRM) samplers or federal equivalent method (FEM) monitors, each of which consists of a size-selective inlet followed normally by a filter to collect particles for further analysis (Chow and Watson Citation2008). The low-volume PM10 inlet with the flow rate of 16.7 L min−1 is one of the most widely deployed inlets in FRM and FEM devices for aspirating and classifying particles smaller than 10 µm in aerodynamic diameter (US EPA Citation2017). It is because that the low-volume PM10 inlet is low cost, light weight, small footprint, and portability (Chow and Watson Citation2008). The low-volume PM10 inlet is first developed by McFarland and Ortiz (Citation1984), which is called “flat-topped” PM10 inlet, and subsequently modified by Tolocka et al. (Citation2001), which is called “louvered” PM10 inlet, to become an EPA-approved (Environmental Protection Agency) PM10 inlet. The louvered PM10 inlet, henceforth referred to as “PM10 inlet,” is designed to have the cut-size (dpa50, aerodynamic diameter corresponding to 50% of the sampling efficiency) of 10 ± 0.5 µm and the sharpness of the sampling efficiency curve (calculated as the square root of dpa16/dpa84) of 1.5 ± 0.1 (Wang et al. Citation2005; US EPA Citation2017). The sampling efficiency of the PM10 inlet is determined mainly by the classification ability of its lower part, a single-nozzle PM10 impactor. While its upper part, an aspirator, helps aspirate the representative aerosol sample in the ambient air and remove some insects, rain, snow, airborne debris, water droplets and very-large particles to protect the impactor from high mass loading and severe ambient conditions (Liu and Pui Citation1981; McFarland and Ortiz Citation1984; Tolocka et al. Citation2001; Vanderpool et al. Citation2018).
The performance characteristic of the PM10 inlet should match with the requirements of 40 CFR Part 53 (US EPA Citation2017). However, several studies found that the PM10 inlet has uncertainty in the measured sampling efficiency. Buser et al. (Citation2008) indicated that the PM10 inlet oversampled PM10 concentration as compared to the highest theoretical PM10 concentration which was the product of the particle size distribution (PSD) and the characteristic of PM10 inlet with the cut-size of 10.5 µm and the curve sharpness of 1.6. It is because that the PM10 inlet was used to sample the agricultural particles (cotton gins) which had a high fraction of large particles. Wang et al. (Citation2005) also revealed that the sampling performance of the PM10 inlet varied with the various particle sources. Similarly, Park et al. (Citation2009) found that when the sampling source was fly ash which represented the industrial particles the measured PM10 concentrations of the PM10 inlet were higher than those of the Andersen cascade impactor, but no explanation was given. Faulkner, Smith, and Haglund (Citation2014) explained that a small fraction of particles larger than the cut-size in the measured PM10 concentrations could cause a significant positive error when large particles were dominant in sampling particle sources. Watson et al. (Citation2011) showed that the BGI PQ200 sampler equipped with the PM10 inlet was equivalent to a high-volume (Hi-Vol) PM10 sampler when sampling ambient aerosols. However, the PM10 inlet undersampled PM10 concentrations after sampling for a few days at the source-dominated environment with a high TSP/PM10 ratio (total suspended particulates).
The overestimation and underestimation of the PM10 inlet could be due to particle bounce and re-entrainment, and particle overloading of the PM10 impactor (Wang et al. Citation2005; Buser et al. Citation2008; Zhao et al. Citation2009). The PM10 inlet contains a PM10 impactor with an uncoated surface which may not absorb the kinetic energy of incoming particles completely resulting in the particle bounce of large particles (John, Winklmayr, and Wang Citation1991; John and Wang Citation1991; Tsai and Cheng Citation1995; Peters, Vanderpool, and Wiener Citation2001). Moreover, if the uncoated impaction surface is not cleaned regularly, the deposited particles which do not stick well on the uncoated surface can be de-agglomerated and re-entrained to the downstream leading to oversampling (Rao and Whitby Citation1978; John, Winklmayr, and Wang Citation1991). Then, if more particles are accumulated on the substrate to form a particle mound, the cut-size of the impactor is reduced due to the particle overloading effect resulting in undersampling. These effects observed in the PM2.5 well impactor ninety-six (WINS, Vanderpool et al. Citation2001; Le and Tsai Citation2017) are also expected to occur in the PM10 inlet which contains the PM10 impactor. Although the likelihood of the impaction-well like design helps the PM10 impactor eliminate the initial particle bounce in the wind tunnel study with monodisperse particles (Kim, Kim, and Lee Citation1998; Tolocka et al. Citation2001), the particle bounce and loading effects of the PM10 inlet have never been addressed and tested fully in the field study. Moreover, it is necessary to determine the routine cleaning frequency for the PM10 inlet to maintain its good sampling performance. But for the long-term sampling need, it takes lots of man power if the cleaning frequency is too high. In addition, disassembling the PM10 inlet for cleaning is hard since the inlet cylinder is big (diameter = 69.3 mm) with a very tight screw junction. Therefore, for the long-term monitoring and sampling need, it is desirable that the PM10 inlet should not be cleaned too frequently.
Some impactors are designed to overcome the particle bounce and overloading effects for unattended, continuous operation. The application of viscous substrate coating such as grease on the impaction surface of an inertial impactor has been studied earlier (Rao and Whitby Citation1978; Turner and Hering Citation1987). Since the impaction surface is coated with a thin layer of grease, the impactor can eliminate the initial particle bounce successfully, but the particle bounce still occurs when the particles impact on the first several layers of the deposited particles formed on the substrate after a few sampling days (John, Winklmayr, and Wang Citation1991; John and Wang Citation1991; Tsai and Cheng Citation1995; Tsai and Lin Citation2000; Zhao et al. Citation2009). The impactor with the oil-soaked impaction substrate is widely used to replace the impactor with the grease-coated substrate since vacuum oil with low viscosity (30–300 mm2 s−1) can wick up through the deposit to capture particles more readily (Turner and Hering Citation1987; Peters, Vanderpool, and Wiener Citation2001; Tsai et al. Citation2012). Filter mats, such as membrane filter and glass fiber filter (GFF), are usually used as the substrate to retain vacuum oil. Based on the design of inverted conical cavity of Tsai and Cheng (Citation1995), an impaction well is used to contain a given amount of oil to prevent the oil from drying (Peters, Vanderpool, and Wiener Citation2001). Based on the design of the well impactor of Peters, Vanderpool, and Wiener (Citation2001), Le and Tsai (Citation2017) developed a non-bouncing PM2.5 impactor in which a small amount of water is injected upward to wash the deposited particles off the impaction surface to avoid particle overloading. The porous metal substrate is used to reduce particle bounce and increase the particle loading capacity, but the cut-size is decreased, and the curve is less sharp due to air penetration into the pores of the porous metal disc (Huang, Tsai, and Shih Citation2001; Huang et al. Citation2005; Huang and Tsai Citation2003; Marjamäki and Keskinen Citation2004). If the pores are filled with vacuum oil, the cut-size and the curve sharpness may not be changed, but these remain to be studied. In summary, if the impaction surface is designed in such a way that the kinetic energy of the incident particle can be absorbed, the particle bounce effect can be minimized. In addition, the ability to capture more particles without particle overloading effect is likely if a particle mound does not form.
The accuracy of the PM10 inlet is also affected by the performance of the aspiration section of the PM10 inlet as shown in previous studies (Liu and Pui Citation1981; Kenny et al. Citation2005; Vanderpool et al. Citation2018). Kenny et al. (Citation2005) revealed that aspirated particles were lost on the louvered plate of the aspirator (particle settling, inertial deposition, and diffusion) which varied from 58% to 92% depending on the mass median aerodynamic diameter (MMAD, from 13 to 46 µm) but was independent of the wind speeds (1.8 km h−1 and 3.6 km h−1). Vanderpool et al. (Citation2018) reported that the performance of the aspirator was affected by the wind speeds (2, 8, and 24 km h−1) and particle sizes. The results of the wind tunnel test showed that the sampling effectiveness of the aspirator was increased when the wind speed was increased from 2 to 8 km h−1. The situation at the wind speed of 24 km h−1 was complicated since the sampling effectiveness was higher than 100% when particles were smaller than 14 µm, but it became lower than that at 8 km h−1 for particles ranging from 14 to 30 µm. Tolocka et al. (Citation2001) tested the PM10 inlet with the aspirator and the impactor and showed that the cut-sizes (9.9, 10.3, and 9.9 µm) were not different regardless of the wind speeds of 2, 8, and 24 km h−1. However, the sampling efficiency curve became sharper if the wind speed was higher than 8 km h−1 (sharpness = 1.4, 1.38, and 1.31 corresponding 2, 8, and 24 km h−1, respectively). Liu and Pui (Citation1981) also showed that the sampling characteristic of the PM10 inlet was independent of the wind speed up to 9 km h−1.
To decrease particle bounce and increase particle loading capacity, this study developed a modified PM10 (M-PM10) inlet in which an oil-soaked GFF substrate supported by an oil-soaked porous metal disc (PMD) is used to replace the uncoated impaction surface used in the traditional PM10 inlet. The uncoated PM10 inlet which was cleaned initially but not cleaned daily afterwards (i.e., uncleaned, uncoated inlet) was first tested at the field for examining the particle bounce and re-entrainment effects for 14 days (period #1) as compared to the reference PM10 inlet which was cleaned daily and coated with grease (cleaned, greased inlet). The traditional uncleaned, greased inlet was then tested for the particle bounce and overloading effects for 16 days (period #2) and 23 days (period #3), respectively. Finally, the M-PM10 inlet was tested to evaluate the sampling performance for 23 days (period #3) and 35 days (period #4).
2. Experimental method
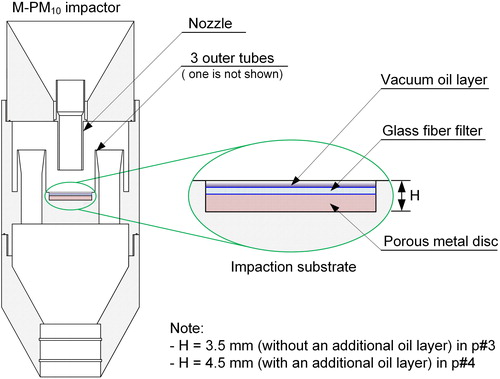
shows the schematic diagram of the modified PM10 (M-PM10) impactor with an oil-soaked GFF substrate supported by a PMD. A circular cavity (diameter (D) × depth (H) = 25 × 4.5 mm or 25 × 3.5 mm) is drilled at the center of the impaction plate to contain the 25-mm PMD and the GFF. A small amount of vacuum oil of 1.3 mL (TT-DM-100, Lisons Chemical Co., Ltd., Taiwan) for the cavity depth of 4.5 mm is added to fill up the cavity. The oil-soaked GFF substrate is expected to overcome particle bounce and capture more particles as the oil with low viscosity (∼100 mm2 s−1) can be retained on the GFF against air flow very well and wick up through the particle deposit to maintain a viscous impaction surface. The PMD is used to enhance the capillary action and increase the particle loading on the substrate. The M-PM10 impactor with the new impaction substrate as well as the conventional PM10 impactors were first tested at the laboratory for determining the cut-size and the penetration curve sharpness and then at the field after assembling with the aspirator section for evaluating the sampling performance.
Figure 1. Schematic diagram of the M-PM10 impactor.
2.1. Laboratory tests
The schematic diagram of the experimental setup for determining the penetration curve of the PM10 impactor is shown in . In this study, the penetration curves of the impactors were then combined with the sampling effectiveness of the aspirator from the wind tunnel test resulted by Vanderpool et al. (Citation2018) to obtain the sampling efficiency curves of the PM10 inlet whose estimated biases were then calculated.
Figure 2. Experimental setup of the particle penetration test.
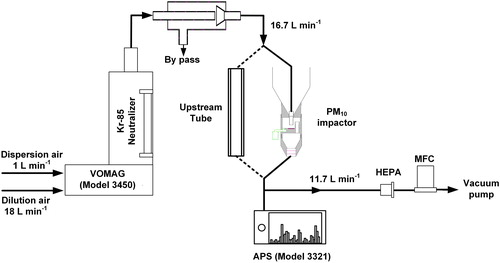
The detailed experimental method is described in Section A1 of the online supplemental information (SI). Only the impactor section (the PM10 inlet without the aspirator) was tested, which was a static test instead of the wind tunnel test which is required for testing the PM10 inlet (US EPA Citation2017). Briefly, the test was carried out using a Vibrating Orifice Aerosol Generator (VOAG, TSI Model 3450, USA) to generate monodisperse solid ammonium fluorescein (AF; the particle density is 1.35 g cm−3) particles with 19 discrete particle sizes ranging from 5.0 to 19.8 µm (Vanderpool and Rubow Citation1988). An aerodynamic particle sizer (APS, TSI model 3321, USA) was used to measure the particle number concentration passing through a metal tube (upstream) and the impactor (downstream). The penetration (P, %) of the impactor for each particle aerodynamic diameter is calculated as
(1)
(1)
where Cup and Cdown are the upstream and downstream aerosol number concentrations (# cm−3), respectively. The discrete penetration data were fitted by using EquationEquation (2)
(2)
(2) to determine the dpa50, dpa16, and dpa84 to calculate the sharpness of the penetration curve (Peters, Vanderpool, and Wiener Citation2001; Le and Tsai Citation2017) as
(2)
(2)
where a, b, c, d, and e are fitting parameters. The sampling efficiency (η, %) of the PM10 inlet is calculated as follows:
(3)
(3)
where Ea (%) is the sampling effectiveness of the aspirator obtained from the previous study by Vanderpool et al. (Citation2018). The estimated PM10 concentrations of the PM10 inlet were then calculated to determine the estimated biases based on the ideal particle distributions (US EPA Citation2017) (see Section A1 of the SI).
2.2. Field comparison tests
The field comparison tests of the PM10 samplers equipped with different PM10 inlets were conducted at National Chiao Tung University (NCTU) from November 2017 to October 2018. The sampling station was located on the 6th floor of the building of the Institute of Environmental Engineering (IEV) at NCTU which is about 1 km away from the roads. Samplers were set up at the same height (2 m from the platform of the station), and all samplers were spaced less than 2 m from each other. During the sampling period, temperature (T), relative humidity (RH), and wind speed (WS) ranged from 13 to 33 °C, 57 to 88%, and 2.4 to 15.2 km h−1 (0.67 to 4.2 m s−1), respectively.
Four PM10 samplers each of which contains a filter cassette with a 37 mm Teflon filter (Teflo R2PL037, Pall Corp., New York, USA) were collocated. The sampling flow rate of each of the four samplers was controlled by a mass flow controller (MFC). Four PM10 inlets are: one standard PM10 inlet (Model 20XXA457780712, Thermo Sci., USA) and three other PM10 inlets manufactured in China (Model B2151250015, Focused Photonics Inc., China). One of the Chinese PM10 inlets was modified to be the M-PM10 inlet with the oiled impaction substrate while the other three PM10 inlets remained to have the traditional flat impaction surface. The filters were conditioned before and after sampling with the procedure described in Section A2 of the SI. Four cleaned PM10 inlets which were an oiled M-PM10 inlet and three conventional PM10 inlets coated with grease to eliminate the initial particle bounce were first tested for five 24-h sampling days to evaluate the sampling performance of the Chinese PM10 inlets based on the reference EPA PM10 inlet.
Then, based on the traditional PM10 inlet with grease coating and daily cleaning (i.e., cleaned, greased inlet), the traditional PM10 inlet which was cleaned initially but not cleaned daily afterwards, and not coated with grease (i.e., uncleaned, uncoated inlet) was tested in period #1 for 14 days to examine the particle bounce and re-entrainment effects. Next, the traditional inlet which was coated with a thin layer of grease and not cleaned daily (i.e., uncleaned, greased PM10 inlet) was tested in 2 periods (period #2: 16 days and period #3: 23 days) to evaluate the particle bounce and overloading effects. In period #2, the performance of the uncleaned, greased PM10 inlet was evaluated based on the cleaned, greased PM10 inlet as the reference for 16 sampling days. In period #3, the uncleaned, greased PM10 inlet was tested for a longer period of 23 days at higher PM10 concentrations. Meanwhile, the prototype of the oiled M-PM10 inlet (cavity depth H = 3.5 mm, oil amount = 1.0 mL) was also tested in period #3 for 23 days based on the cleaned, greased inlet as the reference to evaluate the sampling performance. Since the oil of the M-PM10 inlet was found to be blown off the GFF after 6 days during period #3, the M-PM10 inlet with a deeper cavity (H = 4.5 mm, oil amount = 1.3 mL) was tested over a longer period of 35 days (period #4) to examine if the oil blowing off problem found in period #3 was resolved. In period #4, the PM10 concentrations of the 24-h samples were measured daily in the first 5 days, then the sampling pumps were kept running for sampling but without sampling filters for 4–7 days before measuring 24-h average PM10 concentration again for 1–3 days. During the non-sampling period of 4–7 days, particles larger than PM10 were loaded on the impactor of the PM10 inlet continuously to increase the particle loaded mass while PM10 particles were filtered by a HEPA filter before the sampling pump.
After the tests of period #2 and #3 were over, the uncleaned PM10 inlets (greased and oiled) were tested for the cut-size and the penetration curve in the laboratory following the method described in the previous section. Both M-PM10 (H = 4.5 mm) and uncleaned, greased inlets were also tested every 6 h, twice every day, and continued for 8 days which is equivalent to four 24-h sampling days. The purpose of this test is to find out exactly when particle bounce starts to occur in the uncleaned, greased inlet. The results of this test are shown in details in Section B3 of the SI.
3. Results and discussion
3.1. Laboratory results of the sampling efficiency of cleaned PM10 inlets
The PM10 impactor parts of three PM10 inlets with different impaction substrates (traditional uncoated, traditional greased, and oiled M-PM10 impactors) were tested for the penetration curve in the laboratory. The sampling efficiencies of the PM10 inlets were then calculated using EquationEquation (3)(3)
(3) and compared to those of the traditional uncoated PM10 inlet in Tolocka et al. (Citation2001). shows the particle penetrations of the three cleaned PM10 impactors (uncoated, greased, and oiled). The results show that the cut-size of the oiled impactor (dpa50 = 10.42 µm) is not different from those of the greased impactor (dpa50 = 10.44 µm) and the uncoated impactor (dpa50 = 10.3 µm), while the penetration curve of the former (sharpness = 1.4) is slightly sharper than those of the later (sharpness = 1.48 for greased impactor and 1.53 for uncoated impactor). The cut-size is a function of the Stokes number (Stk) which is the ratio of the particle’s stopping distance to the characteristic dimension of the nozzle (Hinds Citation1999). Because the characteristic dimensions of the three impactors are identical in the present study, the cut-sizes are the same. The oiled impactor collects fewer particles smaller than the cut-size and more particles larger than the cut-size compared to the uncoated and greased impactors, leading to a sharper curve. It is because that the oiled impactor can capture large particles effectively. On the other hand, the uncoated impactor shows a smoother curve than those of the oiled and greased impactors due to higher penetrations of large particles. It indicates that the uncoated impactor may have the particle bounce effect, but the likelihood of the impaction-well like design helps to mitigate this effect resulting in the gradual decrease in the penetrations with the increased particle sizes. However, the estimated biases in PM10 concentrations of the oiled impactor (fine: −2.51%, typical: −0.7%, and coarse: +0.69%) and the uncoated impactor (fine: −0.35, typical: 0.43%, and coarse: +1.09%) are very small for three idealized distributions based on the greased impactor as the reference. It indicates that the difference in the curve sharpness of these impactors does not contribute to the sampling error between the three PM10 inlets with different impaction substrates.
Figure 3. Particle penetration curve of the cleaned PM10 impactors with different impaction substrates.
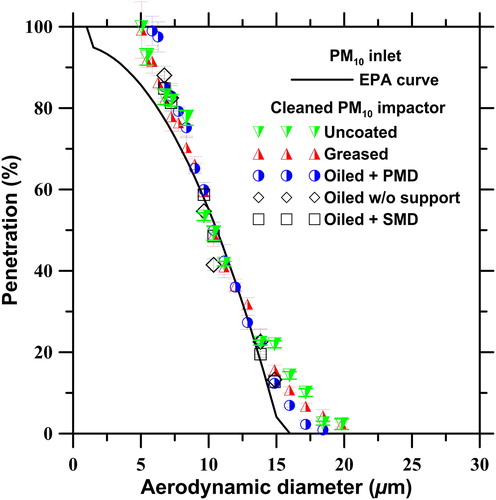
The M-PM10 impactors with the other two types of oiled substrates which are oil-soaked GFF supported by a solid metal disc (oiled + SMD), and oil-soaked GFF without the support were also studied. The results shown in indicate that the M-PM10 impactors with different oiled substrates have similar curve sharpness (varying from 1.4 to 1.44) but different cut-sizes. The cut-size of the M-PM10 impactor with the oiled substrate without the support (dpa50 = 11.44 µm) is larger than that of the M-PM10 impactor with the oiled substrates with the support (dpa50 = 10.42 µm for oiled + PMD support and dpa50 = 10.26 µm for oiled + SMD support) due to its larger jet-to-plate distance. The oiled + PMD impactor (H = 4.5 mm) can contain 1.3-mL oil soaked in the PMD and GFF, while the oiled + SMD impactor can contain 0.3-mL soaked in the GFF only. Therefore, the PMD is chosen to be the support for the oil-soaked GFF substrate in the M-PM10 impactor to retain as much vacuum oil as possible.
The cut-sizes and the sharpnesses of the sampling efficiency curves of the three PM10 inlets at different wind speeds calculated by using EquationEquation (3)(3)
(3) are shown in . The results show that only the calculated cut-sizes of the three PM10 inlets at the wind speeds of 2 and 8 km h−1 and the curve sharpnesses at the wind speeds of 2 and 24 km h−1 are very close to those of the uncoated PM10 inlet in the previous study (Tolocka et al. Citation2001). The comparison is discussed in details in Section B1 of the SI. It indicates that the calculated sampling efficiency is in a good agreement with the measured sampling efficiency at the low wind speed of 2 km h−1. The interaction of the aspirator and the PM10 impactor may be complex at higher wind speeds, 8 and 24 km h−1.
Table 1. Cut-size and curve sharpness of PM10 inlets.
3.2. Field comparison results of the PM10 inlets with different impaction substrates
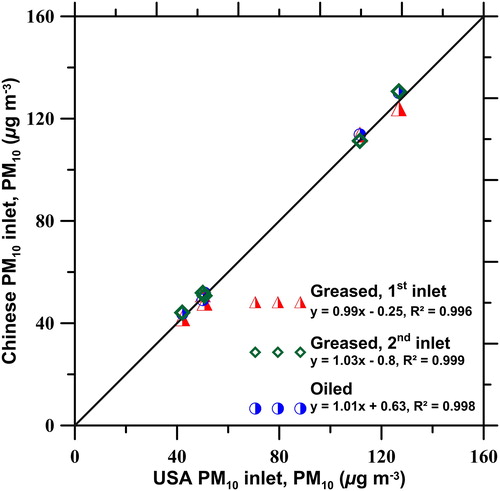
After testing the penetration curves of the PM10 impactors in the laboratory for calculating the sampling efficiencies of the PM10 inlets with different impaction substrates, the field comparison tests were conducted. shows that the linear relationship of four cleaned PM10 inlets (a reference US EPA greased PM10 inlet, two Chinese greased PM10 inlets, and an oiled M-PM10 inlet) when the range of measured PM10 concentrations is wide (50–126.8 µg m−3). The measured PM10 concentrations of four PM10 inlets agree well with each other with very close slopes, intercepts and R2 as shown in , which meet the US EPA requirements of slope = 1.0 ± 0.1, intercept = 0.0 ± 5.0 µg m−3, and R2 > 0.97 (US EPA Citation2017). The average sampling bias of the three Chinese inlets shown in Figure S2 of the SI is very small (-0.7 ± 3.2% for the 1st greased inlet, 2.3 ± 2.3% for the 2nd greased inlet, and 1.8 ± 2.2% for the oiled inlet) based on the reference inlet. These cleaned Chinese PM10 inlets and the M-PM10 inlet are identical to the US EPA inlet in measured PM10 concentrations.
Figure 4. Field comparison results of the cleaned PM10 inlets.
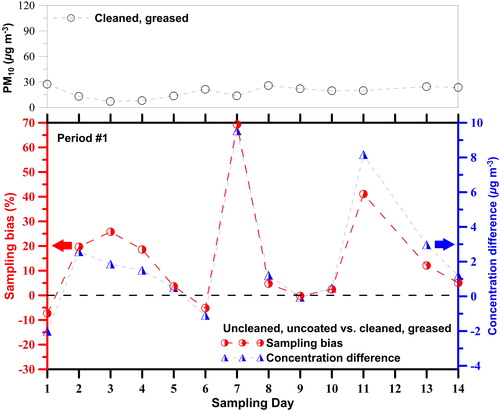
The traditional uncleaned, uncoated PM10 inlet (cleaned initially but not cleaned daily afterwards) which was collocated with the cleaned, greased inlet as the reference was first tested in the field in period #1 for 14 days. In , it can be seen that the uncoated PM10 inlet oversamples PM10 concentration during 14 sampling days with PM10 concentrations (cleaned, greased) ranging from 8.06 to 25.73 µg m−3. The positive average sampling bias of 14.58 ± 21.25% does not meet the US EPA requirement with the bias smaller than ±10% (US EPA Citation2017) indicating that the daily uncleaned, uncoated inlet has the particle bounce effect. It is observed that the sampling bias fluctuates from the negative bias of –7.37% (the concentration difference is −2.02 µg m−3) at day 1 to the positive bias of +19.68% (the concentration difference is +2.57 µg m−3) at day 2 and attains the high values of +69.3% and +41.08% at day 7 and 12, respectively (the concentration differences are +9.53 and +8.16 µg m−3, respectively). It indicates that the particle bounce occurs at the second 24-h sampling day with the loaded mass of 474 µg and the particle re-entrainment causes the very high positive error at day 7 and day 12 with the loaded masses of 1,804 and 3,316 µg, respectively. Note that the loaded mass is the product of the average (TSP - PM10)/PM10 ratio of 0.72 ± 0.1 and measured PM10 concentrations. The average (TSP - PM10)/PM10 ratio is calculated from the monthly TSP data collected in 2 years (2017 and 2018) obtained by Hsinchu EPA (Citation2018). The monthly data of (TSP - PM10)/PM10 are shown in Table SI-1, Section B2 of the SI.
Figure 5. Sampling bias of the uncoated PM10 inlet without daily cleaning in period #1.
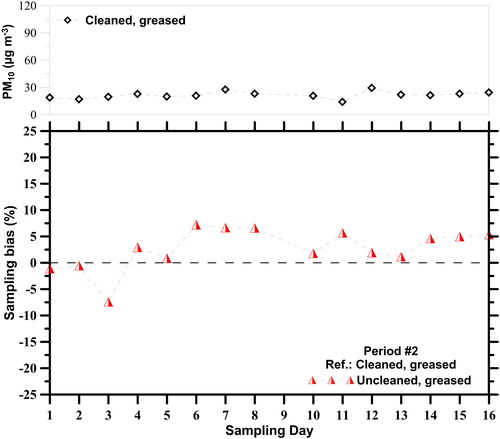
The traditional PM10 inlet was then coated with a thin layer of grease to evaluate the particle bounce and overloading effects for 16 days in period #2. shows the sampling bias of the greased PM10 inlet which is not cleaned during sixteen 24-h sampling days based on the reference cleaned, greased PM10 inlet. It is seen that the negative sampling bias varies from −0.5 to −7.4% from day 1 to day 3 with PM10 concentrations (cleaned, greased) ranging from 17.1 to 19.7 µg m−3, and the bias becomes positive ranging from +0.8 to +7.2% in day 4 to day 16 with PM10 concentrations ranging from 14.2 to 27.7 µg m−3. Although the sampling bias of the uncleaned, greased PM10 inlet is reduced as compared to the uncleaned, uncoated inlet and meets the US EPA requirement with the bias of < ±10%, overestimation of PM10 concentrations is apparent after 3 sampling days. The linear regression parameters (slope = 1.09, intercept = −1.44 µg m−3, and R2 = 0.96) do not very good as shown in Figure S3 of the SI). T, RH, and WS did not vary too much during period #2 (T = 30.5 ± 0.7 °C, RH = 68.4 ± 5%, and WS = 6.6 ± 3 km h−1, respectively), which might not be the cause of positive bias after day 3. The overestimation of PM10 concentrations of the uncleaned, greased PM10 inlet can well be due to the particle bounce effect. The cleaned, greased substrate seems to capture particles in the first three days effectively and then as deposited particles form several layers locally on the substrate, the likelihood of particle bounce occurs in the next 13 days. The estimated loaded masses after 3 days and 16 days are 965 and 5,979 µg, respectively ((TSP - PM10)/PM10 = 0.72 ± 0.1).
Figure 6. Sampling bias of the uncleaned, greased PM10 inlet in period #2.
In period #3, similar trend of positive sampling bias for the uncleaned, greased PM10 inlet (varying from 0 to +11.2%) is observed from day 3 to day 10 as shown in , when the loaded particle mass reaches to 6,397 µg ((TSP - PM10)/PM10 = 0.72 ± 0.1) at the end of day 10. Since higher PM10 concentrations (cleaned, greased) are measured in period #3 (ranging from 15.9 to 101.8 µg m−3), the particle bounce effect occurs after just 2 sampling days and persists for the next 8 sampling days. After that, the sampling bias of the uncleaned, greased PM10 inlet suddenly drops to become negative (varying from −1.5 to −5.5%) during the last 13 sampling days. Lower T (20.3 ± 3.6 °C), higher RH (75 ± 8.3%), and similar WS (5.4 ± 3.4 km h−1) were recorded during 23 sampling days in period #3 as compared to those of period #2. The statistical analysis shows that there is no clear relationship between the sampling bias and ambient conditions. The underestimation of PM10 concentrations of the uncleaned, greased PM10 inlet after day 10 can be explained by the particle overloading effect. The loaded mass increases from 6,397 µg at day 10 to 15,386 µg after 23 sampling days. When the substrate is overloaded, the particle collection efficiency is increased by localized particle pile-ups resulting in a smaller cut-size and a smoother sampling efficiency curve. These particle bounce and overloading effects of the uncleaned, greased PM10 inlet were further examined by conducting the particle penetration test in the laboratory after period #2 and #3, and the results are shown in Section 4.
Figure 7. Sampling bias of the uncleaned, greased PM10 inlet and the uncleaned M-PM10 inlet in period #3.
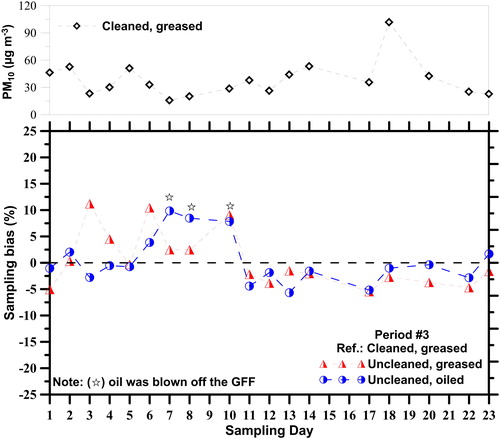
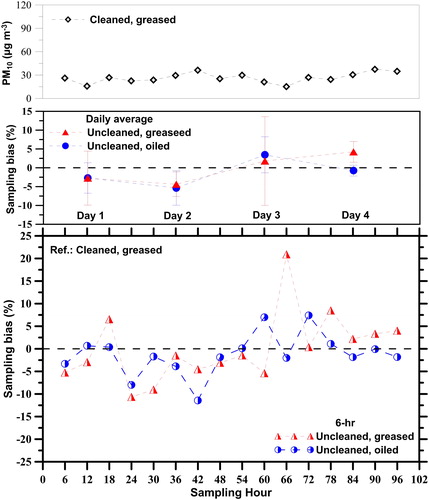
The sampling bias of the oiled M-PM10 inlet during twenty-three 24-h days in period #3 is also shown in . It shows that in 23 days the average sampling bias of the M-PM10 inlet is small (0.31 ± 4.56%), and the measured PM10 concentrations of the M-PM10 inlet have a very good linear relationship with those of the cleaned, greased PM10 inlet with the slope, intercept, and R2 of 0.97, 0.77 µg m−3, and 0.99, respectively (the linear regression curve is shown in Figure S3 of the SI). It is found that the positive biases of +9.85%, +8.46%, and +7.84% occurred in day 7, 8, and 10, respectively, because the oil was blown off the GFF leaving dried spots on the GFF after 6 sampling days. That is, the cavity with the depth of 3.5 mm contains 1.0 mL oil which is not enough for a long sampling period. After day 10, a small amount of oil was added to wet the substrate of the M-PM10 inlet, the bias soon became small and mostly negative (average: −2.3 ± 2.3%, range: −5.7 to 1.7%) from day 11 to day 23. Generally, it can be observed that the average sampling biases of the M-PM10 inlet during the first 10 days and the last 13 days are +2.9 ± 4.7% and −2.3 ± 2.3%, respectively, which are smaller than those of the uncleaned, greased PM10 inlet (+3.9 ± 5.46% and −3.1 ± 1.3%, respectively). The laboratory results of the sampling efficiency of the uncleaned, oiled M-PM10 inlet after 23 sampling days, which are discussed in Section 4, further shows a good performance of the M-PM10 inlet as compared to the uncleaned, greased inlet.
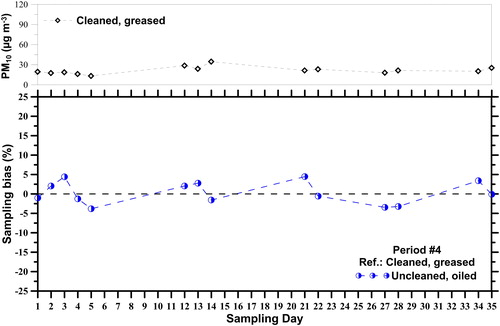
To keep enough oil on the GFF for the long-term sampling need, the cavity depth of the M-PM10 inlet was increased to 4.5 mm to contain 1.3 mL oil and form an extra 1-mm oil layer on top of the GFF. Then the M-PM10 inlet was again tested for another long sampling period of 35 days in period #4. shows that the sampling bias of the M-PM10 inlet ranges from −3.8 to +4.45% with the average of 0.27 ± 2.9%, which is very small, indicating that the M-PM10 inlet had eliminated the problem of oil blowing off the GFF occurred in period #3. Note that the days without the sampling bias data are non-sampling days but with continuous particle loading as described in Section 2.2. The 1-mm oil layer is enough to keep the GFF surface wetted with oil which helps particle capture effectively and provides more particle loading capacity as compared to the greased substrate of the conventional PM10 inlet. Therefore, the M-PM10 inlet can be used in FRM samplers and FEM monitors for long-term sampling without the needs of frequent maintenance. Because the measured PM10 concentration ranging from 13.3 to 34.6 µg m−3 is lower during period #4 than that during period #3, the loaded mass is 12,496 µg after 35 sampling days, which is equivalent to that of 23 sampling days in period #3.
Figure 8. Sampling bias of the uncleaned M-PM10 inlet in period #4.
Because the uncleaned, greased inlet is found to have particle bounce after three 24-h sampling days in period #2 and two 24-h sampling days in period #3, it was further tested for short-term sampling of 6 h in 8 days, two tests per day, to determine the exact time or loaded particle mass beyond which particle bounce occurs. In , it is found that the uncleaned, greased PM10 inlet show a good performance with the sampling bias ranging from −10.6% to +6.5% in the first 60 sampling hours but oversamples PM10 concentrations after 60 h, equivalent to 24-h sampling for 2.5 days, with the positive bias ranging from +0.37 to +20.9%. The loaded mass is 1,113 µg after 60-h sampling. In comparison, the M-PM10 inlet still shows a good performance with the sampling bias ranging from −11.4 to 7.4% during overall 96 sampling hours. Therefore, the greased PM10 inlet should be cleaned and re-greased after three 24-h sampling day with the moderate PM10 concentrations (15.1–38 µg m−3). The detailed results are shown in Section B3 of the SI.
Figure 9. Six-hour sampling bias of the uncleaned, greased PM10 inlet and the uncleaned M-PM10 inlet.
4. Discussion
To explain the particle bounce and overloading effects of the uncleaned, greased inlet occurred in period #2 (16 days) and #3 (23 days), respectively, the penetration curves of the uncleaned, greased PM10 impactor in period #2 and period #3 were obtained in the laboratory after the long-term tests. The results shown in indicate that the cut-size and the curve sharpness of the impactor in period #2 are 10.2 µm and 1.57, respectively. It can be seen that the impactor in period #2 has the similar cut-size but less sharp curve than the cleaned, greased impactor. The penetration of particles larger than 12.8 µm is non-zero, indicating that particle bounce had occurred in the impactor in period #2 after 16 days. Although the smoother penetration curve of the impactor in period #2 may result in lower PM10 concentrations, but the bounce effect of particles larger than the cut-size leads to higher PM10 concentrations in comparison to the cleaned, greased impactor. These opposite effects explain the slight positive sampling bias of the uncleaned, greased PM10 inlet from day 4 to day 16 in period #2 shown in .
Figure 10. Particle penetration curve of the uncleaned PM10 impactors with different impaction substrates.
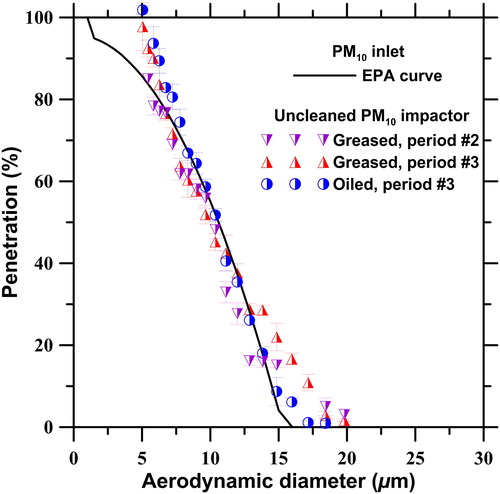
The cut-size and the curve sharpness of the impactor in period #3 are 9.77 µm and 1.61, respectively which are different from those of the cleaned, greased impactor. Obviously, the particle overloading effect had occurred in the impactor in period #3 resulting in a smaller cut-size and less sharp curve. The sampling efficiency curves of the uncleaned and cleaned inlets calculated from the penetration curves of impactors are used to calculate PM10 concentrations based on the typical mass distribution measured at the NCTU station by using an NMCI (NCTU micro-orifice cascade impactor, Chien et al. Citation2015). The distribution data show that the MMAD and the geometric standard deviation (GSD) of the fine mode of 0.4 µm and 1.6, respectively, and the MMAD and the GSD of the coarse mode of 6 µm and 1.9, respectively. The estimated bias of the inlet in period #3 is calculated to be −7.6% based on the daily cleaned, greased inlet as the reference indicating that the greased PM10 inlet not cleaned during a long sampling period undersamples PM10 concentrations because of the particle loading effect. After the particle loading effect occurred from day 11 to day 23 in period #3, the sampling bias becomes negative with the average value of −3.1 ± 1.4% (range: −1.53 to −5.48%) as shown in . The smaller negative bias observed in the field test of period #3 than the estimated bias could also be due to the opposite particle bouncing effect for particles larger than the cut-size.
The penetration of the M-PM10 impactor after 23 sampling days in period #3 is also shown in . The cut-size and the curve sharpness are 10.41 µm and 1.43, respectively, which are exactly the same as those of the cleaned M-PM10 impactor. That is, the oiled M-PM10 inlet is again shown to be able to retain particles effectively without particle bounce and overloading effects during long-term sampling.
5. Conclusion
This study investigated the effects of particle bounce and overloading on the sampling efficiency of the EPA louvered 16.7 L min−1 PM10 inlet. The field comparison test results show that the EPA louvered 16.7 L min−1 PM10 inlet which is cleaned initially but not cleaned daily afterwards, and not coated with grease oversamples PM10 concentration during 14 sampling days with the average sampling bias of 14.58 ± 21.25% as compared to the cleaned, greased PM10 inlet due to particle bounce and re-entrainment. The overestimation starts at the second sampling day with the sampling bias of +19.68% which does not meet the US EPA requirement with the bias smaller than ±10%. The sampling bias becomes severe at day 7 and day 12 with the high positive sampling bias of +69.31% and 41.08%, respectively. The EPA louvered 16.7 L min−1 PM10 inlet is then coated with the grease substrate to eliminate the particle bounce. The results show that the sampling bias is reduced during 16 sampling days in period #2 and 23 sampling days in period #3 as well. However, the uncleaned, greased inlet still oversamples PM10 concentrations after three sampling days with the loaded particle mass of ∼1,113 µg and persists during 10 days due to the particle bounce effect. When the loaded mass is increased to 6,397 µg, the uncleaned, greased PM10 inlet undersamples PM10 concentrations due to particle overloading effect resulting in the decrease in the cut-size (from 10.44 to 9.77 µm) and a less sharp curve (the sharpness increases from 1.49 to 1.61).
The M-PM10 inlet in which an oil-soaked GFF supported by an oil-soaked 25-mm PMD was used to replace the flat impaction surface in the traditional PM10 inlet was developed to eliminate particle bounce. The field comparison test results show that the M-PM10 inlet has the same sampling performance as the cleaned, greased PM10 inlet with a very small average sampling bias (0.27 ± 2.9%) during 35 sampling days. The laboratory test results show that the cut-size and the curve sharpness of the M-PM10 inlet remain the same (dpa50 = 10.41 µm and sharpness = 1.43) after 23 sampling days as the cleaned M-PM10 inlet (dpa50 = 10.42 µm and sharpness = 1.4). The results of 6-h PM10 concentrations show that the M-PM10 inlet is able to use for short-term PM10 monitoring and sampling without significant sampling error as compared to the greased PM10 inlet. In summary, the present M-PM10 inlet can be used for unattended continuous operation over 1 month with a good sampling accuracy without the need of frequent maintenance.
Supplemental Material
Download MS Word (906.4 KB)Additional information
Funding
Related Research Data
References
- Buser, M. D., J. D. Wanjura, D. P. Whitelock, S. C. Capareda, B. W. Shaw, and R. E. Lacey. 2008. Estimating FRM PM10 sampler performance characteristics using particle size analysis and collocated TSP and PM10 samplers: Cotton gins. Amer. Soc. Agric. Biol. Eng. 51 (2):695–702. doi:10.13031/2013.24382.
- Chien, C. L., C. Y. Tien, C. N. Liu, H. J. Ye, W. Huang, and C. J. Tsai. 2015. Design and testing of the NCTU micro-orifice cascade impactor (NMCI) for the measurement of nanoparticle size distributions. Aerosol Sci. Technol. 49 (10):1009–1018. doi: 10.1080/02786826.2015.1089976.
- Chow, J. C., and J. G. Watson. 2008. New directions: Beyond compliance air quality measurements. Atmos. Environ. 42 (20):5166–5168. doi: 10.1016/j.atmosenv.2008.05.004.
- Faulkner, W. B., R. Smith, and J. Haglund. 2014. Large particle penetration during pm10 sampling. Aerosol Sci. Technol. 48 (6):676–687. doi: 10.1080/02786826.2014.915005.
- Hinds, W. C. 1999. Aerosol technology: Properties, behavior, and measurement of airborne particles. New York: Wiley.
- Hsinchu EPA. 2018. Statistics of air quality data. Accessed July 24, 2018. http://stat1.hccg.gov.tw/hccg_bas/calendar.aspx.
- Huang, C. H., C. S. Chang, S. H. Chang, C. J. Tsai, T. S. Shih, and D. T. Tang. 2005. Use of porous foam as the substrate of an impactor for respirable aerosol sampling. J. Aerosol Sci. 36 (11):1373–1386. doi: 10.1016/j.jaerosci.2005.03.008.
- Huang, C. H., and C. J. Tsai. 2003. Mechanism of particle impaction and filtration by the dry porous metal substrates of an inertial impactor. Aerosol Sci. Technol. 37 (6):486–493. doi: 10.1080/02786820300968.
- Huang, C. H., C. J. Tsai, and T. S. Shih. 2001. Particle collection efficiency of an impactor with porous metal substrates. J. Aerosol Sci. 32 (9):1035–1044. doi: 10.1016/S0021-8502(01)00038-6.
- John, W., and H. C. Wang. 1991. Laboratory testing method for PM10 samplers: Lowered effectiveness from particle loading. Aerosol Sci. Technol. 14 (1):93–101. doi: 10.1080/02786829108959474.
- John, W., W. Winklmayr, and H. C. Wang. 1991. Particle deagglomeration and reentrainment in a PM10 sampler. Aerosol Sci. Technol. 14 (2):165–176. doi: 10.1080/02786829108959480.
- Kenny, L., G. Beaumont, A. Gudmundsson, A. Thorpe, and W. Koch. 2005. Aspiration and sampling efficiencies of the TSP and louvered particulate matter inlets. J. Environ. Monit. 7 (5):481–487. doi: 10.1039/b419001g.
- Kim, H. T., Y. J. Kim, and K. W. Lee. 1998. New PM10 inlet design and evaluation. Aerosol Sci. Technol. 29 (4):350–354. doi: 10.1080/02786829808965574.
- Le, T. C., and C. J. Tsai. 2017. Novel non-bouncing PM2.5 impactor modified from well impactor ninety-six. Aerosol Sci. Technol. 51 (11):1287–1295. doi: 10.1080/02786826.2017.1341621.
- Liu, B. Y., and D. Y. Pui. 1981. Aerosol sampling inlets and inhalable particles. Atmos. Environ. 15 (4):589–600. doi: 10.1016/0004-6981(81)90190-6.
- Marjamäki, M., and J. Keskinen. 2004. Effect of impaction plate roughness and porosity on collection efficiency. J. Aerosol Sci. 35 (3):301–308. doi: 10.1016/j.jaerosci.2003.09.001.
- McFarland, A. R., and C. A. Ortiz. 1984. Characterization of Sierra-Andersen PM-10 inlet model 246B. Air quality laboratory report, 4716/02/02/84/ARM, Texas A&M University System, College Station, TX.
- Park, J., J. C. Rock, L. Wang, Y. Seo, A. Bhatnagar, and S. Kim. 2009. Performance evaluation of six different aerosol samplers in a particulate matter generation chamber. Atmos. Environ. 43 (2):280–289. doi: 10.1016/j.atmosenv.2008.09.028.
- Peters, T. M., R. W. Vanderpool, and R. W. Wiener. 2001. Design and calibration of the EPA PM2.5 well impactor ninety-six (WINS). Aerosol Sci. Technol. 34 (5):389–397. doi: 10.1080/02786820120352.
- Rao, A. K., and K. T. Whitby. 1978. Non-ideal collection characteristics of inertial impactors I: Single-stage impactors and solid particles. J. Aerosol Sci. 9 (2):77–86. doi: 10.1016/0021-8502(78)90069-1.
- Rückerl, R., A. Schneider, S. Breitner, J. Cyrys, and A. Peters. 2011. Health effects of particulate air pollution: A review of epidemiological evidence. Inhal. Toxicol. 23 (10):555–592. doi: 10.3109/08958378.2011.593587.
- Tolocka, M. P., T. M. Peters, R. W. Vanderpool, F. L. Chen, and R. W. Wiener. 2001. On the modification of the low flow-rate PM10 dichotomous sampler inlet. Aerosol Sci. Technol. 34 (5):407–415. doi: 10.1080/02786820119350.
- Tsai, C. J., and Y. H. Cheng. 1995. Solid particle collection characteristics on impaction surfaces of different designs. Aerosol Sci. Technol. 23 (1):96–106. doi: 10.1080/02786829508965297.
- Tsai, C. J., and T. I. Lin. 2000. Particle collection efficiency of different impactor designs. Sep. Sci. Technol. 35 (16):2639–2650. doi: 10.1081/SS-100102360.
- Tsai, C. J., C. N. Liu, S. M. Hung, S. C. Chen, S. N. Uang, Y. S. Cheng, and Y. Zhou. 2012. Novel active personal nanoparticle sampler for the exposure assessment of nanoparticles in workplaces. Environ. Sci. Technol. 46 (8):4546–4552. doi: 10.1021/es204580f.
- Turner, J. R., and S. V. Hering. 1987. Greased and oiled substrates as bounce-free impaction surfaces. J. Aerosol Sci. 18 (2):215–224. doi: 10.1016/0021-8502(87)90057-7.
- US EPA. 2017. Ambient air monitoring reference and equivalent methods. 40 CFR, Part 53, Federal code of regulations. Washington, D.C.: U.S. Government Printing Office.
- Vanderpool, R. W., J. D. Krug, S. Kaushik, J. Gilberry, A. Dart, and C. L. Witherspoon. 2018. Size-selective sampling performance of six low-volume “total” suspended particulate (TSP) inlets. Aerosol Sci. Technol. 52 (1):98–113. doi: 10.1080/02786826.2017.1386766.
- Vanderpool, R. W., T. M. Peters, S. Natarajan, D. B. Gemmill, and R. W. Wiener. 2001. Evaluation of the loading characteristics of the EPA WINS PM2.5 separator. Aerosol Sci. Technol. 34 (5):444–456. doi: 10.1080/02786820117739.
- Vanderpool, R. W., and K. L. Rubow. 1988. Generation of large, solid, monodisperse calibration aerosols. Aerosol Sci. Technol. 9 (1):65–69. doi: 10.1080/02786828808959195.
- Wang, L., J. D. Wanjura, C. B. Parnell, R. E. Lacey, and B. W. Shaw. 2005. Performance characteristics of a low-volume PM10 sampler. Trans. ASAE. 48 (2):739–748. doi:10.13031/2013.18316.
- Watson, J. G., J. C. Chow, L. Chen, X. Wang, T. M. Merrifield, P. M. Fine, and K. Barker. 2011. Measurement system evaluation for upwind/downwind sampling of fugitive dust emissions. Aerosol Air Qual. Res. 11 (4):331–350. doi: 10.4209/aaqr.2011.03.0028.
- Zhao, Y., A. J. A. Aarnink, P. Hofschreuder, and P. W. G. Groot Koerkamp. 2009. Evaluation of an impaction and a cyclone pre-separator for sampling high PM10 and PM2.5 concentrations in livestock houses. J. Aerosol Sci. 40 (10):868–878. doi: 10.1016/j.jaerosci.2009.06.001.