
Abstract
Particulate matter (PM) air pollution is associated with human morbidity and mortality. Measuring PM oxidative potential has been shown to provide a predictive measurement between PM exposure and adverse health impacts. The dithiothreitol (DTT) assay is commonly used to measure the oxidative potential of PM2.5 (PM less than 2.5 µm aerodynamic diameter). In the common, kinetic form of this assay, the decay of DTT is quantified over time (indirectly) using 5,5′-dithiobis(2-nitrobenzoic acid) (DTNB, Ellman’s reagent) via UV/vis absorbance spectroscopy. The loss of DTT can also be quantified directly using electrochemical detection. The objectives of this work were (1) to evaluate the electrochemical assay, using commercially available equipment, relative to the UV/vis absorbance assay and (2) to apply the electrochemical method to a large (>100) number of PM2.5 filter samples. Also presented here is the comparison of an endpoint assay to the kinetic assay, in an attempt to reduce the time, labor, and materials necessary to quantify PM oxidative potential. The endpoint, electrochemical assay gave comparable results to the UV/vis absorbance assay for PM2.5 filter sample analysis. Finally, high filter mass loadings (higher than about 0.5 µg PM per mm2 filter) lead to suboptimal DTT assay performance, which suggests future studies should limit particle mass loadings on filters.
Copyright © 2019 American Association for Aerosol Research
EDITOR:
1. Introduction
Human exposure to particulate matter (PM) air pollution has been linked to adverse health effects and millions of premature deaths worldwide each year (Cohen et al. Citation2017; Kioumourtzoglou et al. Citation2016; Morakinyo et al. Citation2016). The toxicological mechanism(s) of PM are still being elucidated, but one common hypothesis is that PM generates reactive oxygen species (ROS) leading to increased oxidative stress and inflammation in the body (Alfadda and Sallam Citation2012; Anderson, Thundiyil, and Stolbach Citation2012; De Vizcaya-Ruiz et al. Citation2006). PM oxidative potential, the PMs ability to oxidize target molecules, is arguably a more biologically relevant measurement of PM toxicity as opposed to PM mass alone (Borm et al. Citation2007; Brook et al. Citation2010; Cho et al. Citation2005; Janssen et al. Citation2014). PM oxidative potential is hypothesized to be more relevant to human health because PM composition is not uniform, and each PM component has different reactivities with biological systems (Charrier and Anastasio Citation2012; Janssen et al. Citation2014).
The oxidative potential of a PM sample can be measured through antioxidant loss monitoring (Cho et al. Citation2005; Janssen et al. Citation2014). Crobeddu et al. (Citation2017) argue that ascorbic acid and glutathione depletion assays show the best correlation to intracellular ROS. Other studies, however, have shown a lack of association between ascorbate and health outcomes, likely due to ascorbate’s high reactivity in the presence of Cu(II) (Fang, Verma, Bates et al. Citation2015; Vidrio, Jung, and Anastasio Citation2008). Glutathione depletion is also sensitive to Cu and Fe (Godri et al. Citation2011). Another drawback of antioxidant depletion assays is the time required for sample incubation, which decreases the sample throughput. The glutathione depletion assay takes approximately 4 h (Mudway et al. Citation2004), and the ascorbic acid assay takes 1–2 h (Fang, Verma, Bates et al. Citation2015; Janssen et al. Citation2014; Yang et al. Citation2014) but is often run simultaneously with glutathione for 4 h (Ayres et al. Citation2008; Mudway et al. Citation2004). A more thorough comparison of PM oxidative potential measurements can be found elsewhere (Wang et al. Citation2018).
Dithiothreitol (DTT), a reducing agent known to react with a large number of chemicals relative to other antioxidants, is frequently used for in vitro quantification of PM oxidative potential (Charrier and Anastasio Citation2012; Charrier et al. Citation2016; Cho et al. Citation2005; Fang, Verma, Guo et al. Citation2015; Xiong et al. Citation2017). In the DTT assay, PM oxidizes DTT to the disulfide, and the remaining DTT is quantified over time. DTT reactivity with PM has been correlated with relevant biomarkers of inflammation and oxidative stress in human studies (Delfino et al. Citation2013) and in vivo assays (Crobeddu et al. Citation2017; Li et al. Citation2003). DTT concentration is commonly quantified with 5,5′-dithiobis(2-nitrobenzoic acid) (DTNB, Ellman’s reagent), which reacts with DTT to form 2-nitro-5-thiobenzoic acid (TNB), a chromophore that can be quantified with 412 nm light. DTT concentration can also be directly measured via electrochemistry (Sameenoi et al. Citation2011). The electrochemical detection method yields comparable results as UV/vis detection but eliminates additional reagents and reduces PM sample mass requirements (Koehler et al. Citation2014; Sameenoi et al. Citation2012). While there are advantages to the electrochemical detection of DTT, the assay described by Sameenoi et al. is limited to those who have electrode and microfluidic device fabrication equipment, which involves a large, upfront investment of equipment and labor.
We present here a modified version of the electrochemical DTT assay developed by Sameenoi et al. using commercially available equipment. This new DTT assay uses a commercially available wall-jet flow cell with replaceable electrodes. While an endpoint assay format can be used with UV/vis or electrochemical detection, it has not been applied to either DTT detection method to our knowledge. Kinetic and endpoint assay formats were compared and gave comparable results. The single (post-initial) time point further simplifies the assay by reducing labor and consumable goods. The DTT reactivity of water-soluble extracts from PM2.5 filter samples collected during field studies in Honduras, separated into personal and area/indoor exposure, was also tested against the UV/vis assay developed by Charrier et al. (Citation2016), modified from the original published UV/vis assay developed by Cho et al. (Citation2005). The Charrier et al. assay modifications are the addition of 50:50 trifluoroethanol (TFE):water, before DTT addition, to the PM solution and the Chelex treatment of phosphate buffer to remove transition metals (where Cho et al. used EDTA). Unlike EDTA, the Chelex is filtered out prior to the DTT assay and will not interfere with the assay results. Here, unlike many previous assays, including those developed by Cho et al. and Charrier et al., we do not use a chemical quenching agent, further reducing consumables. This study evaluates the combined effectiveness (accuracy, ease of use, reduced cost, and reduced assay time) of the electrochemical and endpoint DTT assay on a large-scale study of aerosol filter samples, applicable to users without access to custom electrochemical methods.
2. Methods
2.1. DTT assay
Electrochemical experiments were performed using a CHI 812 potentiostat (CH Instruments, Austin, TX). Purified (18.2 MΩ·cm) water was used for all experiments (MilliPore Milli-Q system, Billerica, MA, USA). DTT, 2,2,2-trifluoroethanol (TFE), and Chelex® 100 mesh were purchased from Sigma-Aldrich (St. Louis, MO, USA). Sodium phosphate monobasic and sodium phosphate dibasic were purchased from Fisher Scientific (Pittsburg, PA, USA). 5,5′-Dithiobis(2-nitrobenzoic acid) (DTNB, Ellman’s reagent) was purchased from Pierce Chemical (Dallas, TX, USA).
Filter samples were handled with plastic forceps and ceramic scissors to minimize possible metal contamination (Charrier and Anastasio Citation2012). Prior results from Charrier et al. (Citation2016) have suggested that targeting 10 µg/mL PM in the DTT assay gives the most consistent results. Unless otherwise stated, the massed filter samples were cut to achieve the target concentration of 10 µg/mL PM using between 0.5 and 1 mL total volume of fresh 75 µM DTT in 0.1 M Chelex-treated sodium phosphate buffer (pH 7.4). The filters were initially wetted with 15 µL of 50:50 TFE:water (v:v) in a 1.5 mL centrifuge tube (Eppendorf, Hamburg, Germany). Samples were incubated in the DTT solution at 37 °C in a water bath for 30 min. The reaction was then effectively halted in a 5 ± 3 °C water bath for 5 min (Sameenoi et al. Citation2012). Sample aliquots were intermittently injected into the wall-jet flow cell (FLWCL, DropSens, Spain) at 85 µL/min. The working electrode (DropSens 410 SPE, DropSens, Spain) was held at +0.3 V vs. Ag/AgCl. A calibration curve was generated for each electrode used prior to running the assay. The relative value of initial peak currents were measured and adjusted to the lab blank filter reactivity rate, divided by the summation of the incubation and cooling time (35 min). For the UV/vis assay, 400 µL of 75 µM DTNB was added to discrete 100 µL DTT aliquots over a 45-min period (approximately 0, 15, 30, and 45 min) and analyzed immediately at 412 nm (Agilent 8453, Santa Clara, CA, USA) with a molar absorptivity of 14,150 M−1 cm−2 used for concentration calculations.
2.2. Filter sampling
Air sampling filters (n = 105 personal and n = 106 area samples) were collected from March 3 through April 30, 2015 as part of a Honduras cookstove study as previously reported (Rajkumar et al. Citation2018). One blank filter was collected every 2 weeks. PM2.5 was sampled onto 37-mm PTFE-coated glass fiber filters (FiberfilmTM T60A20, Pall Corporation, KY, USA) using Triplex Cyclones (BGI, Mesa Labs, Butler, NJ, USA) and AirChek XR5000 pumps (SKC Inc., Eighty Four, PA, USA) operating at 1.5 L/min for 24 h. The filters were equilibrated for at least 24 h and then pre-weighed to the nearest microgram at Colorado State University (CSU) using a microbalance (Mettler-Toledo microbalance model MX5, Columbus, OH, USA). After collection of the PM2.5 sample, filters were stored at −22 °C and then transported to CSU, equilibrated, and post-weighed. The filters were then stored in a −80 °C freezer until tested. The whole filter particle mass is the difference in masses before and after collection, accounting for the mean change in field blanks. Personal filters were collected near the participant’s breathing zone; area filters were collected 76–127 cm from the stovetop in the participants’ kitchens. Each household had one personal and one area exposure filter; therefore the two data sets from personal and area exposure are not independent from each other.
3. Results and discussion
3.1. Assay validation
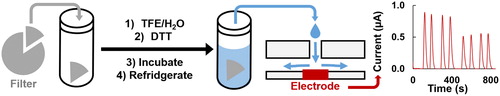
The electrochemical DTT assay has been reported as an accurate, precise, and simple assay that also uses less consumable materials than the UV/vis absorbance assay by eliminating DTNB addition and lowering the DTT solution volumes (Koehler et al. Citation2014; Sameenoi et al. Citation2012). The first assay steps (extracting the filter, adding DTT, and removing aliquots) are comparable between the UV/vis and electrochemical assays (). The hydrophobic filter is initially wetted with a TFE/water solution and then extracted into a phosphate buffer solution of DTT (Vidrio et al. Citation2009). The timing of the removal of aliquots is discussed below. However, with the electrochemical system, flow injection analysis is used and the aliquot is directly injected into the detector system in a similar manner as described by Sameenoi et al. (Citation2012). The direct DTT injection replaces indirect detection with the DTNB chromophore, eliminating the need for extra reagents, decreasing assay costs, and removing the added labor and uncertainty associated with indirect detection. For the electrochemical system presented here, only commercially available equipment, a DropSens poly(methyl methacrylate) (PMMA) wall-jet flow cell with DropSens screen-printed carbon electrodes with a built-in reference electrode, was used to validate the electrochemical assay. While we opted to use DropSens components, there are numerous commercially available potentiostats, electrodes, and flow cells that could achieve the same results. Our system has a limit of detection (LOD), calculated as three times the standard deviation of the blank, of 8.45 µM DTT. The current signal was 0.0137 ± 0.0006 µA/µM DTT (n = 24). Additionally, one person can analyze five samples per hour using the electrochemical flow cell system, which is a higher rate than the approximate one sample per hour with either the two-person manual or semi-automated absorbance assays reported previously (Fang, Verma, Guo et al. Citation2015).
Figure 1. Schematic of the filter extraction and electrochemical assay. A filter piece is cut and massed, extracted into TFE/water, then DTT in phosphate buffer is added for a known PM concentration. The solution in incubated at 37 °C and then thermally quenched in 5 °C fridge. Aliquots are removed and analyzed with flow injection chronoamperometry. Example data shown where the peak current is decreasing over time, with replicates.
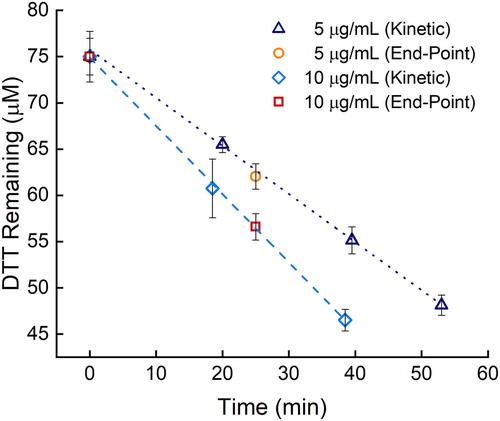
Besides the electrochemical assay presented eliminating the time, labor, and consumables associated with preparing, adding, and mixing a quenching and developing reagent, we have combined it with an endpoint assay to further reduce the time and labor. Endpoint assays are commonly used to simplify kinetic analyses (Boozer et al. Citation2006; Daniel et al. Citation2009; Giuliano, Haskins, and Taylor Citation2003; Karadag, Ozcelik, and Saner Citation2009). The original assay continually removes aliquots from the DTT chemical reaction, which leads to additional labor, time, and materials (Cho et al. Citation2005). In the example of the semi-automated system developed by Fang, Verma, Guo et al. (Citation2015), there would still be a benefit from eliminating the reagents and measuring fewer time points because the reagent solutions would not have to be purchased or prepared, and assay time would be reduced from about 60 to 30 min per sample, potentially leading to higher sample throughput at a lower cost. To help reduce time and labor requirements that limit large-scale aerosol studies, we evaluated the ability to reduce the number of time points needed for the DTT reaction rate calculation. We compared removing multiple aliquots over time to using one, post-initial, time point, also referred to as an endpoint assay. The endpoint assay principle can be applied to both the electrochemical and UV/vis assays during the linear reactivity period of the DTT assay. With the linear reactivity of DTT and having a proper calibration curve for accurate and precise measurements (Noblitt et al. Citation2016), the DTT rate can be accurately calculated from two time points. Replicates at each time point are still needed to decrease the uncertainty. The DTT reactivity of the same filter was used at two different PM concentrations, 5 and 10 µg/mL, with the multiple aliquot (kinetic) and the endpoint assays. As seen in , measured DTT consumption rates between the endpoint and kinetic assays fall along the same line (for a given PM concentration). The DTT reactivity of both PM filter pieces at 5 µg/mL was 509 ± 9 (n = 12 for each assay type) nM DTT min−1, and both 10 µg/mL PM DTT reactivities were 740 ± 20 (n = 9 for each assay type) nM DTT min−1. The endpoint assay was therefore used during the rest of this study.
Figure 2. Comparison of DTT loss with the endpoint and kinetic assays for two different PM concentrations: 5 µg/mL (orange circles and navy triangles, respectively, 509 ± 9 nM min−1 loss rate) and 10 µg/mL (red squares and blue diamonds, respectively, 740 ± 20 nM min−1 loss rate). Error bars represent the standard deviation of three replicates.
3.2. Evaluation of mass-normalized bias
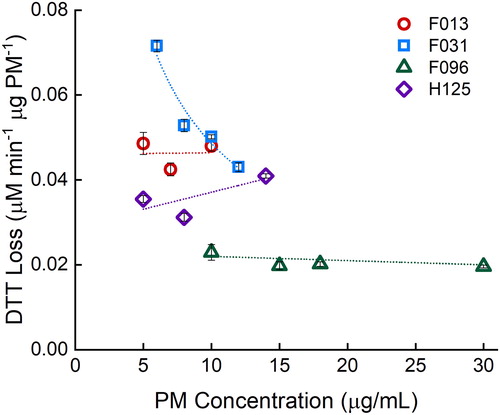
Potential DTT reactivity bias in a mass-normalized PM system has recently been reported (Charrier et al. Citation2016). Charrier et al. show that DTT reactivity is not always linear with extracted PM concentration, most likely due to high Cu concentration in the samples, as Cu(II) has a nonlinear reactivity with DTT, yielding higher DTT reactivity at lower PM concentrations when it is PM-mass normalized. Charrier et al. state the need for 10 µg/mL extracted PM concentration to be compared between studies to reduce the mass-reactivity bias. The linearity of several samples was tested for bias with the mass-normalized (). Three of the four filter samples show no mass-normalized response (i.e., the 95% confidence interval about the slope contains zero). One filter, F031, had a significant negative slope with a linear fit (−0.004 ± 0.001, R2 = 0.88) but has an improved coefficient of determination with a nonlinear fit. A power function fit yields a coefficient of determination of 0.95. This is likely due to a higher Cu concentration in the filter sample, yielding a nonlinear mass-normalized response, as seen previously (Charrier et al. Citation2016). To help alleviate the potential bias in the large-scale study, a PM concentration of 10 µg/mL was used for evaluation of real filter samples, as suggested by Charrier et al.
Figure 3. Determining bias in mass-normalized response with four random filter samples (F013, F031, F096, and H125) at various PM concentrations. Filters F013, F096, and H125 have no significant slope at a 95% confidence level. Filter F031 has a power fit of y = 0.2403x−0.694 with R2 of 0.95. Error bars represent standard deviation of three replicates.
3.3. Evaluation of Honduras cookstove study PM2.5 filter samples
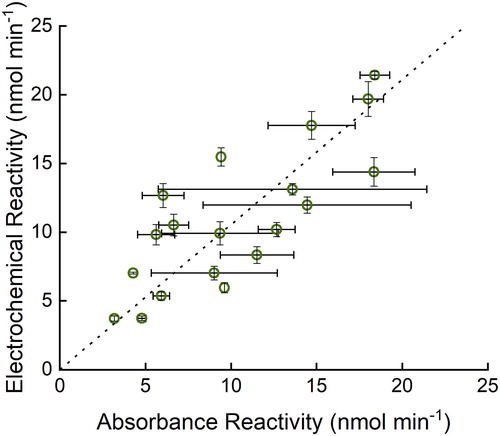
The electrochemical and absorbance assays have previously been shown to give similar results (Sameenoi et al. Citation2012). Here, the modified electrochemical DTT assay was also compared against the UV/vis assay with real aerosol filter samples using Deming regression (Cornbleet and Gochman Citation1979), which incorporates the error of both methods into the fit. The same filters were used for comparison, and the extraction technique was the same for both assays. The Deming regression best‐fit results in a line with a slope of 1.05 and an intercept of 0.119 (). The correlation coefficient between these variables is 0.79. The standard deviation values of the two assays should not be directly compared as the electrochemical assay utilized lab blanks (filters that were not exposed to the field), and the UV/vis assay utilized field blanks, as either can be used with the DTT assay.
Figure 4. Comparison of filter DTT reactivity of the absorbance assay with electrochemical assay using Deming regression (dashed line is the best fit from the regression analysis, y = 1.05x + 0.119) of 19 filter samples. R2 = 0.63. Error bars represent standard deviation of three replicates of three different filter pieces.
After comparing the modified electrochemical DTT assay to the UV/Vis assay, the practicality of using the electrochemical assay with a large sample size was demonstrated. In this study, we tested 211 filters collected in Honduras as part of an epidemiology cookstove project (Rajkumar et al. Citation2018). The filter samples were separated into area and personal exposures. The average area exposure DTT reactivity rate (nmol DTT min−1 m−3) was 9.38 with a reactivity range between 0.460 and 31.8. Personal exposures showed an average DTT reactivity rate (nmol DTT min−1 m−3) of 5.90 with a reactivity range between 1.03 and 18.4.
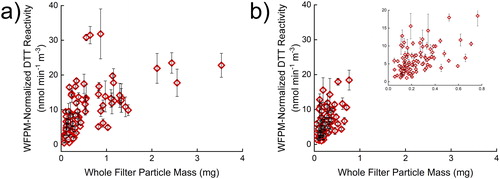
Even though the same PM concentration was used, there was a limitation found within this filter sample set. It has been assumed that the DTT reactivity is unaffected by the collected filter’s whole filter particle mass (WFPM, the filter’s change in mass during collection), and to our knowledge, this assumption has not been tested. With the assumption that the total collected PM mass does not affect the DTT assay results, as long as the extracted PM concentration is consistent, a linear relationship would be expected between the WFPM-normalized reactivity (DTT reactivity multiplied by WFPM) relative to the WFPM of the filters, with the resulting slope being equivalent to the average DTT reactivity of the samples. However, a strong linear relationship is not seen with the filters tested here () as the coefficients of variation, R2, are 0.33 and 0.27 for the area and personal sample sets, respectively. With the area exposure filter samples (), a deviation from linearity is clearly seen above about 0.5 mg WFPM. The nonlinearity above 0.5 mg could be explained by the large mass loadings on the filter hindering mass transport of the PM into the bulk solution and/or inaccessibility of the DTT to PM buried on the filter, causing lower reactivity per PM mass than expected. This limit to mass loadings could also simply be a limitation of the extraction method used here. The same deviation from linearity is not clearly seen with the personal exposure filters () as the PM mass loadings do not exceed 0.8 mg and less than 10% of the filter mass loadings are greater than 0.5 mg. The filter type and the PM source, as the samples tested here were driven by wood burning, might also have an influence on the value where the deviation from linearity is seen. Future work is required to confirm if the deviation from linearity at high WFPM is from the mass transport or the extraction method used here. If it is a mass transport problem, future PM studies should be cognizant of the mass loadings onto the filter and the bias it introduces into the DTT assay. If the extraction method presented here is used, then mass loadings should remain smaller than about 0.5 mg per 37 mm filter, equivalent to 0.5 µg PM per mm2 of filter, but future work will solidify this cautionary statement. If another extraction method is used, then the linearity of WFPM-normalized reactivity should still be tested in the range of filter mass loadings to confirm no bias with high WFPM.
Figure 5. Comparison of normalized reactivity vs. whole filter particle mass in (a) 106 area and (b) 105 personal filter samples. Normalized reactivity is the DTT reactivity rate (nmol DTT min−1 mg−1 PM m−3 air) multiplied by the whole filter particle mass (mg PM). The units have been simplified in regards to grams of PM. Error bars represent three replicates of three filter sections.
4. Conclusion
In this work, we developed an electrochemical system to directly measure DTT using commercially available electrodes in a wall-jet flow cell. Our system was validated through comparison to the UV/vis assay, and this work is the first time, to our knowledge, that the electrochemical DTT assay has been applied to a large sample size (211 samples). The time and labor was reduced by using an endpoint assay instead of the kinetic assay. The presented endpoint assay can be used in the future during a UV/vis DTT assay. The assay showed deviation from expected linearity between filter PM2.5 mass and the WFPM-normalized DTT reactivity with high mass loadings likely due to a slow mass transport or the inability of DTT to react with PM components. Future studies will need to address the observed lower reactivity at high mass loadings by limiting mass loadings onto filters. Future work will need to test if the linear deviation is from the PM source, filter type, extraction method, or another factor. The endpoint electrochemical assay presented here increases the sample throughput to five samples per hour, but future work should seek to improve sample throughput further.
Acknowledgments
We would like to thank Dr. Kevin Klunder, Dr. Casey Quinn, and Luna Martinez for their involvement with this work. We also thank Gloribel Bautista Cuellar and Jonathan Stack for their assistance with the filter sampling in Hondras.
Additional information
Funding
References
- Alfadda, A. A., and R. M. Sallam. 2012. Reactive oxygen species in health and disease. BioMed Res. Int. 2012:936486. doi: 10.1155/2012/936486.
- Anderson, J. O., J. G. Thundiyil, and A. Stolbach. 2012. Clearing the air: A review of the effects of particulate matter air pollution on human health. J. Med. Toxicol. 8 (2):166–175. doi: 10.1007/s13181-011-0203-1.
- Ayres, J. G., P. Borm, F. R. Cassee, V. Castranova, K. Donaldson, A. Ghio, R. M. Harrison, R. Hider, F. Kelly, I. M. Kooter, et al. 2008. Evaluating the toxicity of airborne particulate matter and nanoparticles by measuring oxidative stress potential—A workshop report and consensus statement. Inhal. Toxicol. 20 (1):75–99. doi: 10.1080/08958370701665517.
- Boozer, C., G. Kim, S. Cong, H. Guan, and T. Londergan. 2006. Looking towards label-free biomolecular interaction analysis in a high-throughput format: A review of new surface plasmon resonance technologies. Curr. Opin. Biotechnol. 17 (4):400–405. doi: 10.1016/j.copbio.2006.06.012.
- Borm, P. J. A., F. Kelly, N. Künzli, R. P. F. Schins, and K. Donaldson. 2007. Oxidant generation by particulate matter: From biologically effective dose to a promising, novel metric. Occup. Environ. Med. 64 (2):73–74. doi: 10.1136/oem.2006.029090.
- Brook, R. D., S. Rajagopalan, C. A. Pope, J. R. Brook, A. Bhatnagar, A. V. Diez-Roux, F. Holguin, Y. Hong, R. V. Luepker, M. A. Mittleman, et al. 2010. Particulate matter air pollution and cardiovascular disease: An update to the scientific statement from American Heart Association. Circulation. 121:2331–2378. doi: 10.1161/CIR.0b013e3181dbece1.
- Charrier, J. G., and C. Anastasio. 2012. On dithiothreitol (DTT) as a measure of oxidative potential for ambient particles: Evidence for the importance of soluble transition metals. Atmos. Chem. Phys. (Print) 12:11317–11350. doi: 10.5194/acpd-12-11317-2012.
- Charrier, J. G., A. S. McFall, K. K. T. Vu, J. Baroi, C. Olea, A. Hasson, and C. Anastasio. 2016. A bias in the “mass-normalized” DTT response—An effect of non-linear concentration-response curves for copper and manganese. Atmos. Environ. 144:325–334. doi: 10.1016/j.atmosenv.2016.08.071.
- Cho, A. K., C. Sioutas, A. H. Miguel, Y. Kumagai, D. A. Schmitz, M. Singh, A. Eiguren-Fernandez, and J. R. Froines. 2005. Redox activity of airborne particulate matter at different sites in the Los Angeles Basin. Environ. Res. 99 (1):40–47. doi: 10.1016/j.envres.2005.01.003.
- Cohen, A. J., M. Brauer, R. Burnett, H. R. Anderson, J. Frostad, K. Estep, K. Balakrishnan, B. Brunekreef, L. Dandona, R. Dandona, et al. 2017. Estimates and 25-year trends of the global burden of disease attributable to ambient air pollution: An analysis of data from the global burden of diseases study 2015. Lancet. 389 (10082):1907–1918. doi: 10.1016/S0140-6736(17)30505-6.
- Cornbleet, P. J., and N. Gochman. 1979. Incorrect least-squares regression coefficients in method-comparison analysis. Clin. Chem. 25:432–438.
- Crobeddu, B., L. Aragao-Santiago, L.-C. Bui, S. Boland, and A. Baeza Squiban. 2017. Oxidative potential of particulate matter 2.5 as predictive indicator of cellular stress. Environ. Pollut. 230:125–133. doi: 10.1016/j.envpol.2017.06.051.
- Daniel, W. L., M. S. Han, J.-S. Lee, and C. A. Mirkin. 2009. Colorimetric nitrite and nitrate detection with gold nanoparticle probes and kinetic end points. J. Am. Chem. Soc. 131 (18):6362–6363. doi: 10.1021/ja901609k.
- De Vizcaya-Ruiz, A., M. Gutiérrez-Castillo, M. Uribe-Ramirez, M. Cebrián, V. Mugica-Alvarez, J. Sepúlveda, I. Rosas, E. Salinas, C. Garcia-Cuéllar, and F. Martínez. 2006. Characterization and in vitro biological effects of concentrated particulate matter from Mexico City. Atmos. Environ. 40:583–592. doi: 10.1016/j.atmosenv.2005.12.073.
- Delfino, R. J., N. Staimer, T. Tjoa, D. L. Gillen, J. J. Schauer, and M. M. Shafer. 2013. Airway inflammation and oxidative potential of air pollutant particles in a pediatric asthma panel. J. Exposure Sci. Environ. Epidemiol. 23 (5):466. doi: 10.1038/jes.2013.25.
- Fang, T., V. Verma, J. Bates, J. Abrams, M. Klein, M. Strickland, S. Sarnat, H. Chang, J. Mulholland, and P. Tolbert. 2015. Oxidative potential of ambient water-soluble PM 2.5 measured by dithiothreitol (DTT) and ascorbic acid (AA) assays in the southeastern United States: Contrasts in sources and health associations. Atmos. Chem. Phys. Discuss. 15:30609–30644.
- Fang, T., V. Verma, H. Guo, L. King, E. Edgerton, and R. Weber. 2015. A semi-automated system for quantifying the oxidative potential of ambient particles in aqueous extracts using the dithiothreitol (DTT) assay: Results from the Southeastern Center for Air Pollution and Epidemiology (SCAPE). Atmos. Meas. Tech. 8 (1):471.
- Giuliano, K. A., J. R. Haskins, and D. L. Taylor. 2003. Advances in high content screening for drug discovery. Assay Drug Dev. Technol. 1 (4):565–577.
- Godri, K. J., R. M. Harrison, T. Evans, T. Baker, C. Dunster, I. S. Mudway, and F. J. Kelly. 2011. Increased oxidative burden associated with traffic component of ambient particulate matter at roadside and urban background schools sites in London. PLoS One. 6 (7):e21961. doi: 10.1371/journal.pone.0021961.
- Janssen, N. A. H., A. Yang, M. Strak, M. Steenhof, B. Hellack, M. E. Gerlofs-Nijland, T. Kuhlbusch, F. Kelly, R. Harrison, B. Brunekreef, et al. 2014. Oxidative potential of particulate matter collected at sites with different source characteristics. Sci. Total Environ. 472:572–581. doi: 10.1016/j.scitotenv.2013.11.099.
- Karadag, A., B. Ozcelik, and S. Saner. 2009. Review of methods to determine antioxidant capacities. Food Anal. Methods. 2 (1):41–60. doi: 10.1007/s12161-008-9067-7.
- Kioumourtzoglou, M.-A., J. D. Schwartz, M. G. Weisskopf, S. J. Melly, Y. Wang, F. Dominici, and A. Zanobetti. 2016. Long-term PM2.5 exposure and neurological hospital admissions in the northeastern United States. Environ. Health Perspect. 124:23.
- Koehler, K. A., J. Shapiro, Y. Sameenoi, C. Henry, and J. Volckens. 2014. Laboratory evaluation of a microfluidic electrochemical sensor for aerosol oxidative load. Aerosol. Sci. Technol. 48:489–497. doi: 10.1080/02786826.2014.891722.
- Li, N., C. Sioutas, A. Cho, D. Schmitz, C. Misra, J. Sempf, M. Wang, T. Oberley, J. Froines, and A. Nel. 2003. Ultrafine particulate pollutants induce oxidative stress and mitochondrial damage. Environ. Health Perspect. 111 (4):455. doi: 10.1289/ehp.6000.
- Morakinyo, O. M., M. I. Mokgobu, M. S. Mukhola, and R. P. Hunter. 2016. Health outcomes of exposure to biological and chemical components of inhalable and respirable particulate matter. Int. J. Environ. Res. Public Health. 13 (6):592. doi: 10.3390/ijerph13060592.
- Mudway, I. S., N. Stenfors, S. T. Duggan, H. Roxborough, H. Zielinski, S. L. Marklund, A. Blomberg, A. J. Frew, T. Sandström, and F. J. Kelly. 2004. An in vitro and in vivo investigation of the effects of diesel exhaust on human airway lining fluid antioxidants. Arch. Biochem. Biophys. 423 (1):200–212. doi: 10.1016/j.abb.2003.12.018.
- Noblitt, S. D., K. E. Berg, D. M. Cate, and C. S. Henry. 2016. Characterizing nonconstant instrumental variance in emerging miniaturized analytical techniques. Anal. Chim. Acta. 915:64–73. doi: 10.1016/j.aca.2016.02.023.
- Rajkumar, S., M. L. Clark, B. N. Young, M. L. Benka‐Coker, A. M. Bachand, R. D. Brook, T. L. Nelson, J. Volckens, S. J. Reynolds, C. L'Orange, et al. 2018. Exposure to household air pollution from biomass‐burning cookstoves and HbA1c and diabetic status among Honduran women. Indoor Air. 28:768–776. doi: 10.1111/ina.12484.
- Sameenoi, Y., K. Koehler, J. Shapiro, K. Boonsong, Y. Sun, J. Collett, J. Volckens, and C. S. Henry. 2012. Microfluidic electrochemical sensor for on-line monitoring of aerosol oxidative activity. J. Am. Chem. Soc. 134 (25):10562–10568. doi: 10.1021/ja3031104.
- Sameenoi, Y., M. M. Mensack, K. Boonsong, R. Ewing, W. Dungchai, O. Chailapakul, D. M. Cropek, and C. S. Henry. 2011. Poly(dimethylsiloxane) cross-linked carbon paste electrodes for microfluidic electrochemical sensing. Analyst. 136 (15):3177–3184. doi: 10.1039/c1an15335h.
- Vidrio, E., H. Jung, and C. Anastasio. 2008. Generation of hydroxyl radicals from dissolved transition metals in surrogate lung fluid solutions. Atmos. Environ. 42 (18):4369–4379. doi: 10.1016/j.atmosenv.2008.01.004.
- Vidrio, E., C. H. Phuah, A. M. Dillner, and C. Anastasio. 2009. Generation of hydroxyl radicals from ambient fine particles in a surrogate lung fluid solution. Environ. Sci. Technol. 43:922–927. doi: 10.1021/es801653u.
- Wang, Y., M. J. Plewa, U. K. Mukherjee, and V. Verma. 2018. Assessing the cytotoxicity of ambient particulate matter (PM) using Chinese hamster ovary (CHO) cells and its relationship with the PM chemical composition and oxidative potential. Atmos. Environ. 179:132–141. doi: 10.1016/j.atmosenv.2018.02.025.
- Xiong, Q., H. Yu, R. Wang, J. Wei, and V. Verma. 2017. Rethinking dithiothreitol-based particulate matter oxidative potential: Measuring dithiothreitol consumption versus reactive oxygen species generation. Environ. Sci. Technol. 51:6507–6514.
- Yang, A., A. Jedynska, B. Hellack, I. Kooter, G. Hoek, B. Brunekreef, T. A. J. Kuhlbusch, F. R. Cassee, and N. A. H. Janssen. 2014. Measurement of the oxidative potential of PM2.5 and its constituents: The effect of extraction solvent and filter type. Atmos. Environ. 83:35–42. doi: 10.1016/j.atmosenv.2013.10.049.