
 ?Mathematical formulae have been encoded as MathML and are displayed in this HTML version using MathJax in order to improve their display. Uncheck the box to turn MathJax off. This feature requires Javascript. Click on a formula to zoom.
Abstract
Atmospheric ultrafine particles (UFP) and their associated sources and sinks continue to attract significant research attention in climate and air pollution science. Vegetation is an important sink for UFP given its large area coverage. What remains a subject of inquiry are the aerodynamic and electromagnetic processes governing the aforementioned vegetation sink. Single fiber theory can explain deposition of zero charged UFP onto vegetation by treating vegetation as filter media. However, the ability of single fiber theory to predict deposition of charged UFP onto vegetation remains to be explored and frames the scope here. Wind tunnel experiments were used to investigate UFP dry deposition onto Juniper branches (Juniperus chinesis) under three different wind speeds (0.3, 0.6, and 0.9 m/s). Results indicate that the single fiber theory can describe the deposition of singly charged particles onto vegetation if both the image force and Brownian diffusion are simultaneously considered. The image force can be expressed by when the image force dimensionless number (KIM) is smaller than 10−8. It is shown that the single fiber filtration model and the wind tunnel measurements mostly agree to within 20%. The main finding here is that the image force at smaller KIM (10−10 ∼ 10−8) increases deposition of charged UFP onto vegetation. Because filtration theory can be readily accommodated in fluid transport formulations as a boundary condition, the findings regarding charge enhance UFP deposition schemes that can be used in air quality and climate models.
Copyright © 2019 American Association for Aerosol Research
1. Introduction
Atmospheric ultrafine particles (UFP, particles with the diameter <100 nm) are characterized by large number and surface area concentrations. In some urban settings such as Helsinki (Finland) and Los Angeles, California (USA), UFP contribute over 80% of the total particle number concentration (Hussein et al. Citation2004; Moore et al. Citation2009). The large surface area and number concentration enables UFP to carry hazardous substances such as metals and organic compounds that produce reactive oxygen species (ROS) (Faiola et al. Citation2011; Schmid et al. Citation2009), which in turn can induce adverse health effects such as chronic obstructive pulmonary disease (COPD) and asthma as discussed elsewhere (Dick et al. Citation2003). Epidemiological studies have also linked UFP exposure with respiratory and cardiovascular diseases, and mortality (Ostro et al. Citation2015; Peters et al. Citation1997; Wichmann and Peters Citation2000).
Vegetation reduces the heat island effect and noise pollution in urban environments and can efficiently remove certain air pollutants (Hagler et al. Citation2012; Hosseini et al. Citation2016; Morakinyo and Lam Citation2016). Over land, vegetation can act as a significant UFP sink given its large areal coverage (Hansen et al. Citation2000; Katul et al. Citation2010; Katul and Poggi Citation2011). Because of their small size, the primary deposition mechanism for UFP at zero charge is Brownian diffusion (Petroff et al. Citation2008). Some models have been proposed to describe the deposition of UFP onto vegetation and a number of attempts have been made to link all these models to some general formulation (Huang et al. Citation2014; Huang et al. Citation2013; Huang et al. Citation2015; Lin, Katul, and Khlystov Citation2012; Lin and Khlystov Citation2012; Neft et al. Citation2016). By contrast, the deposition of charged particles onto vegetation is not well studied, especially in the UFP size range. The percentage of singly charged UFP can be up to 46% in adjacent roadway environments for 100 nm particles (Lee, Xu, and Zhu Citation2012). Even at Boltzmann charge equilibrium, which is commonly encountered in indoor air (Buckley, Wright, and Henshaw Citation2008), the singly charged UFP still contribute a significant percentage to the total UFP number concentration. Charged particles are more likely to deposit in the human lung and cause cell membrane rupture than uncharged particles (Cohen et al. Citation1998; Ting and Wang Citation2011). Therefore, the deposition mechanism for charged UFP is drawing attention in both health sciences and climate change research.
For charged UFP, another important aerosol deposition mechanism to consider besides Brownian motion is the electrostatic force. Two different kinds of electrostatic forces exist for charged particles and are: (1) the Coulomb force if the deposition surface is also charged and (2) the image force (EIM) if the deposition surface is neutral. Vegetation surfaces may vary from neutral to charged, especially when covered by snow (Gordon and Taylor Citation2009). However, given the scarcity of experiments on charged particles, a logical starting point is to consider a neutral surface first, which frames the scope here. In the absence of external electric field (as is the case here), the only electrostatic force is the so-called “image force.” The image force can be expressed as:
(1)
(1)
where β is a constant that reportedly ranges from 1.5 to 9.69 depending on particle size, particle charge, and filter type (Alonso et al. Citation2007; Lundgren and Whitby Citation1965; Yoshioka, Emi, and Tamori Citation1968). KIM is the image force dimensionless number representing the ratio of electrostatic drift velocity to the flow field velocity, expressed as (Kraemer and Johnstone Citation1955):
(2)
(2)
where εf is fiber dielectric constant, ε0 is vacuum dielectric constant, N is the number of elementary charge units, e is elementary charge, µ is the air viscosity, U0 is the approach velocity, dp is particle diameter, df is fiber diameter, and
is the Cunningham slip correction coefficient. Most of the previous studies considered particle sizes (0.1–1 µm) that are much larger than UFP and highly charged particles (each particle has up to 320 elementary charges). These conditions yield a KIM larger than
(Lundgren and Whitby Citation1965; Yoshioka, Emi, and Tamori Citation1968). Few studies did focus on the UFP range with smaller particle charge. One study points out that the image force of UFP cannot be neglected even when KIM is 10−7–10−5 (Alonso et al. Citation2007). However, conditions when KIM is smaller than 10−7, a condition that may be encountered in nature, were not investigated. This may lead to bias in prediction of particle deposition if the aforementioned image force is not considered.
To explore the role of the image force at small KIM for charged UFP, the deposition of singly charged UFP onto a neutral vegetation surface is considered. The particle size range the experiments (12.6–100 nm) obtained from the Scanning Mobility Particle Sizer (SMPS) covers most of the UFP size range. The main result here is that the image force was found to be 24.5×, meaning that the
scaling is maintained but the proportionality constant (=24.5) is much larger than the 1.5–9.69 reported earlier for KIM > 10−7. When considering both the image force and Brownian diffusion, the single fiber theory can be applied to describe the deposition of singly charged UFP onto vegetation.
2. Methods
2.1. Experimental setup
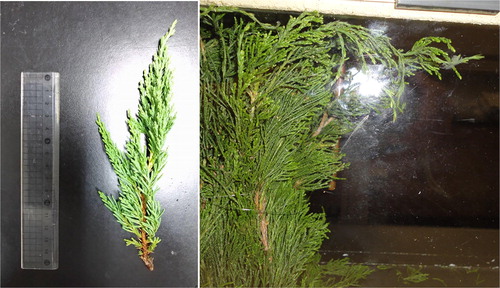
The experimental setup used here largely follows that described in Huang et al. (Citation2013). shows a sketch of the experimental setup using densely packed vegetated branches in a wind tunnel (16 cm wide, 18 cm high, and 226 cm in length). The particle source was produced by mixing room air with particles generated from two burning candles in the mixing chamber (30 cm wide, 57 cm high, and 545 cm in length). The reason for using candles is their high UFP production rate needed to achieve reliably measurable particle concentrations after mixing with the air flow in the wind tunnel. The particle size distribution generated by candles provides a sufficient number of particles at all sizes in the UFP size range. To ensure that the particle flow is homogenous, air flow first passes through three layers of meshes (grid is 1.55 mm wide and 1.72 mm high) before entering the wind tunnel. We placed a vaneometer (model 480 Dwyer, IN, USA) 90 cm upstream of the vegetation in the wind tunnel to measure the time and area-averaged velocity U0. Fresh Juniper branches (Juniperus chinesis) were selected as the test vegetation, due to their rigid needle shape, which is common among coniferous vegetation species. As seen in , the juniper branches were bundled together vertically and distributed uniformly in the wind tunnel. The total vegetation section was 84 cm (vegetation width and height entirely cover the wind tunnel dimensions).
Figure 1. A sketch of the wind tunnel experimental setup. Illustration of the experimental setup showing the vegetated section inside the wind tunnel, the particle generation inside the mixing chamber and the location of the meshes to homogenize the inflow velocity. The neutralizer and the SMPS unit used to measure concentrations are also shown. The air flow direction is from left to right.
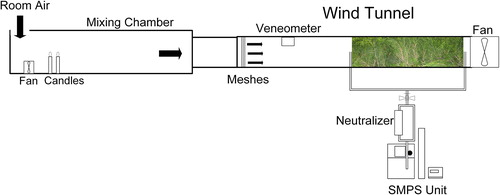
Figure 2. Left panel is a single juniper branch. Right panel is a picture illustration of the juniper branches positioned in the wind tunnel.
A Scanning Mobility Particle Sizer (SMPS, model 3080 with a CPC 3010, TSI Inc., MN. USA) was used to measure the particle concentration at ports before and after the vegetation section. Three different wind speeds (U0 = 0.3, 0.6, and 0.9 m/s) were tested. For each U0, six sets of size distribution scans were performed. Each set contains one upstream and one downstream measurement. The SMPS scan rate was set to 90 s upscan and 30 s downscan. We also accounted for the sampling differences between the two ports by sampling without the vegetation. The test results indicate the differences between the two ports were within 10%.
At the end of the experiment, the vegetation volume was determined by submerging the branches in a 1 L graded cylinder (SIBATA, Saitama, Japan) that was half-filled with water. Vegetation leaf area (=6.38 m2) was computed by first scanning the leaf using a scanner (Epson Perfection V30, Tokyo, Japan) and then using an image processing routine to convert image pixels into leaf area using a MATLAB image analysis functions. The leaf area used here resulted in a packing density defined as vegetation volume to total volume of about 11.7%. The Leaf Area Density (LAD), which is defined as the vegetation surface area per unit volume, was around 264 m2/m3. To minimize the changes in vegetation volume and leaf area, the experiments were completed within 48 h after harvesting the branches from the field. Since the experiments were performed in a temperature- and RH-controlled room, the vegetation volume change was less than 5% during each experiment, indicating minimal plant material drying.
2.2. Filtration theory
The single-fiber filtration theory was first used to describe the particle penetration of fibrous filters (Wiedensohler and Fissan Citation1988). According to the single-fiber filtration theory, the filter’s particle collection efficiency (E), and particle penetration efficiency (P) can be expressed as (Brown Citation1993):
(3)
(3)
(4)
(4)
In EquationEquations (3)(3)
(3) and Equation(4)
(4)
(4) , l is the thickness of the filter, which is the length of the wind tunnel section filled with vegetation here; E∑ is the overall collection efficiency of a single fiber that incorporates collection due to diffusion (ED), impaction (EIMP), interception (EINT) and the image force (EIM), the df is the diameter of the fiber (effective diameter). Since impaction and interception are both minor for charged and uncharged UFP (Litschke and Kuttler Citation2008; Petroff et al. Citation2008; Pryor et al. Citation2008), the main collection mechanism for zero-charge UFP is Brownian diffusion. Thus, the vegetation effective diameter can be obtained by fitting EquationEquation (4)
(4)
(4) to particle penetration data when ED is the only UFP collection mechanism to be considered. For both charged and uncharged UFP, ED can be expressed using (Friedlander Citation2000):
(5)
(5)
where Re is a particle Reynolds number defined as:
(6)
(6)
where ρ is the air density, η is the air viscosity, and Pe is the Peclet number expressed as:
(7)
(7)
where D is the particle diffusion coefficient determined from the Stokes-Einstein equation expressed as (Perrin Citation1910):
(8)
(8)
where k is the Boltzmann constant, T is temperature (in K), and the previously defined Cc is needed when calculating D. It is given as (Allen and Raabe Citation1982):
(9)
(9)
where λ is the molecular mean free path of air.
The D is inversely proportional to particle diameter, which leads to a higher deposition efficiency for smaller particles relative to larger ones.
2.2.1. Particle penetration for singly and zero charged particle
The following equations are used to express the penetration of singly positive (), singly negative (
) and zero charged particle (P0):
(10)
(10)
where ni,j (i is the location, 1 and 2 represents the upstream and downstream of the wind tunnel, respectively; j is the number of charge; + and – indicates positive and negative charges) represents the UFP number concentration. The P1+ was determined by performing measurements with the SMPS neutralizer removed. This way, only charged particles are detected by the SMPS. It should be noted that both positively and negatively charged particles contribute to the overall particle deposition. The total penetration efficiency, that is, of both neutral and charged particles, Pt, measured when the neutralizer is used, is given as:
(11)
(11)
We then multiply both sides by to obtain:
(12)
(12)
By combining EquationEquations (10)(10)
(10) and Equation(12)
(12)
(12) , we obtain:
(13)
(13)
In our experiments, we measured penetration only of positively charged particles. It is reasonable to assume that positively and negatively singly charged particles have the same image force induced deposition velocity and that the penetration for singly positively and negatively charged particle is the same. Thus, . Dividing EquationEquation (13)
(13)
(13) by n10, we obtain:
(14)
(14)
where f1+=n11+/n10 and f1−=n11−/n10 is the fraction of the singly positive and negative charged particle over zero charged particle, respectively, at the upstream sampling point. Since the particles are at charge equilibrium, f1+ and f1− can be obtained from a Boltzmann charge distribution given as (Wiedensohler and Fissan Citation1988):
(15)
(15)
where C = 1 and ai are the equation coefficients. The penetration for zero charged particles can then be obtained as:
(16)
(16)
The above derivation ignores contributions of multiply charged particles. To assess the contribution of multiply charged particles to the measured concentrations of charged particles, we used the TDMA method. The first DMA was used to select particles of 25, 50, 75, and 100 nm electrical mobility diameters. Size distributions of the selected particles were then measured using an SMPS of the TDMA system and the relative abundance of singly and multiply charged particles were determined. These measurements showed that concentrations of 2+ and 3+ particles at each mobility size were less than 10% of the concentrations of singly charged particles, justifying our approach to calculate P0 and P1+ here ().
Table 1. Percentage of the singly, doubly, and triply charged particle at different sizes (25, 50, 75, and 100 nm) from TDMA results.
3. Results and discussion
shows the UFP penetration with and without using the neutralizer that is used to obtain Pt and P1, respectively. These quantities can be used to calculate P0. The measured penetration as a function of UFP size for singly charged and neutral particles at all 3 wind speeds is shown in . As expected, increasing UFP size increases penetration (or reduces dry deposition) for both particle types. For the smallest resolved UFP size here, the singly charged particles experienced lower penetration than their neutral counterparts suggesting significant charge contribution to the overall deposition at all 3 wind speeds. These data are now used to explore the parameters needed to describe EIM. In the following discussion, the parameters of the single fiber theory model are first derived when considering both the Brownian diffusion and the image force. The derived model parameters are then used to predict the penetration of singly charged and zero charged particles. The model performance is assessed by comparing its predictions with the experimental results.
Figure 3. Penetration values as a function of UFP diameter with (blue) and without (red) the neutralizer in the wind tunnel for different mean wind speeds Uo.
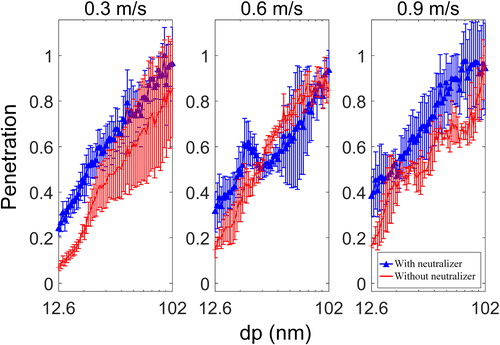
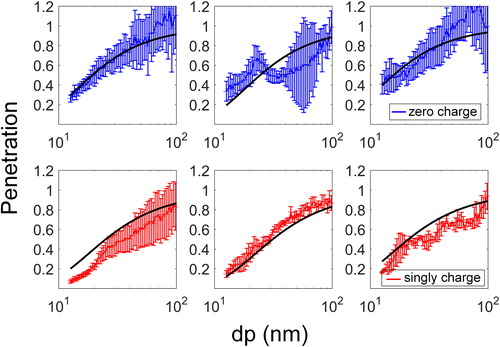
Figure 4. The comparison between measured and fitted penetration values for zero charged (top row) and singly charged (bottom row) particles as a function of UFP diameter.
3.1. Single fiber theory model parameterization
Brownian diffusion and the image force are the two primary deposition mechanisms for UFP here. In single fiber theory, the total collection mechanism may be treated as the superposition of each collection mechanism though interactive effects between them may not be small as discussed elsewhere (Lee et al. Citation2002; Ramarao, Tien, and Mohan Citation1994). To explore possible interactive effects, the total collection efficiency (E∑) is assumed to be the sum of Brownian diffusion (ED), the image force (EIM) and possible interactive effect (assumed to be multiplicative) given as:
(17)
(17)
where a, b, and c are the parameters for the interactive effects between ED and EIM that are sought for different Uo. To interpret the interaction term, three cases are considered: (i) When a = 0, the interactive effect can be ignored. (ii) When a is finite but b and c are near-zero, then there is no dynamic interaction between ED and EIM, and to a leading order, it is statistically impossible to distinguish between interactive effects and modifying
by a. (iii) When all coefficients are finite, then the interaction term is dynamically significant and can be delineated from the experiments. Upon substituting EquationEquations (1)
(1)
(1) and Equation(5)
(5)
(5) into EquationEquation (17)
(17)
(17) , the following is obtained:
(18)
(18)
Taking the natural logarithm of both sides yields:
(19)
(19)
This form is now amenable to linear regression analysis for parameter estimation. We first use linear regression analysis to find the interaction parameters (a, b, and c) at different (but pre-fixed) β. Then, β is varied and the analysis is repeated to determine a, b, and c until β that minimizes the root mean square percentage error (RMSPE) between model and measurements is found. The RMSPE is defined as:
(20)
(20)
where M is the number of measured points and residue is the difference between the model and measurements for point i. When this procedure is applied to the data, β = 14.4 and the corresponding a, b, and c values are 10.1, 0.03, and −0.03, respectively. EquationEquation (18)
(18)
(18) becomes:
(21)
(21)
In the third term of EquationEquation (21)(21)
(21) , Re0.03 and Pe−0.03 are sufficiently close to unity so that their effect may be omitted from the analysis. Hence, the main terms involving
are now lumped together to yield 24.5×
and EquationEquation (21)
(21)
(21) can be expressed as:
(22)
(22)
Since the optimal interaction term here does not include any Re or Pe dependency despite the large variations in Uo and dp, then there is no “dynamic” interaction between ED and EIM and the analysis cannot distinguish between interactive effects or increasing the coefficient β to 24.5 while ignoring the interaction term. By incorporating published studies, a “meta-analysis” is now conducted to assess whether EIM = 24.5× agrees with other image force studies summarized in . Although the size range is similar to those reported in another study conducted by Alonso et al. (Citation2007), the dimensionless number KIM (10−10 ∼ 10−8) in this study is smaller than Alonso’s study where KIM (10−7 ∼ 10−5). Since KIM is known to affect the image force, the β value from our study is larger than the Alonso’s study. However, it should be noted that the trend is similar for both studies, with β values increasing with a decreasing KIM, regardless of the filter material used (). Due to the increase in β value as KIM decreases, the image force cannot be ignored even when KIM is as small as 10−10. shows the KIM plotted against the image force efficiencies (EIM), which was obtained by subtracting the diffusion term from the experimentally measured penetration values in EquationEquation (22)
(22)
(22) .
Figure 5. The coefficient as a function of KIM for different studies. Note the increase in
with declining KIM.
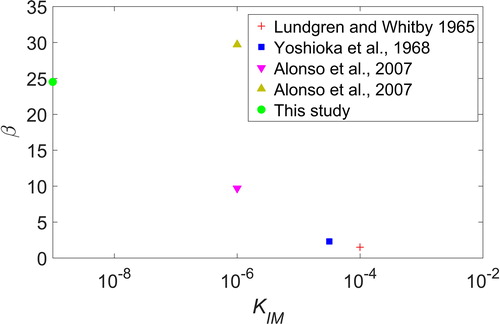
Figure 6. The relation between single fiber efficiency of image force (EIM) and the dimensionless number (KIM) for the 3 wind speed conditions.
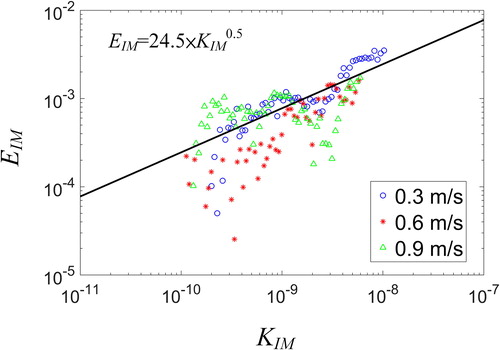
Table 2. Comparison of the image force in single fiber theory from different studies.
3.2. Model goodness of fit
shows the coefficient of determination (R2) and RMSPE values when fitting the model to all the measurements for singly charged and zero charged particles. The R2 exceeded 0.5 for all 3 Uo runs and the RMSPE values did not exceed 67%. Larger RMSPE values for singly charged particles as compared to zero charged particles can be attributed to uncertainties in the image force term in EquationEquation (21)(21)
(21) . illustrates the penetration of zero and singly charged UFP at different wind speeds for the measurement and model results. Results indicate that the penetration values for singly charged particles are consistently lower than those for zero charged particles, which can only be interpreted as enhanced vegetation collection due to the image force (as expected). Thus, the image force cannot be neglected when describing the collection by vegetation even for UFP as small as 12 nm. It should be noted that when the wind speed is at 0.6 m/s, the penetration value for singly charged and zero charged particle are similar in the particle diameter range of 40–102 nm. This could be attributed to the larger measurement uncertainty for zero charged particles at this size range (see error bar in ). shows the modeled and measurement penetration values for both zero charged and singly charged particles. Overall, the penetration is lower for singly charged particles as compared to zero charged particles due to the image force. The calibrated model results and measurements mostly deviate by less than 20%, showing that the single fiber theory can be used to describe the vegetation collection efficiency of singly charged and zero charged UFP. Larger deviations were evident for singly charged particle as compared to zero charged UFP, probably due to uncertainties in the image force term.
Figure 7. Scatter plot of the modeled and measured penetration for zero and singly charged particles. The solid line is the 1:1 relation and the dotted line is 20% deviance from the solid line.
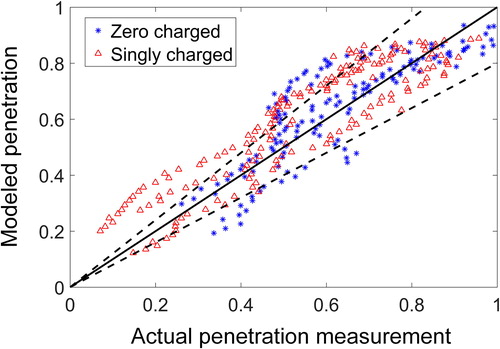
Table 3. The goodness of fit values (R2 and RMSPE) between model and measurements for zero charged and singly charged particles.
4. Conclusions
Filtration theory, when considering both Brownian diffusion and image force can reasonably explain the deposition of singly charged UFP onto vegetation. Measurement and model results mostly do not deviate by more than 20% and the R2 and RMSPE values were larger than 0.5 and less than 67%, respectively, indicating that the vegetation can be reasonably treated as fibers. The derived image force from the experiments here can be summarized by 24.5×, which agree with other studies that show the effective β increases with decreasing KIM. When interpreted across experiments, the increase in β with decreasing KIM may be approximated by a power-law with an exponent that is larger than 0.5 in magnitude. Hence, the product of β
will increase with decreasing KIM. This study is limited to the UFP particle removal of certain charge by a certain vegetation species. While the results of this study could probably be applied to describe deposition of charged UFP to other vegetation species with similar leaf morphology, further wind tunnel and field studies with other vegetation types are needed to verify the application of single fiber theory to the removal of charged UFP at different KIM. This is the first study to characterize the contribution of image force to deposition of singly charged particle to vegetation at such small KIM. The novelty may be viewed as twofold: (1) The data from experiments at very small KIM empirically showing that the image force can still explain enhanced deposition when referenced to neutral particles, and (2) filtration theory modified to include the aforementioned image force reproduces the experiments for all 3 wind speeds considered. Single fiber theory can be applied to describe the particle deposition of charged UFP for junipers and potentially other confiner species where the vegetation morphology is more similar to the fiber. For other vegetation type such as broadleaf, other models such as the porous canopy are more suited (Lin, Katul, and Khlystov Citation2012). It is safe to state that when describing the UFP collection mechanism onto vegetation, the image force needs to be considered even for 12 nm singly charged UFP that have very small KIM (∼10−10).
Additional information
Funding
References
- Allen, M. D., and O. G. Raabe. 1982. Re-evaluation of Millikan oil drop data for the motion of small particles in air. J. Aerosol Sci. 13 (6):537–547. doi:10.1016/0021-8502(82)90019-2.
- Alonso, M., F. J. Alguacil, J. P. Santos, N. Jidenko, and J. P. Borra. 2007. Deposition of ultrafine aerosol particles on wire screens by simultaneous diffusion and image force. J. Aerosol Sci. 38 (12):1230–1239. doi:10.1016/j.jaerosci.2007.09.004.
- Brown, R. C. 1993. Air filtration. Oxford, England: Elsevier Science.
- Buckley, A. J., M. D. Wright, and D. L. Henshaw. 2008. A technique for rapid estimation of the charge distribution of submicron aerosols under atmospheric conditions. Aerosol Sci. Technol. 42 (12):1042–1051. doi:10.1080/02786820802400645.
- Cohen, B. S., J. Q. Xiong, C. P. Fang, and W. Li. 1998. Deposition of charged particles on lung airways. Health Phys. 74 (5):554–560. doi:10.1097/00004032-199805000-00002.
- Dick, C. A. J., D. M. Brown, K. Donaldson, and V. Stone. 2003. The role of free radicals in the toxic and inflammatory effects of four different ultrafine particle types. Inhalation Toxicology 15 (1):39–52. doi:10.1080/08958370304454.
- Faiola, C., A. M. Johansen, S. Rybka, A. Nieber, C. Thomas, S. Bryner, J. Johnston, M. Engelhard, P. Nachimuthu, and K. S. Owens. 2011. Ultrafine particulate ferrous iron and anthracene associations with mitochondrial dysfunction. Aerosol Sci. Technol. 45 (9):1109–1122. doi:10.1080/02786826.2011.581255.
- Friedlander, W. C. 2000. Smoke, dust and haze: Fundamentals of aerosol dynamics. New York: Oxford University Press.
- Gordon, M., and P. A. Taylor. 2009. The electric field during blowing snow events. Boundary-Layer Meteorol. 130 (1):97–115. doi:10.1007/s10546-008-9333-7.
- Hagler, G. S. W., M. Y. Lin, A. Khlystov, R. W. Baldauf, V. Isakov, J. Faircloth, and L. E. Jackson. 2012. Field investigation of roadside vegetative and structural barrier impact on near-road ultrafine particle concentrations under a variety of wind conditions. Sci. Total Environ. 419 :7–15. doi:10.1016/j.scitotenv.2011.12.002.
- Hansen, M. C., R. S. Defries, J. R. G. Townshend, and R. Sohlberg. 2000. Global land cover classification at 1km spatial resolution using a classification tree approach. Int. J. Remote Sens. 21 (6–7):1331–1364. doi:10.1080/014311600210209.
- Hosseini, S. A. O., S. Zandi, A. Fallah, and M. Nasiri. 2016. Effects of geometric design of Forest road and roadside vegetation on traffic noise reduction. J. For. Res. 27 (2):463–468. doi:10.1007/s11676-015-0187-9.
- Huang, C. W., S. Launiainen, T. Gronholm, and G. G. Katul. 2014. Particle deposition to forests: An alternative to k-theory. Atmos. Environ. 94 :593–605. doi:10.1016/j.atmosenv.2014.05.072.
- Huang, C. W., M. Y. Lin, A. Khlystov, and G. Katul. 2013. The effects of leaf area density variation on the particle collection efficiency in the size range of ultrafine particles (ufp). Environ. Sci. Technol. 47 (20):11607–11615. doi:10.1021/es4013849.
- Huang, C. W., M. Y. Lin, A. Khlystov, and G. G. Katul. 2015. The effects of leaf size and microroughness on the branch-scale collection efficiency of ultrafine particles. J. Geophys. Res. Atmos. 120 (8):3370–3385. doi:10.1002/2014JD022458.
- Hussein, T., A. Puustinen, P. P. Aalto, J. M. Makela, K. Hameri, and M. Kulmala. 2004. Urban aerosol number size distributions. Atmos. Chem. Phys. 4 (2):391–411. doi. doi:10.5194/acp-4-391-2004.
- Katul, G. G., T. Gronholm, S. Launiainen, and T. Vesala. 2010. Predicting the dry deposition of aerosol-sized particles using layer-resolved canopy and pipe flow analogy models: Role of turbophoresis. J. Geophys. Res. Atmos. 115 :16. doi:10.1029/2009jd012853.
- Katul, G. G., and D. Poggi. 2011. A note on aerosol sized particle deposition onto dense and tall canopies situated on gentle cosine hills. Tellus Series B-Chem. Phys. Meteorol. 63 (3):395–400. doi:10.1111/j.1600-0889.2011.00528.x.
- Kraemer, H. F., and H. F. Johnstone. 1955. Collection of aerosol particles in presence of electrostatic fields. Ind. Eng. Chem. 47 (12):2426–2434. doi:10.1021/ie50552a020.
- Lee, E. S., B. Xu, and Y. F. Zhu. 2012. Measurements of ultrafine particles carrying different number of charges in on- and near-freeway environments. Atmos. Environ. 60 :564–572. doi:10.1016/j.atmosenv.2012.06.085.
- Lee, M., Y. Otani, N. Namiki, and H. Emi. 2002. Prediction of collection efficiency of high-performance electret filters. J. Chem. Eng. Jpn. 35 (1):57–62. doi:10.1252/jcej.35.57.
- Lin, M., G. G. Katul, and A. Khlystov. 2012. A branch scale analytical model for predicting the vegetation collection efficiency of ultrafine particles. Atmos. Environ. 51 :293–302. doi:10.1016/j.atmosenv.2012.01.004.
- Lin, M. Y., and A. Khlystov. 2012. Investigation of ultrafine particle deposition to vegetation branches in a wind tunnel. Aerosol Sci. Technol. 46 (4):465–472. doi:10.1080/02786826.2011.638346.
- Litschke, T., and W. Kuttler. 2008. On the reduction of urban particle concentration by vegetation - a review. Meteorol. Z. 17 (3):229–240. doi:10.1127/0941-2948/2008/0284.
- Lundgren, D. A., and K. T. Whitby. 1965. Effect of particle electrostatic charge on filtration by fibrous filters. Ind. Eng. Chem. Process Des. Develop. 4 :345. doi:10.1021/i260016a001.
- Moore, K., M. Krudysz, P. Pakbin, N. Hudda, and C. Sioutas. 2009. Intra-community variability in total particle number concentrations in the San Pedro harbor area (Los Angeles, California). Aerosol Sci. Technol. 43 (6):587–603. doi:10.1080/02786820902800900.
- Morakinyo, T. E., and Y. F. Lam. 2016. Simulation study on the impact of tree-configuration, planting pattern and wind condition on street-canyon's micro-climate and thermal comfort. Build. Environ. 103 :262–275. doi:10.1016/j.buildenv.2016.04.025.
- Neft, I., M. Scungio, N. Culver, and S. Singh. 2016. Simulations of aerosol filtration by vegetation: Validation of existing models with available lab data and application to near-roadway scenario. Aerosol Sci. Technol. 50 (9):937–946. doi:10.1080/02786826.2016.1206653.
- Ostro, B., J. L. Hu, D. Goldberg, P. Reynolds, A. Hertz, L. Bernstein, and M. J. Kleeman. 2015. Associations of mortality with long-term exposures to fine and ultrafine particles, species and sources: Results from the California teachers study cohort. Environ. Health Perspect. 123 (6):549–556. doi:10.1289/ehp.1408565.
- Perrin, J. 1910. Brownian movements and molecular reality. London: Taylor and Francis.
- Peters, A., H. E. Wichmann, T. Tuch, J. Heinrich, and J. Heyder. 1997. Respiratory effects are associated with the number of ultrafine particles. Am. J. Respir. Crit. Care Med. 155 (4):1376–1383. doi:10.1164/ajrccm.155.4.9105082.
- Petroff, A., A. Mailliat, M. Amielh, and F. Anselmet. 2008. Aerosol dry deposition on vegetative canopies. Part I: Review of present knowledge. Atmos. Environ. 42 (16):3625–3653. doi:10.1016/j.atmosenv.2007.09.043.
- Pryor, S. C., M. Gallagher, H. Sievering, S. E. Larsen, R. J. Barthelmie, F. Birsan, E. Nemitz, J. Rinne, M. Kulmala, T. Grönholm, R. Taipale, and T. Vesala. 2008. A review of measurement and modelling results of particle atmosphere-surface exchange. Tellus Series B-Chem. Phys. Meteorol. 60 (1):42–75. doi:10.1111/j.1600-0889.2007.00298.x.
- Ramarao, B. V., C. Tien, and S. Mohan. 1994. Calculation of single-fiber efficiencies for interception and impaction with superposed Brownian-motion. J. Aerosol Sci. 25 (2):295–313. doi:10.1016/0021-8502(94)90081-7.
- Schmid, O., W. Moller, M. Semmler-Behnke, G. A. Ferron, E. Karg, J. Lipka, H. Schulz, W. G. Kreyling, and T. Stoeger. 2009. Dosimetry and toxicology of inhaled ultrafine particles. Biomarkers 14 (sup1):67–73. doi:10.1080/13547500902965617.
- Ting, C. L., and Z. G. Wang. 2011. Interactions of a charged nanoparticle with a lipid membrane: Implications for gene delivery. Biophys. J. 100 (5):1288–1297. doi:10.1016/j.bpj.2010.11.042.
- Wichmann, H. E., and A. Peters. 2000. Epidemiological evidence of the effects of ultrafine particle exposure. Philos. Trans. Roy. Soc. Lond. Series A-Math. Phys. Eng. Sci. 358 (1775):2751–2768. doi:10.1098/rsta.2000.0682.
- Wiedensohler, A., and H. J. Fissan. 1988. Aerosol charging in high-purity gases. J. Aerosol Sci. 19 (7):867–870. doi:10.1016/0021-8502(88)90054-7.
- Yoshioka, N., H. Emi, and I. Tamori. 1968. Effect of electrostatic force in the filtration efficiency of aerosol. Kagaku Kogaku 32:815–820. doi:10.1252/kakoronbunshu1953.32.815.