
 ?Mathematical formulae have been encoded as MathML and are displayed in this HTML version using MathJax in order to improve their display. Uncheck the box to turn MathJax off. This feature requires Javascript. Click on a formula to zoom.
Abstract
EDITOR:
Introduction
Most combustion processes involve imperfect mixing of fuel and air which results in locally fuel-rich, hot conditions that produce soot. Soot is an important climate-forcing agent, contributor to air pollution impacts, and (as “carbon black”) an important commercial product.
The impacts of soot, as well as the interpretation of measurements, depend on the gross morphology of the particles as well as the nanostructure—that is, the chemical composition of the soot and the degree to which the carbon has formed ordered graphitic planes.
The chemical mechanisms of soot formation involve overlapping processes of nucleation, surface growth, carbonization, and aggregation (Frenklach Citation2002), leading to fractal aggregates of “primary particles” (, typical soot aggregates with 10–30 nm primary particles). The primary particle size and degree of graphitization varies substantially, and is not easily predicted from current models. However, the gross structure of a soot aggregate is well-modelled by Brownian coagulation of perfectly-sticking clusters (i.e., Diffusion Limited Cluster Aggregation model) (Meakin Citation1988). In typical DLCA simulations, a control volume is populated with uniformly-sized primary particles (diameter d p) that are allowed to aggregate until only a single large cluster remains. This model predicts a fractal dimension of D f ∼ 1.8, matching micrographs of real soot.
Figure 1. Typical transmission electron microscopy (TEM) image of soot from a large laboratory scale turbulent, nonpremixed flame.
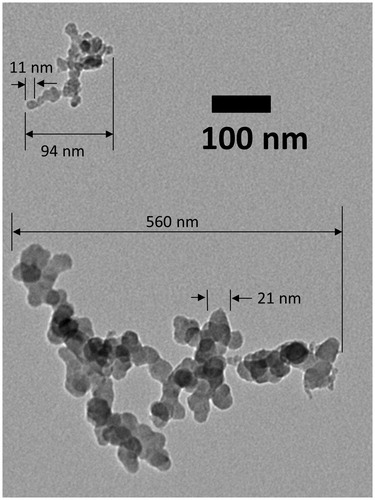
It has recently been observed for several combustion sources that primary particle diameter increases with aggregate dimensions, and that within each aggregate, the primary particle size is relatively uniform (Dastanpour and Rogak Citation2014; see for two aggregates with contrasting primary particle sizes). Such patterns could be explained by an ensemble of noninteracting DLCA processes, each with its own primary particle size. This is a plausible hypothesis because in nonpremixed flames, soot is formed in very small regions of the combustion chamber, and over 90% is oxidized shortly after formation. Therefore, concentrations (and coagulation rates) are reduced by at least 2–4 orders of magnitude shortly after formation. This means that every aggregate comes from a single soot forming zone in the flame, and the variations between aggregates should reflect the distribution of conditions present in the flame. Because the properties derived from local formation conditions are relatively uniform within aggregates, but diverse for the whole aerosol population, we call this the “external mixing hypothesis.” An implication of this hypothesis is that the material, chemical, and optical properties of each aggregate should vary with the primary particle size. Indeed, measurements of light absorption Dastanpour et al. (Citation2017) and Forestieri et al. (Citation2018) support this.
The purpose of this letter is to demonstrate that available data for nonpremixed flame soot supports the external mixing hypothesis. We show that effective density measurements, interpreted using established models for aggregates of typical D f = 1.8 fractal dimension, point to primary particle size increasing with aggregate size. TEM measurements confirm that a) the aggregates have the open aggregate structure typical of DLCA soot and that b) the primary particle size increases are remarkably close to that predicted from effective density. Given the broad range of soot sources considered here, these scaling relations appear to be the natural habit of soot from non-premixed sources. The similarity of the scaling for diverse sources leads to approximate relations for effective density and primary particle size that can be used in the absence of source-specific information.
Methods
The evidence considered comes from a review of published data of effective density and primary particle size measurements from dozens of combustion sources and operating conditions. The effective density (or mass-mobility relationship) of soot particles can be determined using a tandem arrangement of two out of a possible three different instruments: a mobility classifier (e.g., differential mobility analyzer), a mass classifier (e.g., centrifugal particle mass analyzer (CPMA) or aerosol particle mass analyzer); or an inertial classifier (e.g., electrical low pressure impactor or aerodynamic aerosol classifier) as shown, for example, by McMurry et al. (Citation2002), Maricq and Xu (Citation2004), Olfert, Symonds, and Collings (Citation2007), and Tavakoli and Olfert (Citation2014). Aggregate and primary particle size can be obtained from TEM analysis of samples that have been thermophoretically or electrostatically deposited on thin films. TEM offers subnanometer resolution, but considering practical issues in sampling, image quality, sample size and image processing, it is probably reasonable to consider the errors in aggregate and primary particle size to be on the order of 10% (further discussion of TEM uncertainty in online supplementary information [SI]).
The relationship between effective density, mobility, and primary particle size
From mass-mobility measurements, the mass-mobility relationship of the particles is typically expressed using a power law,
(1)
(1)
where m is the mass of a particle, k is the mass-mobility prefactor, d
m is the particle mobility diameter, and D
m is the mass-mobility exponent. This can be used in the definition of the effective density,
(2)
(2)
Measurements of the effective density can then be used to estimate the average primary particle size using the method of Eggersdorfer et al. (Citation2012), a method that was later optimized by Dastanpour et al. (Citation2016) for soot. The approach estimates the Sauter mean diameters of the primary particles, as
(3)
(3)
where ρ is the material density of the soot. EquationEquation (3)
(3)
(3) is an empirical relation, applicable to an individual aggregate of mass m and mobility diameter d
m. The form of EquationEquation (3)
(3)
(3) arises from consideration of the degree of “shielding” of primary particles as m increases. This model was calibrated using TEM images from two types of internal combustion engines to obtain D
α = 1.1 and k
a = 1.13 (Dastanpour et al. Citation2016), which are the parameter values adopted throughout this review. Using the mass-mobility exponent (EquationEquation (1)
(1)
(1) ), this can be rewritten as
(4)
(4)
We define the exponent of the second term as D TEM, and this will be positive if D m > 2D α. For the parameters used here, we get D TEM = 0 for D m = 2.2. This is precisely the value of D m recommended by Sorensen (Citation2011) for “normal” (fractal dimension ∼1.8) in the transition regime, assuming constant primary particle size.
Introducing a new parameter, the effective density for a 100 nm aggregate, we can compute the average primary particle diameter for a 100 nm aggregate as
(5)
(5)
Simplifying further,
(6)
(6)
This choice of a 100 nm reference scale is arbitrary but physically useful because it normally falls within range of aggregate sizes found for soot, and makes the fitted parameters physically tangible. Assuming that d va ∼ d p and using ρ = 1800 kg/m3, we can then use effective density to estimate primary particle diameter.
From our previous work, the primary particle size is usually correlated with projected-area-equivalent diameter d
a, and we model this with a power law form:
(7)
(7)
Comparing this with EquationEquations (5)–(6), if d
p ∼ d
va and d
a ∼ d
m, then D
TEM will be the exponent of EquationEquation (4)(4)
(4) , (2D
α – D
m)/(2D
α – 3) (Dastanpour et al. Citation2016).
Implication of external mixing for effective density and primary particle size scaling
illustrates the external mixing hypothesis for soot and the implications for the measurements discussed in this article. Suppose that we could sample aggregates arising from four locally-homogenous regions of the flame where the primary particle size within each region is the same, yet different from the other regions (green, blue, red, black aggregates). If we plotted the average primary particle diameter, d p, in each aggregate against projected-area-equivalent diameter, d a, data from each flame zone would form horizontal bands. For each band, d p is independent of d a, but the variation of d p would decrease with aggregate size (larger aggregates contain a larger sample of primaries). In reality, postflame samples contain soot from many flame zones: on a plot of d p versus d a we do not see distinct horizontal bands, but rather a cloud with increasing d p. By itself, the external mixing hypothesis does not guarantee that primary particle should increase with aggregate size: flame zones producing larger primary particles might produce aggregates with fewer primaries. However, this is not consistent with typical TEM images (e.g., ). The relation between d p and d a would depend on the distribution of soot-forming conditions in the flame, and there is no reason to believe that this should be of a particular mathematical form, but a power law is simple and easily combined with the conventional relations for fractal aggregates.
Figure 2. Schematic of the “external mixing hypothesis”: different flame zones would produce aggregates (green, blue, red, black) with primary particle size d p independent of area-equivalent diameter d a (upper right hypothetical graph). Effective density plotted in lower right panel.
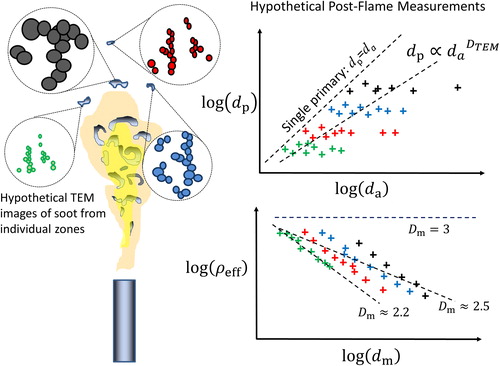
The lower right panel of illustrates the effective density curves that would be measured for soot from individual flame zones. As discussed above, the effective density typically scales with mobility diameter according to For soot from the same zone, we expect to see the behavior of DLCA aggregates in the transition regime, for which D
m ∼ 2.2 (Sorensen Citation2011). The mixture of soot (all colors in ) would have a higher mass-mobility exponent. The broad distribution of effective density for each mobility size is not apparent in published data because conventionally, only the peak mass (or effective density) is typically reported for each mobility size; in cases where the distribution of effective densities is shown, the distribution is very broad (Rawat et al. Citation2016).
Results
summarizes effective density measurements from many authors for several source categories, only considering fresh soot where volatile material was removed (via thermal or catalytic denuding) or in some circumstances where the amount of volatile material was relatively low. Results are shown for: compression ignition engines fueled with diesel or natural gas (Fujitani et al. Citation2016; Graves et al. Citation2015; Leung et al. Citation2017; Maricq and Xu Citation2004; Olfert, Symonds, and Collings Citation2007; Rissler et al. Citation2013); spark ignition engines fueled with gasoline or ethanol blends (Dastanpour et al. Citation2016; Graves, Koch, and Olfert Citation2017; Momenimovahed and Olfert Citation2015); gas turbines (Johnson et al. Citation2015; Olfert et al. Citation2017); and a wide range of premixed and non-premixed burners (Dickau et al. Citation2016; Ghazi et al. Citation2013; Kazemimanesh et al. Citation2019; Pagels et al. Citation2009; Rissler et al. Citation2013). Results from individual studies that went into the summaries are shown in the SI.
Figure 3. Compilation of effective density measurements.
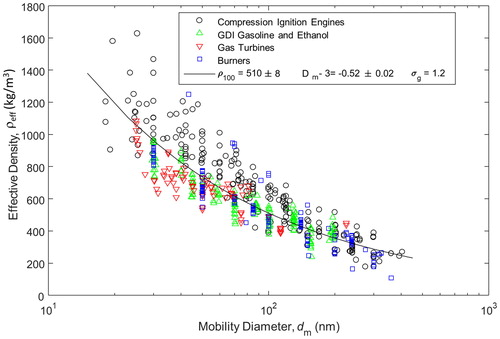
The data have been fit with the form prescribed by EquationEquation (2)(2)
(2) , yielding the prefactor and exponent,
(8)
(8)
The exponent here immediately gives a mass-mobility exponent of D
m = 2.48. Moreover, evaluating EquationEquation (5)(5)
(5) about a reference projected-area diameter of 100 nm, we find that,
(9)
(9)
Due to the large number of data points in the regression, the 95% confidence interval around D
m is very narrow. However, there is substantial scatter around EquationEquation (8)(8)
(8) (geometric standard deviation of residuals is 1.2, i.e., 20% variation), and some sources are consistently biased with respect to the fit. For example, compression-ignition engines tend to produce soot with higher effective densities, while gas-turbine soot tends to have lower effective densities. also includes measurements for soot from a laminar, premixed flame (Ghazi et al. Citation2013). These data yield D
m = 2.2 – substantially less than the individual fits for the nonpremixed combustion sources. However, because this dataset is well within the envelope of the other measurements, and is only one study of many plotted, the fitted parameters change by less than 1% (statistically insignificant) when the premixed flame data are removed. Despite some physically significant differences between the datasets in , to simplify the subsequent discussions, we will refer to EquationEquations (8)
(8)
(8) and Equation(9)
(9)
(9) as the “universal soot fit.”
Interestingly, TEM measurements are consistent with EquationEquation (9)(9)
(9) . For example, shows a plot of the average primary particle size in an aggregate against the projected-area diameter of the aggregate, obtained for a large turbulent flame of mostly methane (the same flame producing the particles in ; Kazemimanesh et al. Citation2019). A power-law fit to the TEM measurements (solid curve) is statistically identical to the predictions from EquationEquation (6)
(6)
(6) , which used the effective-density measurements for that soot source. The scatter around the fit in is much larger than measurement error, and physically significant. The geometric standard deviationFootnote
1
of this residual, σ
g, is 1.33 for the data in , and for all of the studies in , is about 1.45. This large variation is additional support for the external mixing hypothesis for the following reason. Each point plotted in is the average of primary particle diameters in a single aggregate. As the number of primaries, N, in the aggregate increases, the standard error of the means should decrease as 1/N
0.5. That is, if the largest aggregates were formed by coagulation of primary particles from all parts of the flame, one would expect the scatter to decrease for large d
a – which does not happen in or similar plots that we have examined.
Figure 4. Sample of TEM measurements from a buoyant, turbulent non-premixed flame.
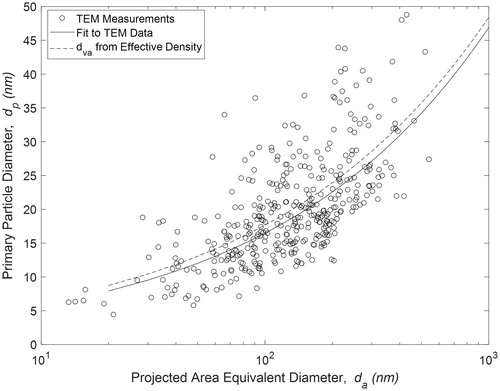
Table 1. Summary of fit parameters for studies including both effective density and TEM measurements.
Over the last decade, we have collected both TEM data and effective density data for a range of source types (). This is a subset of the studies presented in , but simple averages of the effective density data for d
va,100 and D
TEM are close to the parameters in EquationEquations (8)(8)
(8) and Equation(9)
(9)
(9) . The agreement with the TEM-derived d
p,100 and D
TEM is reasonable for individual studies and remarkably good on average. The results reported in Johnson et al. (Citation2015) appear least consistent with the averages. Here the very high value of D
m obtained from effective density might suggest soot compacted by liquid coatings, but the sample was conditioned by dilution and denuding and, in fact, images of this soot show normal open aggregate structures and there was no evidence of high coating levels for those samples. Indeed, the measured effective densities are very close to the “universal soot fit” as seen in the SI. TEM yielded an above-average value of D
TEM, suggesting that the main reason for high D
m is that primary particle size is increasing strongly with aggregate size, not that aggregate fractal dimension is high. Two practical issues might contribute to the discrepancy between the effective density and TEM data in Johnson et al. Firstly, the range of effective density measurements was very narrow (25–80 nm) which could bias the fit. Secondly, the particles imaged by TEM were selected in a way that biased the results towards larger aggregates.
The consistently positive values of D TEM in are strong evidence for the “external mixing” hypothesis, as, given sufficient time for coagulation, all of the aggregates would then contain all primary particle sizes yielding D TEM = 0. Recall that k a and D α (which are related to the overlap of primary particles and the fractal dimension) were determined by reconciling a small set of measurements from engines. That the model appears to work for such a broad range of soot sources implies that the aggregate morphology is quite similar for all these cases—all soot looks alike.
Most studies reporting primary particle diameters have ignored possible correlations with aggregate size, but some report the mean aggregate size. An example of this is Bogarra et al. (Citation2017), who characterized aggregates from a GDI engine at four operating conditions. As reported, the median primary particle diameter ranged from 23 to 30 nm, while the median projected area diameters ranged from 190 to 315 nm. Using D
TEM = 0.35 (from EquationEquation (9)(9)
(9) ), the primary particle diameters for 100 nm aggregates is estimated as 18.6 to 20.5 nm. This is extremely close to the values we had obtained previously for GDI engines, and close to EquationEquation (9)
(9)
(9) .
Conclusions
In recent articles, it was shown that for any particular combustion condition, primary particle size varies greatly, but is correlated with aggregate size. Now we find that primary particle scales with aggregate size with nearly the same correlation for a wide range of soot sources. This is supported independently by effective density measurements and electron microscopy. This consistency implies that the morphology (relations between mass, mobility, and primary particle size) of the soot particles is very similar from source to source because the models that link the effective density and microscopy measurements are based on constant fractal dimension and primary particle overlap. We have only reviewed data for fresh soot with coatings removed; soot collapsed by heavy coatings is not considered here. This correlation of primary particle size with aggregate size is probably valid only for soot from nonpremixed flames, considering the likely origin of this scaling (non-uniform soot-forming regions) and the fact that soot from the premixed McKenna burner appears to have a much lower value of D m (consistent with D TEM ∼ 0).
We find that to within 20% (standard deviation), for all the soot sources reviewed, the effective density follows EquationEquation (8)(8)
(8) , which implies that primary particle size follows EquationEquation (9)
(9)
(9) (d
p ∼ d
m
0.35). The predictions of EquationEquation (9)
(9)
(9) are typically within 20% of actual TEM measurements. Individual aggregates have mean primary particle diameters widely distributed about this fit, roughly lognormally with σ
g = 1.45. Within individual aggregates, the relative variations are typically much less.
There are systematic differences between classes of sources (e.g., diesel engines vs. gas turbines) and operating conditions or fuels for a given source type. For example, it is often found that changes in engine load or fuel can result in a small but statistically significant change in the effective density (e.g., Momenimovahed and Olfert Citation2015, Graves, Koch, and Olfert Citation2017). We suggest that these differences should be interpreted as differences in the scaling of primary particle size with aggregate size, not as changes in fractal dimension.
Despite these real differences in soot sources, the “universal soot correlation” and the power law forms should be useful for evaluation of new data, or for modeling in the absence of source-specific data. Given that each aggregate comes from locally homogeneous formation conditions, the consistency of the primary particle scaling relations suggests that soot surface growth and aggregation follow similar relations for common combustion systems.
Supplemental Material
Download Zip (640.6 KB)Additional information
Funding
Notes
1 The TEM data in are fit using a simple linear regression of the log-transformed variables, which is optimal if the residuals are both homoscedastic and lognormally distributed (a plausible but unproven assumption).
Related Research Data
References
- Bogarra, M. , J. M. Herreros , A. Tsolakis , A. P. E. York , P. J. Millington , and F. J. Martos . 2017. Impact of exhaust gas fuel reforming and exhaust gas recirculation on particulate matter morphology in gasoline direct injection engine. J. Aerosol Sci. 103:1–14. doi:10.1016/j.jaerosci.2016.10.001.
- Dastanpour, R. , and S. N. Rogak . 2014. Observations of a correlation between primary particle and aggregate size for soot particles. Aerosol Sci. Technol. 48 (10):1043–1049. doi:10.1080/02786826.2014.955565.
- Dastanpour, R. , S. N. Rogak , B. Graves , J. Olfert , M. L. Eggersdorfer , and A. M. Boies . 2016. Improved sizing of soot primary particles using mass-mobility measurements. Aerosol Sci. Technol. 50 (2):101–109. doi:10.1080/02786826.2015.1130796.
- Dastanpour, R. , A. Momenimovahed , K. A. Thomson , J. Olfert , and S. N. Rogak . 2017. Variation of the optical properties of soot as a function of particle mass. Carbon 124 :201–211. doi:10.1016/j.carbon.2017.07.005.
- Dickau, M. , J. Olfert , M. Stettler , A. Boies , A. Momenimovahed , K. Thomson , G. Smallwood , and M. Johnson . 2016. Methodology for quantifying the volatile mixing state of an aerosol. Aerosol Sci. Technol. 50 (8):759–772. doi:10.1080/02786826.2016.1185509.
- Eggersdorfer, M. L. , A. J. Gröhn , C. M. Sorensen , P. H. McMurry , and S. E. Pratsinis . 2012. Mass-mobility characterization of flame-made ZrO2 aerosols: Primary particle diameter and extent of aggregation. J. Colloid Interface Sci. 387 (1):12–23. doi:10.1016/j.jcis.2012.07.078.
- Forestieri, S. D. , T. M. Helgestad , A. T. Lambe , L. Renbaum-Wolff , D. A. Lack , P. Massoli , E. S. Cross , M. K. Dubey , C. Mazzoleni , J. S. Olfert , A. J. Sedlacek Iii , A. Freedman , P. Davidovits , T. B. Onasch , and C. D. Cappa . 2018. Measurement and modeling of the multiwavelength optical properties of uncoated flame-generated soot. Atmos. Chem. Phys. 18 (16):12141–12159. doi:10.5194/acp-18-12141-201
- Frenklach, M . 2002. Reaction mechanism of soot formation in flames. Phys. Chem. Chem. Phys. 4 (11):2028–2037. doi:10.1039/b110045a.
- Fujitani, Y. , K. Saitoh , Y. Kondo , A. Fushimi , A. Takami , K. Tanabe , and S. Kobayashi . 2016. Characterization of structure of single particles from various automobile engines under steady-state conditions. Aerosol Sci. Technol. 50 (10):1055–1067. doi:10.1080/02786826.2016.1218438.
- Ghazi, R. , H. Tjong , A. Soewono , S. N. Rogak , and J. S. Olfert . 2013. Mass, mobility, volatility, and morphology of soot particles generated by a McKenna and inverted burner. Aerosol Sci. Technol. 47 (4):395–405. doi:10.1080/02786826.2012.755259.
- Graves, B. , J. Olfert , B. Patychuk , R. Dastanpour , and S. Rogak . 2015. Characterization of particulate matter morphology and volatility from a compression-ignition natural gas direct-injection engine. Aerosol Sci. Technol. 49 (8):589–598. doi:10.1080/02786826.2015.1050482.
- Graves, B. M. , C. R. Koch , and J. S. Olfert . 2017. Morphology and volatility of particulate matter emitted from a gasoline direct injection engine fuelled on gasoline and ethanol blends. J. Aerosol Sci. 105:166–178. doi:10.1016/j.jaerosci.2016.10.013.
- Johnson, T. J. , J. S. Olfert , J. P. Symonds , M. Johnson , T. Rindlisbacher , J. J. Swanson , A. M. Boies , K. Thomson , G. Smallwood , D. Walters , Y. Sevcenco , A. Crayford , R. Dastanpour , S. N. Rogak , L. Durdina , Y. K. Bahk , B. Brem , and J. Wang . 2015. Effective density and mass-mobility exponent of aircraft turbine particulate matter. J. Propulsion Power 31 (2):573–582. doi:10.2514/1.B35367.
- Kazemimanesh, M. , R. Dastanpour , A. Baldelli , A. Moallemi , K. A. Thomson , M. A. Jefferson , M. R. Johnson , S. N. Rogak , and J. S. Olfert . 2019. Size, effective density, morphology, and nano-structure of soot particles generated from buoyant turbulent diffusion flames. J. Aerosol Sci . 132:22–31. doi:10.1016/j.jaerosci.2019.03.005.
- Leung, K. K. , E. G. Schnitzler , R. Dastanpour , S. N. Rogak , W. Jäger , and J. S. Olfert . 2017. Relationship between coating-induced soot aggregate restructuring and primary particle number. Environ. Sci. Technol. 51 (15):8376–8383. doi:10.1021/acs.est.7b01140.
- McMurry, P. H. , X. Wang , K. Park , and K. Ehara . 2002. The relationship between mass and mobility for atmospheric particles: A new technique for measuring particle density. Aerosol Sci. Technol. 36 (2):227–238. doi:10.1080/027868202753504083.
- Maricq, M. M. , and N. Xu . 2004. The effective density and fractal dimension of soot particles from premixed flames and motor vehicle exhaust. J. Aerosol Sci. 35 (10):1251–1274. doi:10.1016/j.jaerosci.2004.05.002.
- Meakin, P . 1988. Fractal aggregates. Adv. Colloid Int. Sci. 28 (4):249–331. doi 10.1016/0001-8686(87)80016-7. doi:10.1016/0001-8686(87)80016-7.
- Momenimovahed, A. , and J. S. Olfert . 2015. Effective density and volatility of particles emitted from gasoline direct injection vehicles and implications for particle mass measurement. Aerosol Sci. Technol. 49 (11):1051–1062. doi:10.1080/02786826.2015.1094181.
- Olfert, J. S. , J. P. R. Symonds , and N. Collings . 2007. The effective density and fractal dimension of particles emitted from a light-duty diesel vehicle with a diesel oxidation catalyst. J. Aerosol Sci. 38 (1):69–82. doi:10.1016/j.jaerosci.2006.10.002.
- Olfert, J. S. , M. Dickau , A. Momenimovahed , M. Saffaripour , K. Thomson , G. Smallwood , M. E. J. Stettler , A. Boies , Y. Sevcenco , A. Crayford , and M. Johnson . 2017. Effective density and volatility of particles sampled from a helicopter gas turbine engine. Aerosol Sci. Technol. 51 (6):704–714. doi:10.1080/02786826.2017.1292346.
- Pagels, J. , A. F. Khalizov , P. H. McMurry , and R. Y. Zhang . 2009. Processing of soot by controlled sulphuric acid and water condensation mass and mobility relationship. Aerosol Sci. Technol. 43 (7):629–640. doi:10.1080/02786820902810685.
- Rawat, V. , D. T. Buckley , S. Kimoto , M. H. Lee , N. Fukushima , and C. J. Hogan . 2016. Two dimensional size-mass distribution function inversion from differential mobility analyzer-aerosol particle mass analyzer (DMA-APM) measurements. J. Aerosol Sci. 92 :70–82. doi:10.1016/j.jaerosci.2015.11.001.
- Rissler, J. , M. E. Messing , A. I. Malik , P. T. Nilsson , E. Z. Nordin , M. Bohgard , M. Sanati , and J. H. Pagels . 2013. Effective density characterization of soot agglomerates from various sources and comparison to aggregation theory. Aerosol Sci. Technol. 47 (7):792–805. doi:10.1080/02786826.2013.791381.
- Sorensen, C. M . 2011. The mobility of fractal aggregates: A review. Aerosol Sci. Technol. 45(7):765–779. doi:10.1080/02786826.2011.560909.
- Tavakoli, F. , and J. S. Olfert . 2014. Determination of particle mass, effective density, mass–mobility exponent, and dynamic shape factor using an aerodynamic aerosol classifier and a differential mobility analyzer in tandem. J. Aerosol Sci. 75 :35–42. doi:10.1016/j.jaerosci.2014.04.010.