
 ?Mathematical formulae have been encoded as MathML and are displayed in this HTML version using MathJax in order to improve their display. Uncheck the box to turn MathJax off. This feature requires Javascript. Click on a formula to zoom.
Abstract
Simultaneous transmissivity and absorptivity measurements were carried out in the visible at a laser wavelength of 532 nm on drop-cast, carbon-black-laden filters under ambient (laboratory) conditions. The focus of this investigation was to establish the feasibility of this approach to estimate the mass absorption coefficient of the isolated particles and compare results to earlier work with the same carbon-black source. Transmissivity measurements were carried out with a laser probe beam positioned normal to the particle-laden filter surface. Absorptivity measurements were carried out using a laser-heating approach to record in time the sample temperature rise to steady-state and decay back to the ambient temperature. The sample temperature was recorded using a fine-wire thermocouple that was integrated into the transmission arrangement by placing the thermocouple flush with the filter back surface. The advantage of this approach is that the sample absorptivity can be determined directly (using laser heating) instead of resolving the difference between reflectivity (filter surface scattering) and transmissivity. The current approach also provides the filter optical characteristics, as well as an estimate of filter effects on the absorption coefficient due to particle absorption enhancement or shadowing. The approach may also be incorporated into other filter-based techniques, like the particle/soot absorption photometer, with the simple addition of a thermocouple to the commercial instrument. For this investigation, measurements were carried out with several blank uncoated quartz filters. A range of solution concentrations was prepared with a well-characterized carbon black in deionized water (i.e., a water-soluble carbonaceous material referred to as a surrogate black carbon or ‘carbon black’). The solution was then drop cast using a calibrated syringe onto blank filters to vary particle loading. After evaporation of the water, the measurements were repeated with the coated filters. The measurement repeatability (95% confidence level) was better than 0.3 K for temperature and 3 × 10⁻⁵ mW for laser power. From the measurements with both the blank and coated filters, the absorption coefficient was determined for the isolated particles. The results were then compared with an earlier investigation by You et al. and Zangmeister and Radney, who used the same carbon-black material. The measurements were also compared with Lorenz–Mie computations for a polydispersion of spherical particles dispersed throughout a volume representative of the actual particles. The mass absorption coefficient for the polydispersion of carbon-black particles was estimated to be about 7.7 ± 1.4 m2 g−1, which was consistent with the results expected for these carbon black particles.
EDITOR:
1. Introduction
Filter-based particle attenuation instruments, for example, the aethalometer, particle/soot absorption photometer (PSAP), continuous soot monitoring system (COSMOS), multi-angle absorption photometer, etc., are used to derive the absorption coefficient of atmospheric aerosols using the Beer–Lambert law. This arrangement does not consider data-interpretation complexities associated with various filter-related artifacts (e.g., absorption enhancement due to multiple scattering, and shadowing and increased reflectance due to the particle loading), thus making these instruments relatively inexpensive and easy to operate. It has been reported extensively in the literature that when compared to in-situ, nonfilter-based particle techniques to determine the aerosol absorption coefficient (e.g., a photoacoustic spectrometer, PAS), the filter-based techniques generally measure higher levels of absorption, often requiring significant corrections. Examples of the more recent investigations that discuss the different correction schemes and instrument comparisons include Backman et al. (Citation2017), Krasowsky et al. (Citation2016), Miyakawa et al. (Citation2016), Irwin, Kondo, and Moteki (Citation2015), Chen et al. (Citation2014), Baumgardner et al. (Citation2012), Ogren (Citation2010), Virkkula (Citation2010), Naoe et al. (Citation2009), Cappa et al. (Citation2008), and Fialho et al. (Citation2006). Additional scattering measurements (as with a nephelometer) enable empirical correction of the filter artifacts to determine the absorption coefficient (e.g., Coen et al. Citation2010; Bond et al. Citation2013). However, uncertainties associated with distinguishing between the extinction and scattering may lead to large errors in determining the particle absorption (Bond, Anderson, and Campbell Citation1999).
Many studies have also explored physical, optical, and/or chemical effects on absorption measurements by specific instruments. For example, the effect of filter type on absorption coefficient has been examined using different measurement techniques (e.g., Vecchi et al. Citation2014; Presser, Conny, and Nazarian Citation2014). Moteki et al. (Citation2010) describe the effect of particle size (collected on the filter) on the correction schemes used to calculate the absorption coefficient. Effects of relative humidity have been studied on particle absorption. For example, Brem et al. (Citation2012) (using a nephelometer and extinction cell) found an increase in absorption with nigrosin and organic carbon. However, Arnott et al. (Citation2003) compared an aethalometer and PSAP with a PAS and found a decrease in absorption with the PAS with increased relative humidity (beyond 70%), while the PSAP had an erratic response. This decrease in the measured PAS signal was attributed to preferential evaporation of water from the particles (Radney and Zangmeister Citation2017; Langridge et al. Citation2013; Murphy Citation2009; Lewis et al. Citation2009). Differences in the chemical composition of aerosolized carbonaceous particles and other light-absorbing non-carbon-based particle types have also made it difficult to evaluate aerosol absorption characteristics (Bond et al. Citation2013). Wang et al. (Citation2014), Lack et al. (Citation2008), Olson et al. (Citation2014) and Bond and Bergstrom (2006) discuss the biasing of light absorption due to the presence of non-black organic carbon aerosol particles and approaches to calibrate different filter-based instruments. Shrestha et al. (Citation2014) found that the presence of volatile aerosol can cause an increase in absorption if not removed by heating at the sampler inlet (comparing COSMOS, aethalometer, and the continuous light-absorption photometer). Otherwise, a decrease can be observed if the volatile species do not absorb to the filter (Subramanian et al. Citation2007). Biases result from the presence of organic (e.g., brown carbon) with black carbon for which information on individual particle and mixture characteristics is lacking because of the variability of combustion emission sources (e.g., Pandey, Pervez, and Chakrabarty [Citation2016] using a thermal/optical reflectance method). Particle mixing state and organic aerosol coatings have also been found to influence particle absorption (e.g., Cui et al. Citation2016; Liu et al. Citation2015; Radney et al. Citation2013; Lack et al. Citation2012; Cappa et al. Citation2008), as well as particle size and morphology, and their dependence on wavelength (Ångström absorption exponent) (e.g., Liu et al. Citation2018; Massabò et al. Citation2016; Utry et al. Citation2014; Lack and Langridge Citation2013). This suggests that comparison of techniques should be carried out with well-characterized, known-composition carbon sources, which represent different particle classes (e.g., Kondo et al. Citation2011).
A novel laser-heating technique has been used to measure directly the absorption coefficient of particles that were collected on filters (Presser Citation2012; Presser, Conny, and Nazarian Citation2014; Presser et al. Citation2017). The methodology involves two independent measurements of the sample spectral hemispherical absorptivity and transmissivity (i.e., the absorbed and transmitted fraction of the incident optical radiation intensity, respectively). As discussed in Presser (Citation2012), Presser, Conny, and Nazarian (Citation2014), and Presser et al. (Citation2017), the advantages of this technique include: 1) estimating particle absorptivity directly from temperature measurements (escaping the complexities that accompany the measurement of filter reflectivity/scattering), 2) averting calibration issues associated with light transmission/scattering approaches, and 3) considering (not neglecting) the filter effects on the particle absorption characteristics. The technique is applicable to uncoated filters, as well as heavily coated filters (see Presser, Conny, and Nazarian Citation2014). Limitations in detection include: 1) accurate measurement of the light transmission through the coated filter material for determining transmissivity, and 2) determination of the minimum temperature perturbation above the steady-state (laboratory temperature) to resolve the temperature decay. Both limiting conditions must be satisfied while maximizing the laser beam power without thermal damage to either the coating or filter. Earlier investigations (Presser Citation2012; Presser, Conny, and Nazarian Citation2014) focused on validation of the approach, using sequential measurements at an infrared wavelength of 1064 nm, and comparison of results with investigations in the literature. More recently, filters obtained from a field campaign were studied, and the results were compared to a PSAP (Presser et al. Citation2017). In the current investigation, transmissivity and absorptivity measurements were carried out simultaneously at a laser wavelength of 532 nm and at room temperature. Five drop-cast, carbon-black-laden filters were prepared under ambient (laboratory) conditions. The sample carbon-black particles were well characterized by the manufacturer with absorption cross sections already reported in the literature (You et al. Citation2016). This new experimental arrangement allowed for a more compact apparatus (compared to the experimental setup of our previous investigation), avoided issues related to carrying out the measurements sequentially, and enabled a more direct comparison of particle absorption characteristics with other similar absorption techniques, which generally operate at visible wavelengths. In addition, operating at near-room temperature conditions ensured that the coated filters were not damaged (i.e., thermal ablation of the filter and particle coating) by the laser beam.
2. Experimental and operating conditions
2.1. Carbon black and filter preparation
Filter samples were prepared using Cab-O-Jet 200 (Cabot Corporation),Footnote1 a water soluble atmospheric black carbon surrogate (Bond and Bergstrom Citation2006) (referred to as ‘carbon black’) with a 21.8% mass fraction of nearly-elemental carbon in water. The particles consisted of dispersed aggregates with monomers approximately 30 nm in diameter, which upon drying combine and collapse into larger, nearly-spherical agglomerates, similar in size to those observed in the terrestrial atmosphere (You et al. Citation2016). The stock material was further diluted with 100 mL of deionized water to provide 1 mg of particles per mL water. Solutions of decreasing particle concentration were prepared by serial dilution until visually close to that of the particle-free deionized water. In total, ten samples were prepared, of which every other one (totaling five) was used for the experiments. The observed transparency of the solution for the five samples is shown in , indicating a relatively large range of particle mass loading for the experiments.
Figure 1. (a) Prepared solutions of carbon black in deionized water with varying particle concentration. The relative concentration of the container on the left (highest particle concertation) is 1 mg/mL with the concentration of each successive container to the right decreasing by one-fourth. (b) Particle-coated filters from the corresponding carbon-black solutions shown in (a).
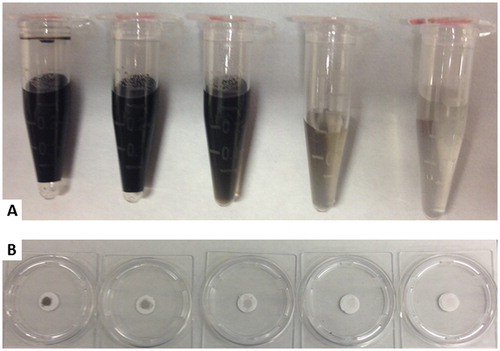
A simple drop-casting approach (in which a droplet of solution was ejected from a 50 μL syringe) was used to coat a blank pre-cut quartz-fiber filter. Each sample was protected in covered plastic Petri dishes. This approach controlled the particle loading and enabled estimation of the particle mass deposited on each filter. It was also assumed that the aggregated particle size distribution would remain unchanged while diluting the solution concentration (a reasonable assumption since the particles are miscible in water). In past investigations, particle mass loading was unknown since the filters (e.g., from field campaigns (Presser et al. Citation2017)) were obtained pre-coated. Comparing the coated filter to a similar blank filter does not provide the particle mass loading since each precut filter mass is different. Circular cuts of Pallflex quartz-tissue membrane filters (type: 2500QAT-UP, thicknessFootnote2: 0.432 mm ± 0.025 mm, diameter: 10.5 mm ± 0.1 mm) were used with the mass of each filter obtained with a 0.1 μg calibrated microbalance (Mettler Toledo model UMX5). The filters were not heat treated to evolve residual carbonaceous material prior to coating with carbon black. It is presumed that such residual material would have been detected during measurements with the blank filters (prior to being coated). However, at this resolution, the balance could only determine total deposited mass for the heaviest loading (Filter No. 1). Measurement repeatability (i.e., obtaining repeated mass readings at microgram resolution) was difficult to achieve, causing larger uncertainty in estimation of the optical properties. To withdraw one droplet of particle/water solution required a setting on the syringe of about 6 μL; thus, it was estimated that 6 μg of particles was deposited on the heaviest-coated filter after evaporation of the water from the filter material. It was assumed that the particle mass was reduced proportionally for the remaining four filters. The deposited droplets spread over a large portion of each filter surface, covering a somewhat circular area with a diameter of approximately (7.3 ± 0.5) mm, see . The solution also soaked through the filter to the back surface (there was no apparent particle loss from the filter since no residue was observed on the protective-container surface). The coated filters were dried (to remove the deionized water) under reduced pressure for three days and then reweighed with the microbalance, before being employed in the experiments. Comparing the coated and blank filters, the mass for the heaviest coated filter was estimated to be (3.0 ± 0.2) μg; half of the original expectation from the carbon black manufacturer. The discrepancies was attributed to 1) the inaccuracy of ejecting one droplet of known particle mass from the syringe (estimating the droplet size required to place a specified particle mass on the filter), 2) placing the droplet entirely on the filter, and 3) the particle mass remaining on the filter after the liquid evaporates (evaporation rates, filter surface features may affect the resulting coating).
2.2. Experimental arrangement
For brevity, only information pertinent to the experimental arrangement and the procedure used in this investigation are described below, while other generic details about the technique are provided in Presser et al. (Citation2017) and in the online supplemental information (SI). Unlike earlier investigations, transmissivity and absorptivity measurements were carried out simultaneously with the experimental arrangement presented in . To assess the optical properties of the isolated particles (i.e., particles without the presence of the filter substrate), measurements were made with both blank and particle-coated filters. Note that no assumptions are made by this approach regarding the spatial distribution of the particles throughout the filter. The arrangement consists of a laser beam aligned normal to the sample surface (exposing the entire coated portion of the filter to the beam). Filter transmissivity was obtained by measuring the laser light intensity incident on and transmitted through the filter, using a photodiode sensor, A/D converter, and desktop computer. The absorptivity was obtained using a thermocouple placed against the uncoated (back) side of the filter, flush with the surface at the center. The filter was supported with a holder that enabled replacement of the filter while preserving the position of the thermocouple. Other optics and spatial apertures were used to position the laser beam onto, and eliminate stray room light from reaching, the face of the photodiode sensor. The analysis procedure for obtaining the absorption coefficient of these measurements is described below. Note that the analysis considers the thermal conductivity of all contributing substances, including that of the surrounding medium (air).
Figure 2. Schematic of the experimental arrangement. The expanded laser beam passes through the filter sample, which increases the thermocouple temperature and the beam intensity monitored by the photodiode sensor. All the optical components are positioned on an optical rail.
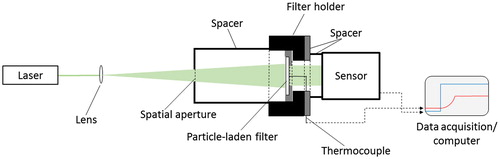
The laser source used for these experiments was a 1.5 W continuous-wave (CW) diode-pumped solid-state laser (OptoEngine LLC MGL-FN-532-1W), operating at a wavelength of 532 nm. The laser was set at an output power of ≈70 mW. This was sufficient power to monitor the filter temperature rise with the thermocouple, while not damaging the particle coating or filter material. The laser has a threaded beam cover (referred to as the ‘laser shutter’) that when screwed on manually blocks the beam output, allowing for a power output of either full scale or zero intensity. A 75 mm focal length (25.4 mm diameter) spherical planar-convex achromatic lens was used to expand the beam through a spatial aperture to cover the exposed filter surface. The aperture (an iris) with an 8 mm ± 1 mm opening, which remained unchanged for the experiments, was attached to a beam-isolation tube (inner diameter of ≈ 23 mm) to eliminate stray room light. The lens/iris distance was ≈ 250 mm, and the iris/filter distance was ≈ 70 mm, resulting in the laser beam covering the exposed filter cross-sectional area. The beam was then transmitted through the sample filter, past the thermocouple to a photodiode sensor (1 cm diameter). The filter was supported on its uncoated side with a fabricated spatial aperture (having a 6 mm ± 1 mm diameter opening). The distance between the filter and photodiode sensor was approximately ≈35 mm; the small distance ensured that the transmitted laser light was contained within the sensor area without the need for additional focusing optics. All optical components were mounted on a common optical rail, providing linear alignment and translation. The filter temperature was monitored with a K-type unsheathed thermocouple, having a wire diameter of (0.457 ± 0.025) mm (bead diameter of approximately 1.016 mm) and response time of about 0.7 s to reach 63.2% of the instantaneous temperature change. Data acquisition consisted of a LabView program operating on a desktop computer, recording the power-meter and thermocouple output voltage signals during each run. Data were stored in the buffer at 100 samples/s with every set of 25 readings downloaded and saved to a file, as well as the average of the set.
2.3. Particle size distribution
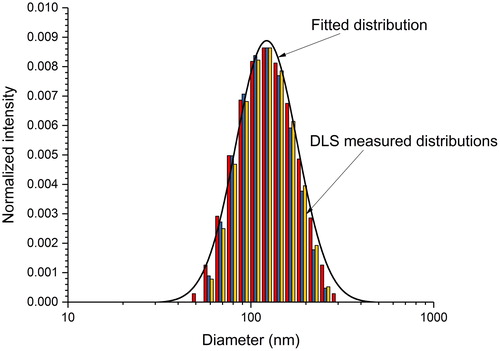
To estimate the particle size distribution in solution, a Malvern ZetaSizer Nano-ZS dynamic light scattering (DLS) instrument was used to measure the hydrodynamic diameter and zeta potential of the carbon-black particles in water. The instrument uses a cumulant-method fit to the raw correlation function data to provide a mean diameter and size distribution width (Malvern Instruments Citation2014). Measurements of a 100 μL sample (measurement detection angle of 173°, wavelength of 633 nm, 30 s equilibration time) were repeated three times (each run for 10 s). The three distributions are presented in . The mean diameter for the three measurements was (112.8 ± 1.0) nm, and the polydispersity index (i.e., the ratio squared of the arithmetic standard deviation to the mean diameter, representing the distribution width) was (0.102 ± 0.012); extremely broad distributions have values greater than 0.7. The instrument assumes that the particles are spherical. The magnitude of the zeta potential was sufficiently large (mean value of ≈ −50 mV) to indicate that the particles resist aggregation and remain in suspension.
Figure 3. Three overlapping size distributions (tricolored bar graph) for the carbon black/deionized water suspension with the heaviest particle loading (Filter No. 1), as measured using dynamic light scattering. The fitting parameters for each calculated log-normal probability distribution are: Dg = (141.7, 133.2, and 135.3) nm and σg = (0.3869, 0.3520, and 0.3514), respectively. The solid curve is the distribution for Dg = 141.7 nm and σg = 0.3869.
2.4. Transmissivity measurements
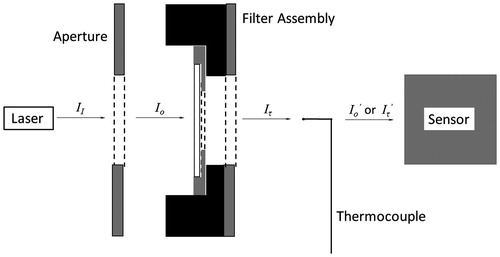
The transmissivity (τ) through each individual filter (for both the blank and coated filters) was determined by measuring the laser light intensity incident on (Io) and transmitted through (Iτ) each filter, and then taking the ratio (τ = Iτ/Io). Measurements were carried out to obtain the laser output intensity, as well as the transmitted intensity through the various spatial optics with/without the filter sample (and with/without the thermocouple) to obtain the effect of the thermocouple on transmission of the light to the detector. Various terms are defined for the light intensity at different locations throughout the apparatus, as indicated in , with Io′ defined for the situation without the filter (i.e., Iτ = Io), and Iτ′ with the filter. It can be shown that the percent reduction in laser intensity at the detector due to the presence of the thermocouple is (Io − Io′)/Io′. Therefore, the laser intensity reaching the detector, while accounting for the presence of the filter and thermocouple is:
(1)
(1)
where the first term on the right-hand side of EquationEquation (1)
(1)
(1) accounts for the transmission through the filter and the second term is that past the thermocouple. It can be shown after rearrangement of the terms that the transmissivity across the filter is τ ≡ Iτ/Io = Iτ′/Io′. Thus, the transmissivity can be determined directly from the power meter readings for the incident and transmitted intensities, if there are no changes to the arrangement. The particle transmissivity is given by Equation (S10) in the SI.
Figure 4. Schematic defining the laser light intensities for the different components of the optical arrangement. Note that II > Io > Iτ > Io′ > Iτ′ with the filter in place. The term Io′ is defined for the situation without the filter (i.e., Iτ = Io), and Iτ′ is defined when using the filter. Note that the components are separated to indicate clearly the light intensities (see for the appropriate experimental arrangement).
2.5. Absorptivity measurements
The absorptivity is determined using a model based on the conservation of thermal energy for the particle-laden filters, as outlined in Presser (Citation2012), Presser, Conny, and Nazarian (Citation2014), and Presser et al. (Citation2017) and in the SI. Essentially, when the laser aperture is opened, the filter temperature rises, due to light absorption by the filter (and particles, if present), which is detected by the thermocouple stationed on the uncoated side of the filter. The temperature will rise to near steady state at which point the laser aperture is closed and the filter temperature relaxes back to the reference ambient temperature (see ). This heating process of the sample temperature rising to steady state and then decaying back to the ambient temperature with time is recorded for further analysis. One can then solve for the absorptivity, β(T,λ), by evaluating the point at which the perturbed steady-state temperature and decay curve overlap, namely, allowing one to set Equation (S3) equal to Equation (S4) (see SI) such that:
(2)
(2)
where λ is the laser wavelength, m is the sample total mass (filter and particles, if present), T is the sample temperature (as measured by the thermocouple), t is time, cp(T) is the sample specific heat capacity at the sample temperature (estimated from the literature for the weighted sum of graphitic carbon and quartz (Haynes Citation2015–2016)), and A is the laser beam geometric cross-sectional area projected onto the filter (i.e., the laser beam power at the filter surface, as measured by the power meter, and given by P = Io A). The subscript Reg3 refers to the temperature decay, i.e., Region 3 in . To determine the temperature-time derivative, dT/dt, we assume an exponentially decaying expression of the form (Presser, Conny, and Nazarian Citation2014):
(3)
(3)
where the derivative is given by:
(4)
(4)
Figure 5. (a) Schematic of the heating protocol; Regimes: (1) initial heating from the ambient laboratory temperature to (2) the prescribed steady-state temperature, and (3) temperature decay back to the ambient temperature. (b) Measured heating curve with regression fit (solid curve) for the heaviest coated filter.
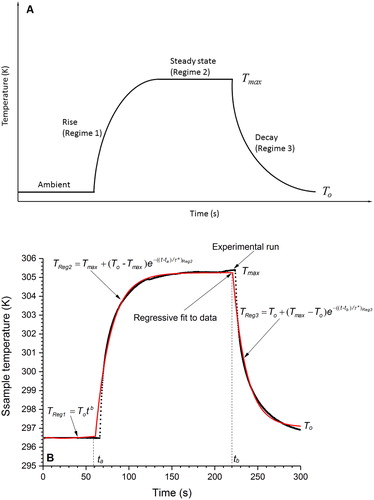
The variables To and Tmax are the initial (ambient) and perturbed steady-state temperatures, respectively. The variable τ* is the temperature-dependent relaxation time (representative of the curvature of the exponentially decaying function). A regression fit to the recorded temperature-versus-time data in (see Presser Citation2012) is performed for each heating regime, which enables determination of τ*, dT/dt, To, and Tmax. One can then evaluate EquationEquation (2)(2)
(2) for the blank and coated filters. The absorptivity of the particles (i.e., without the filter) is then obtained from the difference in absorptivity between the particle-laden and blank filters (using Equation (S9) in the SI).
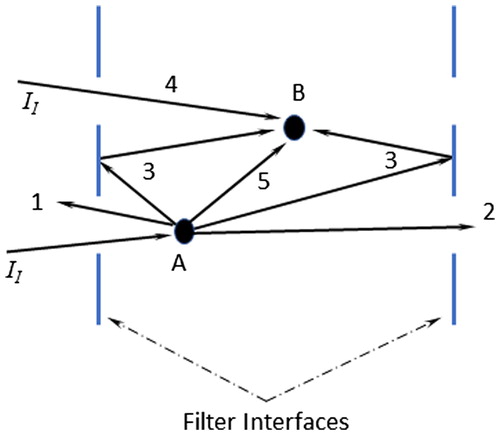
The analysis considers internal multiple scattering effects on absorption within the filter through the extinction coefficient in Equation (S6) (Bohren and Huffman Citation1983), which is more explicitly written in Equation (S11) for the particle-laden filter. The schematic provided in illustrates some of the different pathways considered in the derivation of Equation (S11) for scattering from and absorption by particles/fibers within the filter volume. As indicated in the SI, writing the fundamental equations for the isolated particles, blank filter, and coated filters, one can derive with algebra Equation (S11), which includes absorption and scattering within the filter though αi and σi (i.e., εi = αi + σi), respectively. The term εp accounts for extinction due to the particles, εs accounts for extinction due to the filter fibers, and ε′ps accounts for extinction due to the particles/fiber interactions (enhancement due to multiple scattering and other effects internal to the filter).
Figure 6. Schematic illustrating multiple scattering within the filter material. 1 – is an unobstructed reflected pathway that is included in the reflectivity (ρ) term along with all surface reflections. 2 – is an unobstructed transmitted pathway that is included in the transmissivity (τ) term. 3 – represents internally reflected energy off the inner interfaces, which are represented by calculated higher-order terms, but are generally small relative to the first order term (Equation (S6)). 4 – represents direct incident light (II) absorbed by a particle (p)/fiber (s), which is either absorbed or scattered, and its effect is included in the terms αi and σi, respectively, where i = ps, p, s. 5 – represents energy scattered from particles/fibers (a) that interact with other particles/fibers (b) and is included in the terms αi and σi.
2.6. Measurement protocol and uncertainties
The measurement protocol consisted simply of opening the laser shutter, recording the incident laser intensity and filter temperature with the data acquisition system, and then closing the shutter. Measurements were first completed without a filter to obtain the incident light intensity. The sample filter was then mounted in the holder (accessed by moving the iris and tubular spacer on the optical rail). The laser shutter was then reopened, and the transmitted laser intensity and temperature rise were recorded simultaneously until the temperature reached near steady state. The laser shutter was then closed to complete the measurement, which allowed the temperature to decay back to the ambient temperature. The laser power was preset to limit the perturbed temperature rise to a few degrees Kelvin above the ambient temperature for the particle-coated filters, thus maintaining the integrity of the coating and filter material.
Initially, measurements were completed with precut blank filters. These blank filters were then coated with the particles and the measurements repeated with the coated filters. It was assumed that drop casting (with known volume of particle suspension at know concentration) would provide a better estimate of the particle loading, since particle mass would not be an unknown variable (as was the situation with pre-coated, field-campaign filters). However, since the total deposited mass of the particles was on the order of micrograms, measurements to confirm the mass were difficult to achieve with the available precision microbalance. Although internally calibrated, estimation of the particle mass per droplet ejection from the syringe was limited because of possible droplet and particle-mass-per-droplet variability, and uncertainty in setting precisely the position of the syringe arm. (To avoid these limitations, one perhaps could use larger filters and syringe capacities to eject more liquid and coat the filter without spillage over the edge, and thus increase the particle mass to enable a more precise microbalance measurement.)
The transmission/absorption measurements were duplicated (without removal of the sample) for the blank and coated filters separately, as well as for the incident intensity (i.e., without the presence of the filters). Across the two replicated runs, the temperature measurement repeatability (for a 95% confidence level) was better than 0.3 K, and for the power meter reading better than 3 × 10⁻⁵ mW. The input parameters for evaluating EquationEquation (2)(2)
(2) , with their estimated expanded uncertainties, are provided in . The expanded uncertainties for temperature (from the thermocouple) and power (from the power meter) were estimated from the repeated readings and are provided in the same table.
Table 1. Transmission/absorption results for Filter No. 1 (heaviest coating): (A) input parameters, (B) optical properties and intra-filter relationship criteria, and (C) inter-filter relationship criteria. Measured values for the input parameters are the average of two repeated measurements. Laser wavelength was 532 nm.
3. Results and discussion
3.1. Laser intensity effects
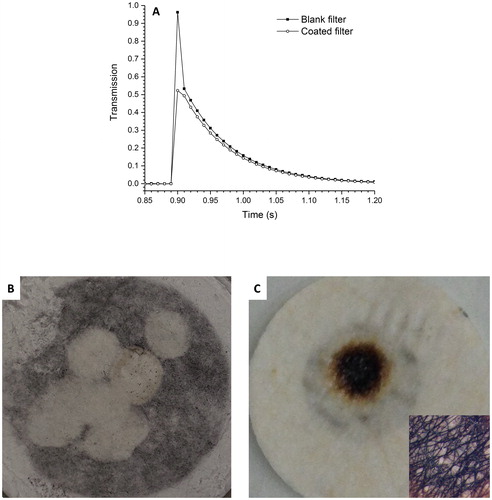
There are a variety of possible experimental configurations that can be used to carry out the measurement. The advantage of using a pulsed laser is that one can analyze an individual pulse for the absorption coefficient, without heating the sample to steady state (as with a CW laser). Being a much more rapid measurement, the pulsed-laser approach potentially could provide temporal information as a filter is being coated with particles. However, it was observed that if the laser fluence was too high (so that the detected thermocouple reading reached tens-of-degrees higher than the ambient temperature), the collected particles were ablated off the filter surface (leaving the filter surface blank and devoid of particles). For example, a pulsed Nd:YAG laser (pulse power of 0.36 J, pulse width of (3–5) ns, operating at a wavelength of 532 nm) was used in a single (on-demand) and continuous-pulsing mode (10 Hz). The thermocouple detected the temperature rise and the power meter detected the transmitted laser intensity through the filter (as pulsed signals). The decaying portion of the pulsed signal for the blank and coated filters (see ), indicated less transmission (smaller signal) for the coated filter, as expected. This portion of the signal was used to determine the particle transmissivity (as described in Section 2.4). However, the pulse peak resulted in ablation of the coating (e.g., Baffou et al. Citation2013; Cavicchi et al. Citation2013), as shown in with a test filter. Thus, it was not feasible to operate the laser in a continuous-pulsing mode to increase the mean temperature. Using neutral density filters reduced the peak intensity level; however, this reduced the temperature rise, making it difficult to estimate the absorptivity. It was also observed that the quartz fibers on the back (uncoated) side of the filter (see and insert) were blackened (with a brown rim) where the heated thermocouple bead was in contact with the filter surface, which would be expected to alter the measured absorption. It was surmised that the thermocouple instantaneous temperature peaked at several tens of degrees during the laser pulse instead of remaining within a few degrees Kelvin of the ambient temperature. (The same effect was also observed with a CW argon-ion laser, operating with all lines at a power of 300 mW, where the temperature reached above 345 K.) Assuming the quartz fibers, with its much higher melting point, are unaffected at these temperatures, the source of the charred or discolored fibers remain unknown (perhaps due to an oxidative reaction at the elevated temperature of some organic component of the filter fiber composite).
Figure 7. (a) Nondimensional power output with respect to the acquired data point (time) using a pulsed Nd:YAG laser. The data acquisition sampling rate was 100 samples/s and the laser pulse duration was (3–5) ns. (b) Ablated coated surface of a test filter by the laser, and (c) burnt uncoated (back) surface of a test filter by the heated thermocouple (insert – blackened fibrous region; magnification 10×).
Another point to consider is that the use of a multiline output laser could potentially provide spectral information. However, the output intensity of each line needs to be sufficient to ensure reasonable signal to noise, while not affecting the particle coating and/or filter surfaces. Second, a mathematical or experimental procedure (to separate the laser lines spatially or temporally) needs to be formulated to determine the contribution of each wavelength to absorption and transmission. This may be pursued in a future investigation.
Ultimately, a CW diode-pumped solid-state laser was used, which operated at a wavelength of 532 nm. The maximum increase in temperature for the incident beam (without any filter) was 11 K to 12 K above the ambient air temperature. The change in temperature with the blank filter reached a maximum of about 1 K above the ambient, while the coated filter temperature rose about 9 K for the heaviest-coated filter and about 1.5 K for the lightest-coated filter. The maximum temperature achieved for the coated filters decreased as the filter loading decreased, approaching that of the blank filter measurements. As expected, absorption of the laser energy by the carbon black resulted in higher detected temperatures. Also observed was that the transmission always increased as the particle loading on the filter decreased, approaching that of the blank filter (which remained essentially unchanged).
3.2. Observed particle morphology
To capture possible effects of particle morphology on the transmission/absorption measurements (expecting that carbon black particle would be present on the filters), particle physical features were captured using an optical-digital microscope at several magnifications (before the coated filters were used for the experiments). It was observed that, in general, there was a variety of contaminant particles on the filters in addition to the carbon-black particles.
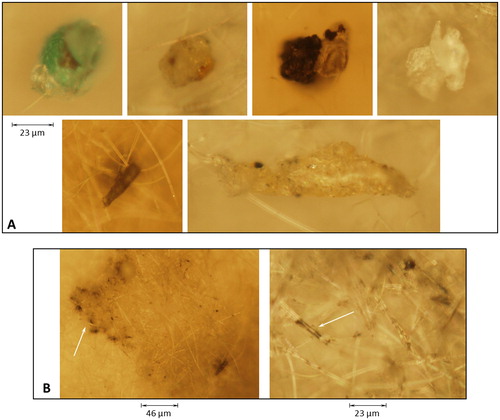
shows images (magnification: 20×) from the heaviest coated filter (Filter No. 1) of the different foreign particles (varying in color, shape, and size), which were found by arbitrarily scanning over the filter surface. Except for the carbon black, their origin was unknown and not observed on the blank filters. It was assumed that the relatively low number of observed contaminant particles was insufficient to influence the optical measurements and determination of the carbon-black absorption coefficient. The technique is sensitive to the particle loading on the filter, as described by the Beer–Lambert transmission law, thus a few extraneous particles on the filter will generally make little difference in the transmission. Also, since the technique subtracts out the effect of the filter, pretreatment of the filter to remove the small number of possible contaminants will again make little difference. Several larger particles were found to be pendent on the filter fibers (e.g., , bottom row). Smaller aggregated carbon-black particles appeared as a blotched (darkened) area (e.g., see arrow in left image of , magnification: 10×), while fiber surfaces were coated with a film of carbon-black particles (e.g., see arrow in , right image, magnification of 20×).
Figure 8. Microscopic images of the particles observed on the filters (magnification: 20×). (a) arbitrarily observed individual contaminant particles found on the filter in addition to the carbon black (bottom row shows pendent particles on fibers), and (b) aggregated areas of carbon-black particles (see arrow in left image, magnification: 10×) and filter fibers coated with carbon-black (see arrow in right image).
3.3. Particle optical characteristics
Once values for the transmissivity and absorptivity are obtained from measurements of both the blank and coated filters at a wavelength of 532 nm (using the outlined analysis in the SI), one can solve for the reflectivity, (i.e., with the radiation balance equation, see Equation (S1) of the SI). presents the evaluated optical properties for the heaviest coated filter (Filter No. 1). Associated with each coated filter is a blank filter, which enables one to derive the characteristics for the ‘isolated’ particles (i.e., the particles without the presence of the filter). presents the optical properties derived for the blank filter, coated filter, and isolated particles, including the extinction coefficient, εp, of the isolated particles (see Equations (S8)–(S10) in the SI). Also provided in are intra-filter relationship criteria, and in are inter-filter criteria, which must be satisfied to ensure that the results are physically reasonable (as summarized in Presser, Conny, and Nazarian [Citation2014] and Presser et al. [Citation2017]). The values presented in represent the difference between the two corresponding variables, which must be greater than zero. For example, transmission through the blank filter must be greater than through the coated filter, (τs > τps), therefore τs − τps > 0. The results for each filter are listed in in order of decreasing filter loading. For Filter No. 1 (using the input from ), the estimated value for εp was 1 565 m−1. This value can vary over a wide range (see Presser, Conny, and Nazarian Citation2014), depending on the measured transmissivity, which in turn depends on the sample material, mass loading, and filter type. For a quartz filter substrate, the value given above is relatively high, which is explained by the small value for the measured transmissivity of the particles (τp = 0.508) listed in , indicating a relatively high mass loading (see ). The effect of the filter on the particle extinction (absorption enhancement, shadowing, scattering, etc.) is represented by the term ε′ps, in , and is discussed in the SI section and Section 2.2.3 of Presser et al. (Citation2017). This effect contributes approximately 88% to the extinction coefficient for this particle-laden filter (with ≈ 12% attributed to both the absorption and scattering coefficients). The effect of the filter on absorption is also emphasized by the enhancement factor (see Presser, Conny, and Nazarian Citation2014), εps/αp, which is 11.2 for Filter No. 1 in . Using the measured total particle mass for Filter No. 1 (mp = 2.9 ± 1.0 μg) and filter volume containing particles (Vcoat = 18.08 ± 0.06 mm3) given in , along with the measured absorption coefficient of the particles (αp = 1 238 ± 73 m−1), the particle mass absorption coefficient (as defined by Zangmeister et al. Citation2018) was determined to be (αp Vcoat/mp = 7.7 ± 1.4) m2 g−1. The relatively large uncertainty was attributed to the uncertainty in measuring the microgram particle mass. The absorption/scattering coefficients and mass absorption coefficient were derived knowing the single-scattering albedo (SSA) and number concentration, respectively, as discussed next.
Table 2. Estimation of the particle number concentration, measured extinction and absorption coefficients for the particles, particle mass absorption coefficient, and enhancement factor for each filter.
Knowing the extinction coefficient of the isolated particles (εp), the absorption and scattering coefficients of the isolated particles, αp and σp, respectively, can be computed using Lorenz–Mie light-scattering theory (Wiscombe Citation1979). An idealized polydispersion of non-aggregated, homogeneous spherical particles is assumed, which are arbitrarily dispersed throughout a volume equivalent to the measured portion of the filter volume containing particles. The assumption of sphericity for Cab-O-Jet 200 particles is reasonable since the mass-mobility scaling exponent is near 3 (You et al. Citation2016). However, the assumption of particle homogeneity is suspect since the particles are aggregates with interstitial voids; hence the particle effective density is less than the bulk density of carbon. A similar approach was used in an earlier study (Presser Citation2012) with highly absorbing aerosol, for which the computed absorption coefficients of the particles agreed well with the measured values. Calculations were carried out using an assumed wavelength-independent refractive index of mr = 1.32 + i0.31 (see SI in You et al. Citation2016) and wavelength λ = 532 nm. This value of refractive index was chosen since it accounts for the aggregated nature of the particles, namely, it considers the weighted sum due to both the carbon-black monomers and air that fill the overall particle volume. The χ2 (figure-of-merit) minimization technique used by You et al. (Citation2016) scanned a range of real and imaginary components of the refractive index, using Δnr and Δk = 0.01, with the reported value being that which minimized the errors in both the extinction and absorption cross sections; see Radney and Zangmeister (Citation2018) and references therein. This refractive index was used with our Lorenz–Mie light scattering algorithm, after reproducing results provided in You et al. (Citation2016) for monodisperse particles. The polydispersion of particles (for this investigation, see Equation (S2) in the SI) uses an assumed log-normal probability distribution function (Avedisian, Presser, and Gupta Citation2002; Friedlander Citation2000). The fitting parameters were obtained from regression analysis of the measured particle size distributions (i.e., as obtained with the above-mentioned DLS apparatus, see ) for the heaviest coated carbon-black filter (Filter No. 1). It was assumed that the particle size distribution remained unchanged for all liquid solutions used to coat the filters (because of the particle solubility in water; just the particle loading changed for each filter). The probability-function fitting parameters for three repeated DLS measurements were: geometric mean diameter, Dg = (141.7, 133.2, and 135.3) nm, and geometric mean standard deviation, σg = (0.3869, 0.3520, and 0.3514), respectively. The average values are Dg = 136.7 nm and σg = 0.363. The transmissivity for a polydispersion of aerosolized spherical particles (as opposed to the transmission from particles of a known uniform size) is given by (Dobbins and Jizmagian Citation1966; Dobbins, Santoro, and Semerjian Citation1984):
(5)
(5)
where N is the number concentration,
is the mean extinction cross section,
is the mean extinction efficiency,
is the volume fraction, and D32 is the volume-to-surface area mean diameter. Pertinent details for evaluating the terms in EquationEquation (5)
(5)
(5) are given in Equation (S2) of the SI. The computational results are presented in , using the above-mentioned average value of the particle distribution fitting parameters. The computed particle coefficients were εp = 1568 m−1, σp = 327 m−1, and αp = 1241 m−1, considering that SSA = (
/
) = σp/εp = 0.209 and αp = N
. Note that the computed particle extinction coefficient of (1565 ± 92) m−1 agrees with the experimental value to within measurement uncertainty (). Also, the results consider the carbon-black particle scattering coefficient as being significant (i.e., nonnegligible).
Table 3. Results of Lorenz–Mie calculations for a polydispersion of non-aggregated, carbon-black spherical particles dispersed within the volume of the filter coated portion (Vcoat = 1.81 × 10⁻⁸ m3). Inputs: mr = 1.32 + i0.31, λ = 532 nm, τp = 0.508, d = 4.32 × 10⁻⁴ m, Dg = 1.367 × 10⁻⁷ m, σg = 0.363. The subscript j = ext, sca, abs, respectively.
On a mass-specific basis, the absorbance (i.e., exponents in EquationEquation (5)(5)
(5) ) can be written as cext M, or (cabs + csca) M, where cext, cabs, and csca are, respectively, the particle mass extinction, absorption, and scattering coefficients (m2 g−1), and M is the particle mass loading (g m−2). lists the extinction coefficient, absorption coefficient, and mass absorption coefficient of the five samples, as determined from the measurements. Note that the measured particle mass absorption coefficient increases as the filter particle loading decreases. This may be an artifact of the larger uncertainty associated with estimating the particle mass on the lighter coated filters. However, this observed change in cabs with mass loading may be evidence that the underlying particle size distribution is also a function of loading (assumed to be untrue) since at λ = 532 nm, cabs for the carbon-black particles measured presently is size dependent (Zangmeister and Radney Citation2018). The table also provides an estimate of the corresponding decrease in particle number concentration (as determined from the above-mentioned definition for αp) for each filter.
The computed mass absorption coefficient for the particle polydispersion was compared with the measurements for the heaviest loaded filter. The mean single-particle mass, is defined by = πρeffD30/6, where ρeff is the effective particle density (0.78 × 10⁶ g m−3 over the particle diameter range of Dm = 100 nm to 300 nm (You et al. Citation2016)), and D30 is the volume mean diameter (see the different calculated moment diameters, Equation (S16) of the SI for the notation definitions). Being proportional to
, D30 was found to provide a particle mass absorption coefficient (for D30 = 166.6 nm,
= 1.89 fg) of
= 7.9 m2 g−1 (), which compares well with the measured mass absorption coefficient (= αp Vcoat/mp, see ) of 7.7 m2 g−1 (see ). When based on the Sauter mean diameter, D32 (i.e., representing a particle size that has an equivalent volume-to-surface area as that of the entire distribution of particles), the mean single-particle mass is
= πρeff D32/6 = 2.8 fg and,
= 5.3 m2 g−1 (significantly smaller than the measured value because this mean diameter is weighted to a larger particle size).
Lorenz–Mie computations were also carried out for monodispersed particles of size equal to the DLS measured geometric mean diameter of Dg = 136.7 nm (simulated by setting the geometric mean standard deviation of the distribution function to zero). The result for the SSA was 0.105 (≈50% percent smaller than reported for the polydispersion case), and the mass absorption coefficient was about 8.6 m2 g−1 (≈10% larger than that for D30). A better match to the polydispersion results was achieved when the monodispersion computations were carried out for a particle size equivalent to the polydispersion Sauter mean diameter (D32) of 190.2 nm; the particle mass absorption coefficient was 8.2 m2 g−1 (≈5% larger) and the SSA was 0.192 (≈8% smaller), see . These results indicate that the mass absorption coefficient increases as the mean size or the distribution width decreases, corresponding to less particle mass, as noted earlier.
Table 4. Results of Lorenz–Mie calculations for a monodispersion of non-aggregated, carbon-black spherical particles dispersed within the volume of the filter coated portion (Vcoat = 1.81 × 10⁻⁸ m3). Inputs: mr = 1.32 + i0.31, λ = 532 nm, τp = 0.276, d = 4.32 × 10⁻⁴ m, D = 1.902 × 10⁻⁷ m. The subscript j = ext, sca, abs, respectively.
The particle mass absorption coefficient was recently reported (Zangmeister and Radney Citation2018) for the same water-soluble carbon black, but as measured by photoacoustic spectroscopy from 11 different laboratories that participated in an interlaboratory round-robin. The resulting correlations at λ = 532 nm were Cabs = (5.28 ± 0.41) × 10−14 m2 · (Dm/250 nm)2.51 ± 0.14 = (1.14 ± 0.13) × 10−14 · (mm (fg)) 0.816 ± 0.034 for (150 ≤ Dm ≤ 500) nm, where Dm is the particle mobility diameter (i.e., particle diameter from a differential mobility analyzer with a bipolar charger, which size-selects aerosol of known electrical mobility) and mm is the corresponding particle mass (based on Dm). Using these correlations and the calculated value for of 1.485 × 10⁻¹⁴ m2 (as based on the measured particle size distribution for this study and given refractive index, see ), Dm = 150.8 nm (within the range of the aerosol geometric mean mobility diameter reported in Zangmeister and Radney (Citation2018) and similar to the surface-area mean diameter, D20 = 156.0 nm) and mm = 1.38 fg. Note that the average geometric mean mobility diameter among the 11 reported values was 134.0 nm, compared to 136.7 nm for this investigation. The resulting particle mass absorption coefficient is
= 10.7 m2 g−1, which is somewhat larger than the measured value of 7.7 m2 g−1 for this investigation. The discrepancy was attributed to the mobility diameter being below 150 nm (i.e., outside the size range for the above-mentioned correlations). If the corresponding absorption cross section is 2.317 × 10⁻¹⁴ m2 (calculation for monodispersed particles based in D32), the correlations result in a mobility diameter of 180 nm, mass of 2.39 fg, and particle mass absorption coefficient of 9.7 m2 g−1; somewhat closer to the measured values.
4. Conclusions
Simultaneous transmissivity and absorptivity measurements were carried out at a laser wavelength of 532 nm on drop-cast, carbon-black-laden filters under ambient (laboratory) conditions. The focus of this investigation was to establish the feasibility of this approach to estimate the absorption coefficient of the particles and particle mass absorption coefficient, while comparing results to earlier investigations by You et al. (Citation2016) and Zangmeister and Radney (Citation2018) that used the same carbon source. Transmissivity measurements were carried out with a laser probe beam positioned normal to the particle-laden filter surface. Absorptivity measurements were carried out using a laser-heating approach to record the sample temperature rise and decay with time from the ambient temperature. The results were consistent with those of the earlier investigations and with Lorenz–Mie calculations, which were carried out for a log-normal distribution of spherical particles dispersed throughout a volume similar to that of the filter. The measured particle mass absorption coefficient was (7.7 ± 1.4) m2 g−1 for the heaviest filter loading, being consistent with the Lorenz–Mie calculations for polydispersed particles. The relatively large uncertainty was attributed to the difficulties associated with measuring the microgram particle mass on the filter. This value increased (instead of remaining unchanged) as the filter loading decreased, again attributed to the uncertainty associated with estimating aerosol mass (or perhaps due to a change in particle mean size and/or distribution width). Also, results for the particle mass absorption coefficient from a recent round-robin study, using photoacoustic spectroscopy to measure the same carbon black material, indicated a larger value of 10.7 m2 g−1; the discrepancy attributed to the reported mobility diameters being smaller than the minimum correlated size for this instrument. In summary, the simple approach of simultaneously measuring the transmissivity and absorptivity of particle-laden filters has provided results consistent with those expected for these carbon black particles. This approach may be applied, with simple modification (i.e., the addition of a thermocouple), to other filter-based commercial instruments, providing more particle-and filter-related information than is currently available.
| Nomenclature | ||
| A | = | sample geometric cross-sectional area (m2) |
| c | = | mass absorption coefficient (m2 g−1) |
| C | = | cross section (m2) |
| Cv | = | volume fraction |
| cp(T) | = | specific heat capacity (J g−1 K−1) |
| d | = | characteristic path length through the sample, filter thickness (m) |
| D | = | diameter (m) |
| Dg | = | geometric mean diameter (m) |
| D30 | = | volume mean diameter (m) |
| D32 | = | volume-to-surface area mean diameter (Sauter mean diameter) (m) |
| Dm | = | mobility diameter (m) |
| dT/dt | = | sample temperature derivative (K s−1) |
| II | = | light intensity of the laser output (W m−2) |
| Io | = | light intensity incident on the filter front side; i.e., measured with aperture, without thermocouple and filter (W m−2) |
| Iτ | = | light intensity transmitted through the filter; i.e., measured with aperture and filter, without thermocouple (W m−2) |
| Io′ | = | light intensity reaching the detector (with aperture and thermocouple, without filter) (W m−2) |
| Iτ′ | = | light intensity reaching the detector (with aperture, thermocouple, and filter) (W m−2) |
| k | = | imaginary part of the complex refractive index |
| kc | = | coverage factor |
| m | = | sample total mass (filter and particles, if present) (g) |
| mp | = | measured total particle mass (without filter) (g) |
| mm | = | single-particle mass based on the mobility diameter (g) |
| mr | = | refractive index (=nr + ik) |
| M | = | particle mass loading (g m−2) |
| n | = | number of sample points |
| nr | = | real part of the complex refractive index |
| N | = | number concentration (particles m−3) |
| Pinc | = | incident radiative power (≡ II A) (W) |
| P(D) | = | probability distribution function (m) |
| Ptra | = | transmitted radiative power (≡ Iτ A) (W) |
| s | = | standard deviation of the mean |
| t | = | time (s) |
| ta, tb | = | time initiating Regimes 2 and 3, respectively (see ) (s) |
| T | = | sample temperature (K) |
| To | = | initial (laboratory) sample temperature (see ) (K) |
| Tmax | = | perturbation steady-state sample temperature (see ) (K) |
| Q | = | efficiency |
| uc | = | combined standard uncertainty |
| Vf | = | filter volume (m3) |
| Vcoat | = | volume of filter containing particles (m3) |
| Greek symbols | ||
| α | = | absorption coefficient (m−1) |
| αR | = | absorption enhancement factor |
| β(T, λ) | = | spectral hemispherical absorptivity (absorbed fraction of the incident radiation intensity) |
| Δ | = | incremental change |
| ε | = | extinction coefficient (m−1) |
| ε′ | = | portion of the sample extinction coefficient attributed to filter effects (m−1) |
| λ | = | wavelength (m) |
| ρ | = | spectral hemispherical reflectivity (reflected fraction of the incident radiation intensity) |
| ρeff | = | effective particle density (g m−3) |
| σ | = | scattering coefficient (m−1) |
| σg | = | geometric mean standard deviation |
| τ | = | spectral hemispherical transmissivity (transmitted fraction of the incident radiation intensity) |
| τ* | = | temperature-dependent relaxation time (s) |
| χ | = | figure-of-merit function |
| Subscripts | ||
| abs | = | absorption |
| c | = | clean (without particle coating) |
| coat | = | coating |
| ext | = | extinction |
| f | = | filter |
| I | = | incident |
| j | = | index representing ext, sca, and abs |
| p | = | particle |
| ps | = | particle and substrate |
| Reg_ | = | regime |
| s | = | substrate |
| sca | = | scattering |
| Superscripts | ||
| b | = | fitting parameter for exponential decaying function (see ) |
| — | = | mean value |
Supplemental Material
Download Zip (64.3 KB)Acknowledgments
Much appreciation to Dr. C.D. Zangmeister for providing the Cab-O-Jet 200 sample, Dr. K.D. Benkstein for carrying out the dynamic light scattering measurements, Dr. J.M. Conny for providing the microscope image (insert) in , and Ms. C. Grimes for information on the drop-cast procedures and preparation of the particle-coated filters.
Disclosure statement
No potential conflict of interest was reported by the authors.
Notes
1 Certain commercial equipment or materials are identified in this publication to specify adequately the experimental procedure. Such identification does not imply recommendation or endorsement by the National Institute of Standards and Technology, nor does it imply that the materials or equipment are necessarily the best available for this purpose.
2 Estimation of the measurement uncertainty for this study is determined from statistical analysis of a series of replicated measurements (referred to as Type A evaluation of uncertainty), and from means other than statistical analysis (referred to as Type B evaluation of uncertainty) (Taylor and Kuyatt Citation1994). The Type A uncertainty is calculated as kcuc, where kc is the coverage factor and uc is the combined standard uncertainty. The value for uc is estimated statistically by sn-1/2, where s is the sample standard deviation and n is the number of samples. For n = 2, 3, and 50, k = 4.30, 3.18, and 2.01, respectively, representing a level of confidence of 95%.
Related Research Data
References
- Arnott, W. P., H. Moosmüller, P. J. Sheridan, J. A. Ogren, R. Raspet, W. V. Slaton, J. L. Hand, S. M. Kreidenweis, and J. L. Collett. Jr. 2003. Photoacoustic and filter-based ambient aerosol light absorption measurements: Instrument comparisons and the role of relative humidity. J. Geophys. Res. 108 (D1):4034. doi:10.1029/2002JD002165.
- Avedisian, C. T., C. Presser, and A. K. Gupta. 2002. Observations of soot in the combustion of methanol/toluene spray flames. J. Propuls. Power 18 (4):781–787. doi:10.2514/2.6000.
- Baumgardner, D., O. Popovicheva, J. Allan, V. Bernardoni, J. Cao, F. Cavalli, J. Cozic, E. Diapouli, K. Eleftheriadis, P. J. Genberg, et al. 2012. Soot reference materials for instrument calibration and intercomparisons: A workshop summary with recommendations. Atmos. Meas. Tech. 5 (8):1869–1887. doi:10.5194/amt-5-1869-2012.
- Backman, J., L. Schmeisser, A. Virkkula, J. A. Ogren, E. Asmi, S. Starkweather, S. Sharma, K. Eleftheriadis, T. Uttal, A. Jefferson, et al. 2017. On Aethalometer measurement uncertainties and an instrument correction factor for the Arctic. Atmos. Meas. Tech. 10:5039–5062. doi:10.5194/amt-10-5039-2017.
- Baffou, G., P. Berto, E. Bermúdez Ureña, R. Quidant, S. Monneret, J. Polleux, and H. Rigneault. 2013. Photoinduced heating of nanoparticle arrays. ACS Nano 7 (8):6478–6488.
- Bohren, C. F., and D. R. Huffman. 1983. Absorption and scattering of light by small particles. New York, NY: Wiley, Chapters 2, 3, 11, and 14.
- Bond, T. C., T. L. Anderson, and D. Campbell. 1999. Calibration and intercomparison of filter-based measurements of visible light absorption by aerosols. Aerosol Sci. Technol. 30(6):582–600. doi:10.1080/027868299304435.
- Bond, T. C., and R. W. Bergstrom. 2006. Light absorption by carbonaceous particles: An investigative review. Aerosol Sci. Technol. 40(1):27–67. doi:10.1080/02786820500421521.
- Bond, T. C., S. J. Doherty, D. W. Fahey, P. M. Forster, T. Berntsen, B. J. DeAngelo, M. G. Flanner, S. Ghan, B. Kärcher, D. Koch, et al. 2013. Bounding the role of black carbon in the climate system: A scientific assessment. J. Geophys. Res. Atmos. 118(11):5380–5552. doi:10.1002/jgrd.50171.
- Brem, B. T., F. C. Mena Gonzalez, S. R. Meyers, T. C. Bond, and M. J. Rood. 2012. Laboratory-measured optical properties of inorganic and organic aerosols at relative humidities up to 95%. Aerosol Sci. Technol. 46(2):178–190. doi:10.1080/02786826.2011.617794.
- Cappa, C. D., D. A. Lack, J. B. Burkholder, and A. R. Ravishankara. 2008. Bias in filter-based aerosol light absorption measurements due to organic aerosol loading: Evidence from laboratory measurements. Aerosol Sci. Technol. 42(12):1022–1032. doi:10.1080/02786820802389285.
- Cavicchi, R. E., D. C. Meier, C. Presser, V. M. Prabhu, and S. Guha. 2013. Single laser pulse effects on suspended-Au-nanoparticle size distributions and morphology. J. Phys. Chem. C 117(20):10866–10875. doi:10.1021/jp4041502.
- Chen, X., Z. Zhang, G. Engling, R. Zhang, J. Tao, M. Lin, X. Sang, C. Chan, S. Li, Y. Li. 2014. Characterization of fine particulate black carbon in Guangzhou, a megacity of South China. Atmos. Pollut. Res. 5(3):361–370. doi:10.5094/APR.2014.042.
- Coen, M. C., E. Weingartner, A. Apituley, D. Ceburnis, R. Fierz-Schmidhauser, H. Flentje, J. S. Henzing, S. G. Jennings, M. Moerman, A. Petzold, et al. 2010. Minimizing light absorption measurement artifacts of the aethalometer: Evaluation of five correction algorithms. Atmos. Meas. Tech. 3(2):457–474. doi:10.5194/amt-3-457-2010.
- Cui, X., X. Wang, L. Yang, B. Chen, J. Chen, A. Andersson, O. Gustafsson. 2016. Radiative absorption enhancement from coatings on black carbon aerosols. Sci. Total Environ. 551–552:51–56. doi:10.1016/j.scitotenv.2016.02.0260048-9697.
- Dobbins, R. A., and G. S. Jizmagian. 1966. Optical scattering cross sections for polydispersions of dielectric spheres. J. Opt. Soc. Am. 56(10):1345–1350. doi:10.1364/JOSA.56.001345.
- Dobbins, R. A., R. J. Santoro, and H. G. Semerjian. 1984. Interpretation of optical measurements of soot in flames. Combustion diagnostics by nonintrusive methods. In: Prog. Astronaut. Aeronaut, ed. J.D. McKay and J.A. Roux, vol. 92, 208–237. New York, NY: Am. Inst. Aeronaut. Astronaut.
- Fialho, P., M. C. Freitas, F. Barata, B. Vieira, A. D. A. Hansen, and R. E. Honrath. 2006. The aethalometer calibration and determination of iron concentration in dust aerosols. J. Aerosol Sci. 37(11):1497–1506. doi:10.1016/j.jaerosci.2006.03.002.
- Friedlander, S. K. 2000. Smoke, dust, and haze: Fundamentals of aerosol dynamics, 15, 17, 211, 222–237. 2nd ed. Oxford: Oxford University.
- Haynes, W. M., ed. 2015–2016. Handbook of chemistry and physics. 96th ed., 12–195, 12–205. Florida: CRC, Taylor and Francis Group.
- Irwin, M., Y. Kondo, and N. Moteki. 2015. An empirical correction factor for filter-based photo-absorption black carbon measurements. J. Aerosol Sci. 80:86–97. doi:10.1016/j.jaerosci.2014.11.001.
- Kondo, Y., L. Sahu, N. Moteki, F. Khan, N. Takegawa, X. Liu, M. Koike, and T. Miyakawa. 2011. Consistency and traceability of black carbon measurements made by laser-induced incandescence, thermal-optical transmittance, and filter-based photo-absorption techniques. Aerosol Sci. Technol. 45(2):295–312. doi:10.1080/02786826.2010.533215.
- Krasowsky, T. S., G. R. McMeeking, D. Wang, C. Sioutas, and G. A. Ban-Weiss. 2016. Measurements of the impact of atmospheric aging on physical and optical properties of ambient black carbon particles in Los Angeles. Atmos. Environ. 142:496–504. doi:10.1016/j.atmosenv.2016.08.010.
- Lack, D. A., and J. M. Langridge. 2013. On the attribution of black and brown carbon light absorption using the Ångström exponent. Atmos. Chem. Phys. 13(20):10535–10543. doi:10.5194/acp-13-10535-2013.
- Lack, D. A., J. M. Langridge, R. Bahreini, C. D. Cappa, A. M. Middlebrook, and J. P. Schwarz. 2012. Brown carbon and internal mixing in biomass burning particles. Proc. Natl. Acad. Sci. USA 109(37):14802–14807.
- Lack, D. A., C. D. Cappa, D. S. Covert, T. Baynard, P. Massoli, B. Sierau, T. S. Bates, P. K. Quinn, E. R. Lovejoy, and A. R. Ravishankara. 2008. Bias in filter-based aerosol light absorption measurements due to organic aerosol loading: Evidence from ambient measurements. Aerosol Sci. Technol. 42(12):1033–1041. doi:10.1080/02786820802389277.
- Langridge, J. M., M. S. Richardson, D. A. Lack, C. A. Brock, and D. M. Murphy. 2013. Limitations of the photoacoustic technique for aerosol absorption measurement at high relative humidity. Aerosol Sci. Technol. 47(11):1163–1173. doi:10.1080/02786826.2013.827324.
- Lewis, K. A., W. P. Arnott, H. Moosmüller, R. K. Chakrabarty, C. M. Carrico, S. M. Kreidenweis, D. E. Day, W. C. Malm, A. Laskin, J. L. Jimenez, et al. 2009. Reduction in biomass burning aerosol light absorption upon humidification: Roles of inorganically-induced hygroscopicity, particle collapse, and photoacoustic heat and mass transfer. Atmos. Chem. Phys. 9(22):8949–8966. doi:10.5194/acp-9-8949-2009.
- Liu, C., C. E. Chung, Y. Yin, and M. Schnaiter. 2018. The absorption Ångström exponent of black carbon: From numerical aspects. Atmos. Chem. Phys. 18(9):6259–6273.
- Liu, S., A. C. Aiken, K. Gorkowski, M. K. Dubey, C. D. Cappa, L. R. Williams, S. C. Herndon, P. Massoli, E. C. Fortner, P. S. Chhabra, et al. 2015. Enhanced light absorption by mixed source black and brown carbon particles in UK winter. Nat. Commun. 6:8435.doi:10.1038/ncomms9435.
- Malvern Instruments. 2014. Dynamic light scattering - common terms defined. Worcestershire, United Kingdom: Whitepaper. https://www.malvern.com/en/support/resource-center/Whitepapers/WP111214DLSTermsDefined.html
- Massabò, D., L. Caponi, M. C. Bove, and P. Prati. 2016. Brown carbon and thermal–optical analysis: A correction based on optical multi-wavelength apportionment of atmospheric aerosols. Atmos. Environ. 125:119–125. doi:10.1016/j.atmosenv.2015.11.011.
- Miyakawa, T., Y. Kanaya, Y. Komazaki, F. Taketani, X. Pan, M. Irwin, and J. Symonds. 2016. Intercomparison between a single particle soot photometer and evolved gas analysis in an industrial area in Japan: Implications for the consistency of soot aerosol mass concentration measurements. Atmos. Environ. 127:14–21. doi:10.1016/j.atmosenv.2015.12.018.
- Moteki, N., Y. Kondo, T. Nakayama, K. Kita, L. K. Sahu, T. Ishigai, T. Kinase, and Y. Matsumi. 2010. Radiative transfer modeling of filter-based measurements of light absorption by particles: Importance of particle size dependent penetration depth. J. Aerosol Sci. 41(4):401–412. doi:10.1016/j.jaerosci.2010.02.002.
- Murphy, D. M. 2009. The effect of water evaporation on photoacoustic signals in transition and molecular flow. Aerosol Sci. Technol. 43(4):356–363. doi:10.1080/02786820802657392.
- Naoe, H., S. Hasegawa, J. Heintzenberg, K. Okada, A. Uchiyama, Y. Zaizen, E. Kobayashi, and A. Yamazaki. 2009. State of mixture of atmospheric submicrometer black carbon particles and its effect on particulate light absorption. Atmos. Environ. 43(6):1296–1301. − doi:10.1016/j.atmosenv.2008.11.031.
- Ogren, J. A. 2010. Comment on “Calibration and intercomparison of filter-based measurements of visible light absorption by aerosols”. Aerosol. Sci. Technol. 44:589–591. doi:10.1080/02786826.2010.482111.
- Olson, M. R., M. V. Garcia, M. A. Robinson, P. V. Rooy, M. A. Dietenberger, M. Bergin, and J. J. Schauer. 2014. Investigation of black and brown carbon multiple-wavelength dependent light absorption from biomass and fossil fuel combustion source emissions. J. Geophys. Res. Atmos. 120:1–16. doi:10.1002/2014JD022970.
- Pandey, A., S. Pervez, and R. K. Chakrabarty. 2016. Filter-based measurements of UV–vis mass absorption cross sections of organic carbon aerosol from residential biomass combustion: Preliminary findings and sources of uncertainty. J. Quant. Spectrosc. Radiat. Transf. 182:296–304. doi:10.1016/j.jqsrt.2016.06.023.
- Presser, C., A. Nazarian, J. M. Conny, D. Chand, A. Sedlacek, and J. M. Hubbe. 2017. Absorption/transmission measurements of PSAP particle-laden filters from the biomass burning observation project (BBOP) field campaign. Aerosol Sci. Technol. 51(4):451–466. doi:10.1080/02786826.2016.1267856.
- Presser, C., J. M. Conny, and A. Nazarian. 2014. Filter material effects on particle absorption optical properties. Aerosol Sci. Technol. 48(5):515–529. doi:10.1080/02786826.2014.890999.
- Presser, C. 2012. Absorption coefficient measurements of particle-laden filters using laser heating: Validation with nigrosin. J. Quant. Spectrosc. Radiat. Transf. 113(8):607–623. doi:10.1016/j.jqsrt.2012.01.009.
- Radney, J. G., and C. D. Zangmeister. 2018. Comparing aerosol refractive indices retrieved from full distribution and size- and mass-selected measurements. J. Quant. Spectrosc. Radiat. Transf. 220:52–66. doi:10.1016/j.jqsrt.2018.08.021.
- Radney, J. G., and C. D. Zangmeister. 2017. Light source effects on aerosol photoacoustic spectroscopy measurements. J. Quant. Spectrosc. Radiat. Transf. 187:145–149. doi:10.1016/j.jqsrt.2016.09.026.
- Radney, J. G., X. Ma, K. A. Gillis, M. R. Zachariah, J. T. Hodges, and C. D. Zangmeister. 2013. Direct measurements of mass-specific optical cross sections of single-component aerosol mixtures. Anal. Chem. 85(17):8319–8325. doi:10.1021/ac401645y.
- Shrestha, R., S.-W. Kim, S.-C. Yoon, and J.-H. Kim. 2014. Attribution of aerosol light absorption to black carbon and volatile aerosols. Environ. Monit. Assess. 186(8):4743–4751. doi:10.1007/s10661-014-3734-5.
- Subramanian, R., C. A. Roden, P. Boparai, and T. C. Bond. 2007. Yellow beads and missing particles: Trouble ahead for filter-based absorption measurements. Aerosol Sci. Technol. 41(6):630–637. doi:10.1080/02786820701344589.
- Taylor, B. N., and C. E. Kuyatt. 1994. Guidelines for evaluating and expressing the uncertainty of NIST measurement results. NIST Technical Note 1297. Gaithersburg, MD: National Institute of Standards and Technology.
- Utry, N., T. Ajtai, Á. Filep, M. Pintér, Zs. Török, Z. Bozóki, and G. Szabó. 2014. Correlations between absorption Angström exponent (AAE) of wintertime ambient urban aerosol and its physical and chemical properties. Atmos. Environ. 91:52–59. doi:10.1016/j.atmosenv.2014.03.047.
- Vecchi, R., V. Bernardoni, C. Paganelli, and G. Valli. 2014. A filter-based light-absorption measurement with polar photometer: Effects of sampling artefacts from organic carbon. J. Aerosol Sci. 70:15–25. doi:10.1016/j.jaerosci.2013.12.012.
- Virkkula, A. 2010. Correction of the calibration of the 3-wavelength particle soot absorption photometer (3λ PSAP). Aerosol Sci. Technol. 44(8):706–712. doi:10.1080/02786826.2010.482110.
- Wang, Q., J. P. Schwarz, J. Cao, R. Gao, D. W. Fahey, T. Hu, R.-J. Huang, Y. Han, and Z. Shen. 2014. Black carbon aerosol characterization in a remote area of Qinghai–Tibetan Plateau, western China. Sci. Total Environ. 479–480:151–158. doi:10.1016/j.scitotenv.2014.01.098.
- Wiscombe, W. J. 1979. Mie scattering calculations: Advances in technique and fast, vector-speed computer codes. NCAR Technical Note 140 + STR. Boulder, CO: National Center for Atmospheric Research.
- You, R., J. G. Radney, M. R. Zachariah, and C. D. Zangmeister. 2016. Measured wavelength-dependent absorption enhancement of internally mixed black carbon with absorbing and nonabsorbing materials. Environ. Sci. Technol. 50(15):7982–7990. doi:10.1021/acs.est.6b01473.
- Zangmeister, C. D., R. You, E. M. Lunny, A. E. Jacobson, M. Okumura, M. R. Zachariah, and J. G. Radney. 2018. Measured in-situ mass absorption spectra for nine forms of highly-absorbing carbonaceous aerosol. Carbon 136:85–93. doi:10.1016/j.carbon.2018.04.057.
- Zangmeister, C. D., and J. G. Radney. 2018. NIST interlaboratory study of aerosol absorption measurements using photoacoustic spectroscopy, NIST technical note 1989. Gaithersburg, MD: National Institute of Standards and Technology, April 27, 2018. doi:10.6028/NIST.TN.1989.