
 ?Mathematical formulae have been encoded as MathML and are displayed in this HTML version using MathJax in order to improve their display. Uncheck the box to turn MathJax off. This feature requires Javascript. Click on a formula to zoom.
Abstract
A hybrid dust collector attached to a subway train bottom was developed for the effective removal of subway particulate matter (PM), by considering the fluctuating speed of a subway train between stations. It combines an electrostatic precipitator, which has good collection efficiency when the flow velocity is low, and an inertial dust separator, which has good collection efficiency when the flow velocity is high. The electrostatic precipitator and inertial dust separator guarantee a high collection efficiency regardless of the subway train operating speed by compensating for the other’s shortcomings. Wind tunnel test and numerical simulation were conducted to verify the performance of the hybrid dust collector. The experiment and simulation results were compared to verify the prediction accuracy of the simulation method. The collection efficiencies of the electrostatic precipitator and inertial dust separator were then simulated for various operating speeds of the subway train to predict the overall collection efficiency of the hybrid dust collector. As a result, when airflow velocity at the hybrid dust collector inlet varied from 2 to 8 m/s, subway PM10 or PM2.5 collection rate of a single hybrid dust collector was predicted to be in the range 88 ∼ 123 μg/s or 30 ∼ 35 μg/s, respectively. The use of multiple such hybrid dust collectors attached to the subway train bottom is expected to be effective in reducing fine dust concentration in subway tunnels.
Copyright © 2019 American Association for Aerosol Research
EDITOR:
1. Introduction
In big cities, many citizens use subway systems as a convenient method of transportation. Seoul, which has a population of 10 million, has more than 10 subway lines with about 2.6 billion passengers annually (www.seoulmetro.co.kr). Because many citizens use subway trains every day, a lot of studies have been conducted on the air quality of the subway environment. The particle concentration has been measured to be higher than that in the urban atmosphere (Pfeifer, Harrison, and Lynam Citation1999; Johansson and Johansson Citation2003; Jung et al. Citation2010; Fan et al. Citation2017; Cao et al. Citation2017; Li et al. Citation2017). The fine dust in the subway environment is known to consist mainly of iron compounds (Aarnio et al. Citation2005; Salma, Weidinger, and Maenhaut Citation2007; Martins et al. Citation2016; Moreno et al. Citation2017). The iron-containing dust is mainly generated or scattered by subway trains operating in the tunnel (Salma, Weidinger, and Maenhaut Citation2007; Martins et al. Citation2016) and can seep to the platform or subway carriage to be breathed in by passengers or subway workers (Cheng, Liu, and Yan Citation2012; Park, Woo, and Park Citation2014). This dust is known to be more harmful to the human body than the fine dust of general roads (Karlsson, Nilsson, and Möller Citation2005; Moreno et al. Citation2017). Thus, steps need to be taken to try to eliminate fine dust in the subway environment.
A railway cleaning vehicle is generally used to reduce the concentration of fine dust in subway systems (Jeong et al. Citation2016). Several companies such as Vaktrak in France and Schörling Kommunal GmbH in Germany have developed and used railway cleaning vehicles. These vehicles can be divided into dry and wet types. The dry type runs along the rail when the subway trains stop operating, and the dust on the floor is scattered, sucked, and removed by a filter. The wet type sprays water inside the tunnel that the particles adsorb onto and then cleans the tunnel by releasing the water. In Taiwan, Chen et al. (Citation2017) found that PM10 in the tunnels increased temporarily after the whole metro system was cleaned, but PM10 and PM2.5 were greatly reduced after 3 months because of the ventilation and filtering effects of the air conditioning system and re-adsorption onto the porous concrete surface. According to Johansson and Johansson (Citation2003), Salma, Weidinger, and Maenhaut (Citation2007), and Querol et al. (Citation2012), the fine dust concentration is extremely low when subway trains are not running and is only high when the subway trains are running. Therefore, there is concern that the cleaning efficiency is reduced if the railway cleaning vehicle cleans while the subway trains are not running. The general operating speed of a railway cleaning vehicle is up to 5 km/h (Jeong et al. Citation2016); because it can only be operated when subway trains are not in service, a major disadvantage is the many restrictions on the cleaning time.
Another method to remove fine dust is to purify the air with facilities installed in the middle of the underground tunnel (Tokarek and Bernis Citation2006; Li and Jo Citation2010; Juraeva et al. Citation2013; Son et al. Citation2014). Fine dust is forcibly removed with a filter, electrostatic precipitator, magnetic force, etc. This method has the advantage of being able to purify air quality in a tunnel even when subway trains are operating, which is when a large amount of fine dust is scattered. However, its disadvantages include the need for additional space, high installation costs, and improvement of only the air quality near the installed facility within the tunnel.
If a dust collector is attached to a subway train, e.g., as illustrated in , this is equivalent to running a railway cleaning vehicle while the subway trains are operating. Papers and patents on attaching a dust collector to a subway train have been published (Sim et al. Citation2017). These dust collectors mainly utilize a single dust collection method that uses the wind produced by a running train. For example, in case of the louver dust collector proposed by Sim et al. (Citation2017), the collection efficiency for particles smaller than 10 μm decreases with the vehicle speed. Actual subway trains repeat the process of acceleration, cruise control, deceleration, and stopping between stations, as shown in . For a dust collector that depends on the driving wind of the running vehicle, the flow rate of aerosols entering the dust collector changes with each moment. Therefore, maintaining a high collection efficiency at all subway train speeds with only one dust collection method is difficult.
Figure 1. Concept of hybrid dust collector: (a) attachment position of hybrid dust collector; (b) general subway operation pattern.
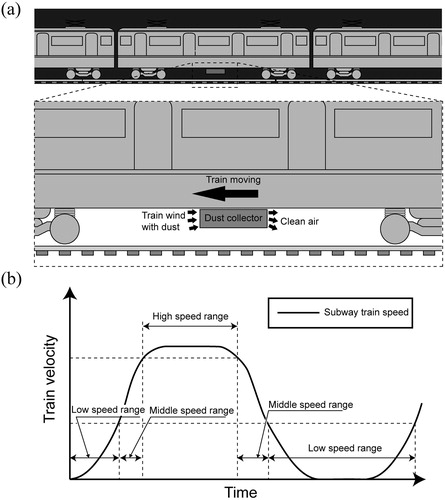
In general, a faster flow velocity increases the collection efficiency of inertial dust separators, while a slower flow velocity increases the collection efficiency of electrostatic precipitators (Hinds Citation1999). If both types of dust collectors are connected in series, a high collection efficiency can be expected at both low and high speeds. In this study, a hybrid dust collector attached to a subway train as shown in was designed, and its dust collection performance was evaluated by considering fluctuating speed of the subway train between stations as displayed in . Due to limited size and airflow velocity of the wind tunnel employed in this study, collection efficiencies of an inertial dust separator and an electrostatic precipitator were separately determined at airflow velocities lower than 4 m/s. Numerical approaches were established to predict collection efficiencies of both types of dust collectors and verified by comparing numerical results with experimental data. Then, the collection efficiency of a hybrid dust collector composed of both inertial dust separator and electrostatic precipitator was numerically evaluated at the airflow velocities up to 8 m/s, by considering the airflow velocities in the central space under a subway train running in an underground tunnel (Lee et al. Citation2016). Then, PM10 and PM2.5 collection rates by the developed hybrid dust collector were estimated by considering the subway PM size distribution measured by Woo et al. (Citation2018).
2. Configuration of hybrid dust collector
The hybrid dust collector comprises an inertial dust separator and an electrostatic precipitator that are connected in series. The electrostatic precipitator generally has a very low flow resistance, while the inertial dust separator has a much higher flow resistance because it accelerates the flow and changes the direction to deflect particles from the streamline. The hybrid dust collector was designed to use the driving wind generated by a running subway train, as shown in . Thus, if the flow resistance is large, the train wind cannot flow into the dust collector. As shown in , a louver dust collector with a relatively low flow resistance was selected as the inertial dust separator. The louver dust collector is primarily used to remove large dust such as sand in gas turbines, and it can economically handle large flow rates because of its low flow resistance (Musgrove et al. Citation2012). In this study, the shape and dimensions of the louver dust collector were determined by referring to Sim et al. (Citation2017).
Figure 2. Schematic of dust collectors: (a) louver dust collector; (b) electrostatic precipitator.
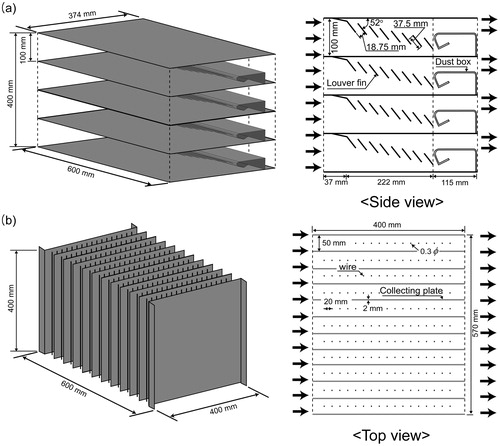
The electrostatic precipitator is installed to the rear of the louver dust collector. It applies a high voltage to the electrode, which gives particles a unipolar charge by ionizing the surrounding air. The charged particles are separated from the flow by the electrostatic force while passing through the high-voltage electric field and are collected in the collecting plate. Electrostatic precipitators are generally plates (Kim and Lee Citation1999; Jedrusik, Swierczok, and Teisseyre Citation2003; Podliński et al. Citation2006; Podliński, Niewulis, and Mizeraczyk Citation2009) or cylinders (Liang et al. Citation2002; Blejan et al. Citation2010; Kawakami et al. Citation2012). The electrode can be a wire (Kim and Lee Citation1999; Talaie Citation2005; Podliński et al. Citation2006; Zhu et al. Citation2009) or spike (Jedrusik, Swierczok, and Teisseyre Citation2003; Podliński, Niewulis, and Mizeraczyk Citation2009; Farnoosh, Adamiak, and Castle Citation2011). The collection efficiency of the electrostatic precipitator is influenced by many variables, such as the operating conditions (temperature and humidity), wire spacing and thickness, and roughness of the ground plate. In this study, the most basic wire–plate electrostatic precipitator was used, as shown in . The shape and dimensions of the electrostatic precipitator were determined by referring to Podliński et al. (Citation2006).
When the driving wind of a subway train is used, the flow rate of air entering the dust collector increases with the cross-sectional area of the dust collector. However, due to the limited space below the subway train, the cross-sectional area of the hybrid dust collector was limited to a width of 600 mm and a height of 400 mm. The collection efficiency of the electrostatic precipitator increases with its length (Parker Citation1997), but a length of 400 mm was selected in consideration of the limited installation space and maintenance convenience.
3. Numerical approach
The computational fluid dynamics (CFD) code, ANSYS FLUENT Release 17.0, was used to analyze the flow and particle motion to calculate the collection efficiencies of a louver dust collector, an electrostatic precipitator, and a hybrid dust collector composed of both louver dust collector and electrostatic precipitator.
3.1. Louver dust collector simulation
The louver dust collector consisted of four layers, as shown in ; each layer had a height of 100 mm, a width of 600 mm, and a length of 374 mm. presents the two-dimensional computational domain (side view of the louver dust collector) used to predict the collection efficiency of the louver dust collector. The flow was assumed to be two-dimensional, steady, incompressible, and turbulent. A standard k–ε turbulence model based on the Reynolds-averaged Navier–Stokes (RANS) equations was used for turbulent flow analysis (Kim and Kim Citation2007; Cao et al. Citation2012; Sim et al. Citation2017). To induce sufficient flow development, the velocity inlet condition was set 1450 mm upstream of the louver dust collector. The outlet boundary condition was set 500 mm downstream of the louver dust collector. All walls were set to the no-slip condition. Based on the grid independence test, the simulation was carried out on 114,900 grids with no change in flow and collection efficiency. The calculation was repeated until the residual value was less than 10−5 for all governing equations of the flow analysis.
Figure 3. Calculation domain: (a) louver dust collector simulation; (b) electrostatic precipitator simulation; (c) hybrid dust collector simulation.
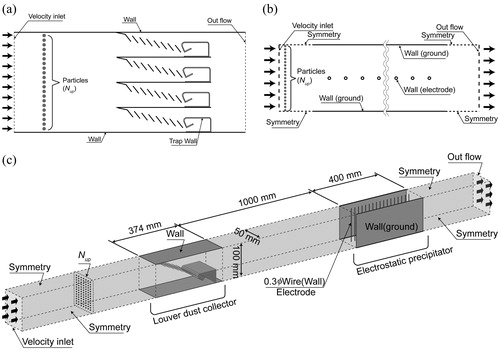
After the flow analysis, the particle behavior was analyzed with the discrete phase models (DPM) built in FLUENT. The drag, gravity, and diffusion were considered as forces that affect the particle behavior. Particles were set to be trapped at walls as the boundary condition for the particle analysis. As shown in , Nup particles of the same size were injected at equal intervals 100 mm upstream of the louver dust collector. The simulated collection efficiency was determined as follows:
(1)
(1)
where Ndown is the number of particles that escaped from the computational domain without being captured by the louver dust collector.
3.2. Electrostatic precipitator simulation
Given the repetitive shape of the electrostatic precipitator as shown in , a two-dimensional computational domain for a stack was considered, as shown in (top view of the electrostatic precipitator). The flow was assumed to be two-dimensional, steady, incompressible, and turbulent and was analyzed with the standard k–ε turbulence model. Velocity inlet condition and pressure outlet condition were set to the inlet and outlet of the computational domain, respectively. No-slip condition was set to the wire and plate wall. Due to the repetitive shape of the electrostatic precipitator, the interface between the stacks, except for the plate wall, was set to the symmetry condition. Based on the grid independence test, a simulation was carried out with more than 39,000 grids with no change in flow and collection efficiency. Similar to the louver dust collector, the calculation was repeated until the residual value was less than 10−5 for all governing equations of the flow analysis.
To analyze the collection efficiency of the electrostatic precipitator, the electrical potential and charge density by corona charging were interpreted with the following governing equations (Böttner Citation2003; Zhao and Adamiak Citation2008).
(2)
(2)
(3)
(3)
where ε is the dielectric constant of air, E is the electrical intensity, ρ is the space charge density, V is the electrical potential, J is the current density, and b is the ion mobility. To analyze the electric field, the electric field boundary condition was assigned to major interfaces such as the wire, collecting plate, inlet, and outlet (McDonald et al. Citation1977). Because the collecting plate was grounded, the electrical potential was 0, and the space charge density had a gradient of 0 in the normal direction to the wall. The rest of the interfaces had a gradient for the electrical potential and gradient of 0 in the normal direction for the space charge density. The wire space charge density ρw is defined as follows (Long et al. Citation2009):
(4)
(4)
where jc is the current density on the wire, which is the discharge electrode; r is the radius of the wire; and f is the roughness factor of the wire, which was assumed to be 1. In addition, δ is the normalized gas density at the normal temperature and pressure. For the applied voltage and space charge density of the discharge electrode, the applied voltage and current values measured in the experiment were used. EquationEquations (2)
(2)
(2) and Equation(3)
(3)
(3) were solved under these boundary conditions to complete the electric field analysis.
After the flow and electric field analyses were completed, the particle behavior was analyzed with the DPM. The forces considered in calculating the particle trajectories were the drag force, gravitational force, diffusion force, and electrical force. The collection efficiency was obtained by injecting particles upstream and counting the number of particles that escaped downstream without being trapped. This is just like the analysis of the collection efficiency for the louver dust collector. To consider the charging portion and electrical mobility, the simulated particles were made to reflect the electrical force. The charging portion of a particle over time can be expressed by the following non-dimensional equation (Lawless Citation1996; Long and Yao Citation2010):
(5)
(5)
where f(w) is the fraction of the surface covered by the diffusive band:
(6)
(6)
where υ is the dimensionless particle charge, w is the dimensionless electric field, and tq is the dimensionless particle charging time. These are calculated as follows:
(7)
(7)
(8)
(8)
(9)
(9)
where qp is the particle charge, e is the charge of an electron, dp is the diameter of the particle, k is the Boltzmann’s constant, T is the absolute temperature, Kp is the particle dielectric constant, and t is the particle charging time. The particle charge qp was obtained by inputting and calculating t, ρ, E for each Lagrangian step in the DPM of Fluent. The charged particle was calculated to receive the following electrical force (FE) from the electric field:
(10)
(10)
3.3. Hybrid dust collector simulation
As shown in , a three-dimensional calculation domain was considered to calculate the collection efficiency of the hybrid dust collector. By considering the repeated geometries of both the louver dust collector in vertical direction and the electrostatic precipitator in horizontal direction as displayed in , the height and width of the calculation domain were set to be 100 and 50 mm, respectively. The length of the calculation domain was 3300 mm. The distance between the louver dust collector and the electrostatic precipitator was set to be 1000 mm in order for the particles escaping the louver dust collector to be evenly distributed at the inlet of the electrostatic precipitator. The flow was assumed to be three-dimensional, steady, incompressible, and turbulent, and was analyzed with the standard k–ε turbulence model. Velocity inlet condition and pressure outlet condition were used at the inlet and outlet of the calculation domain, respectively. No-slip conditions were used at all walls including louver blades, dust box, wire, and ground plates. Symmetry conditions were used at the non-walled boundaries of the calculation domain. Based on the grid independence test, three-dimensional simulations were carried out on ∼3.9 million grids with no change in flow and collection efficiency. The calculation was repeated until the residual value was less than 10−5 for all governing equations of the flow analysis. After the flow analysis, the collection efficiency of the hybrid dust collector was calculated by using EquationEquation (1)(1)
(1) , where Nup is the number of particles injected 800 mm upstream of the louver dust collector and Ndown is the number of particles escaping through the outlet of the calculation domain. The effects of drag, gravity, diffusion, and electrical force were considered in calculating particle trajectories.
4. Experimental approach
As shown in , the collection efficiency of the louver dust collector or the electrostatic precipitator was measured by using a wind tunnel with a cross-sectional area of 600 × 600 mm. Because the test section of the wind tunnel employed in this study was not big enough to contain the whole body of the hybrid dust collector, the louver dust collector and the electrostatic precipitator were tested separately in the wind tunnel. The louver dust collector was made of aluminum. The wire used for the electrostatic precipitator was made of tungsten, and the ground plate was made of aluminum. A high voltage of 12 kV was applied to the electrostatic precipitator with the power supply. Arizona test dust A4 (ISO 12103-1) particles were aerosolized with a solid aerosol generator (SAG 410, TOPAS, Dresden, Saxony, Germany) and sprayed through an L-shaped stainless steel tube upstream of the wind tunnel. Although no filter was placed on the front and rear of the blower, the influence of atmospheric particles was judged to be negligible because the concentration of sprayed particles was tens to hundreds of times higher than the concentration of particles in the laboratory. According to Lee et al. (Citation2016), the airspeed under a subway train running at 70 km/h in a tunnel is about 5–12 m/s. Meanwhile, Sim et al. (Citation2017) reported that the speed of air entering the inlet of a louver dust collector increases linearly up to about 5 m/s for subway train running speeds of up to 65 km/h. Because of the limitations of the wind tunnel used in this study, the collection efficiency was only measured in the experiment for flow velocities of less than 4 m/s. The collection efficiency for flow velocities of greater than 4 m/s was predicted by simulation. As shown in , the speed of air entering the dust collector was measured with a velocimetry (VELOCICALC 9565, TSI, USA) at nine points on section A–A in front of the dust collector in the wind tunnel. The pressure drops before and after the dust collector were measured by utilizing the differential pressure gauge (MP210, MPR500, KIMO, France) at three points on each of B–B and C–C sections. The results showed that the flow velocity and pressure drop had uniform distributions of ±2% and ±5%, respectively.
Figure 4. Schematic of experiment set-up.
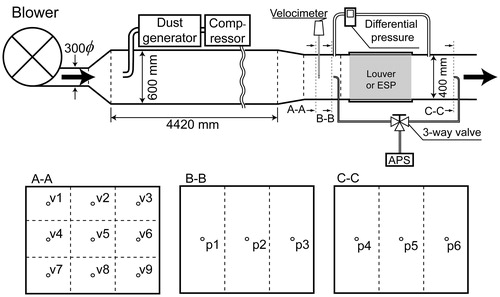
An aerodynamic particle sizer (APS 3321, TSI, USA) was used to measure the aerodynamic size and number concentration of particles upstream and downstream of the dust collector. The APS had a total of 51 channels that were used to measure particle sizes from 0.542 to 19.81 μm. To neglect the effects of sampling and transport losses, sampling inlets and tubes used upstream and downstream of the dust collector were made identical. The particle concentration was measured at three points on each of B–B and C–C sections, as shown in . In each experiment, the measurement was repeated at least three times, and the collection efficiency was obtained as follows:
(11)
(11)
where the subscript i means the ith particle size channel in the APS, η is the collection efficiency, and Cdown and Cup are the particle number concentrations downstream and upstream, respectively, of the dust collector.
5. Results and discussion
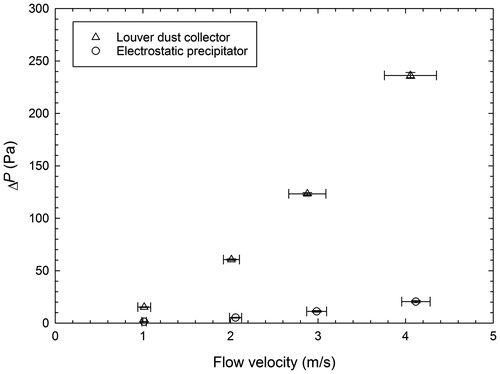
shows the measured differential pressure depending on the velocity of the incoming air for the louver dust collector and electrostatic precipitator. When the flow velocity was 1 m/s, the differential pressures of the louver dust collector and electrostatic precipitator were 15 and 1.3 Pa, respectively. When the flow velocity was 4 m/s, the differential pressures were 230 and 20 Pa, respectively. The louver dust collector was shown to have about 10 times the differential pressure of the electrostatic precipitator under the same flow velocity condition. Therefore, the flow rate of air entering the hybrid dust collector by the train wind greatly depends on the flow resistance of the louver dust collector, and the flow resistance of the electrostatic precipitator has much less influence.
Figure 5. Relationship between pressure drop and flow velocity for louver dust collector and electrostatic precipitator.
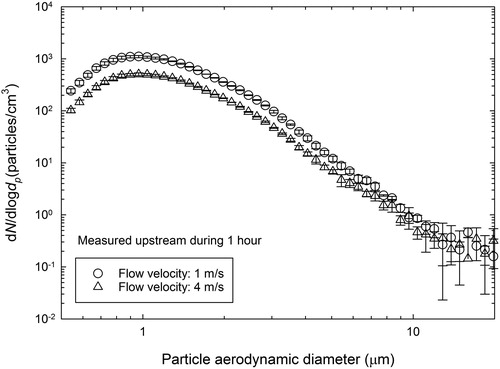
For the experiment measuring the collection efficiency, a dust collector was installed 5 m downstream from where the particles were sprayed so that the particles would be evenly distributed over the wind tunnel cross-section. shows the particle size distributions measured at three points on the B–B section located upstream of the dust collector for 1 h, at the airflow velocities of 1 and 4 m/s. The spatial and temporal variation of the particle concentration during 1 h was less than 5% for 0.5–4 μm particles, 10% for 4–6 μm particles, and 15% for 6–10 μm particles, showing spatial uniformity and temporal stability of particle size distribution. As the particles moved the distance of 5 m, large particles showed a large loss of transport because of gravitational settling. Thus, particles larger than 10 μm in size had a much lower concentration, so the results were not suitable for evaluating the collection efficiency. Therefore, the collection efficiency was measured only for particles less than 10 μm in size.
Figure 6. Number concentration distribution of the Arizona test dust used in the experiments.
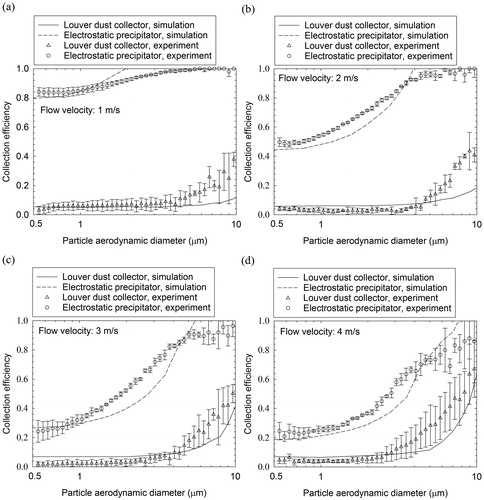
shows the experimental and simulated collection efficiencies of each of the louver dust collector and electrostatic precipitator. When the flow velocity was low at 1 and 2 m/s, the electrostatic precipitator showed a much higher collection efficiency than the louver dust collector. As the flow velocity increased, the collection efficiency of the electrostatic precipitator decreased, while the collection efficiency of the louver dust collector increased. The experimental and simulation results matched well under all flow velocity conditions. When the flow velocity was 1, 2, or 3 m/s, the cutoff sizes corresponding to a 50% collection efficiency could not be compared because of the low collection efficiency of the louver dust collector. At a flow velocity of 4 m/s, however, the collection efficiency of the louver dust collector increased, which allowed the cutoff sizes to be compared. When the flow velocity was 4 m/s, the cutoff sizes of the louver dust collector were 9.3 μm in the simulation and 8.2 μm in the experiment, showing a good agreement. The electrostatic precipitator showed a collection efficiency of ≥20% under all tested flow velocity conditions, which facilitated the comparison with the simulation. At flow velocities of 1, 2, 3, and 4 m/s, the mean error between the simulated and experimental collection efficiencies were 2%, 7%, 8%, and 7%, respectively.
Figure 7. Comparison of collection efficiency of louver dust collector and electrostatic precipitator between experiment and simulation. Symbols represent experiment data, and lines represent simulation results: (a) 1 m/s; (b) 2 m/s; (c) 3 m/s; (d) 4 m/s.
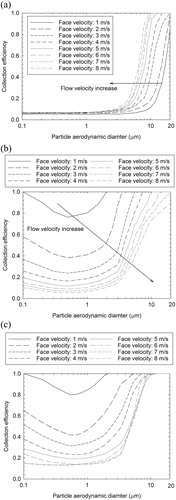
The above results verified that the simulated collection efficiencies of the louver dust collector and electrostatic precipitator were correct. Based on this, the collection efficiency was also simulated for flow velocities of ≥5 m/s. presents the simulation results for the collection efficiency at flow velocities of 1–8 m/s. shows the case with only the louver dust collector; the collection efficiency increased with the flow velocity. shows the case with only the electrostatic precipitator; the collection efficiency decreased as the flow velocity increased. shows the collection efficiency of the hybrid dust collector. When the flow velocity was less than 5 m/s, the electrostatic precipitator had a large influence, so the collection efficiency of the hybrid dust collector decreased greatly as the flow velocity increased. When the flow velocity was 6–8 m/s, the collection efficiency no longer decreased greatly because of the louver dust collector.
Figure 8. Simulated collection efficiencies of dust collectors according to flow velocity: (a) louver dust collector; (b) electrostatic precipitator; (c) hybrid dust collector.
If the hybrid dust collector is assumed to be attached to the bottom a subway train running in an underground tunnel, the amount of dust that is collected according to the running speed needs to be predicted. When air enters the dust collector at a high velocity, the total amount of dust collected can increase even though the collection efficiency is low. According to Woo et al. (Citation2018), who measured the fine dust concentration inside a subway tunnel, the mass concentration distribution of subway particles was found to peak around a particle size of about 3 μm. The distribution of Woo et al. (Citation2018) was applied to the collection efficiency of each dust collector shown in , and the amount of the dust collected according to the flow velocity was predicted as follows:
(12)
(12)
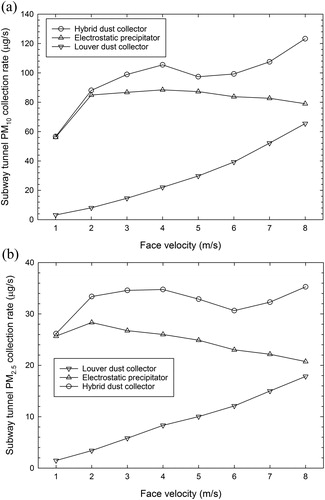
Here, MU (μg/s) is the amount of dust collected per unit time by the dust collector at the face velocity U; A (m2) is the inlet cross-sectional area of the dust collector; U (m/s) is the face velocity at the inlet of the dust collector; dae,min is the smallest aerodynamic particle size considered for measurement; dae,max is set to be 10 μm or 2.5 μm aerodynamic particle size considered for measurement of PM10 or PM2.5, respectively; mi (μg/m3) is the particle mass concentration in the tunnel for each particle size obtained from the distribution of Woo et al. (Citation2018); and ηi,U is the collection efficiency of the dust collector at the face velocity U according to the particle size. shows the predicted results with EquationEquation (12)(12)
(12) ; it indicates the PM10 or PM2.5 amount of subway dust particles collected according to the face velocity at the inlet of each dust collector. When the flow velocity was less than 4 m/s, the collection efficiency of the electrostatic precipitator decreased as the flow velocity increased, as shown in . On the other hand, as displayed in , the amount of PM10 collected in the electrostatic precipitator increased with increasing flow velocity, because the increased treatment flow rate had a significant effect. When the flow velocity was more than 4 m/s, the decrease in collection efficiency had a greater effect than the increase in the treatment flow rate, so the amount of PM10 collected slightly decreased as the flow velocity increased. For the PM2.5 collection by the electrostatic precipitator, the same trend was found but with an inflection at the flow velocity of 2 m/s. For the louver dust collector, because the collection efficiency and treatment flow rate increased with the flow velocity as shown in , the amount of both PM10 and PM2.5 collected in the louver dust collector steadily increased with increasing flow velocity as displayed in . The hybrid dust collector collected a similar amount of PM10 and PM2.5 as the electrostatic precipitator when the flow velocity was 1 m/s, but it collected more PM10 and PM2.5 when the flow velocity was more than 2 m/s. This means that the hybrid dust collector is not greatly influenced by the operating speed of the subway train and can generally collect a significant amount of PM10 and PM2.5 in most operating sections. Thus, using the two types of dust collectors together can be concluded to collect more dust in the subway tunnel than using a louver dust collector or electrostatic precipitator alone.
Figure 9. Estimated PM collection rates of dust collectors according to flow velocity: (a) PM10; (b) PM2.5.
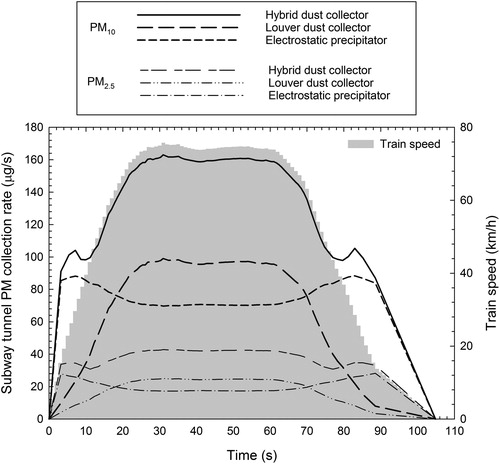
As the next step, subway tunnel PM collection rate of the hybrid dust collector was estimated by considering the fluctuating train speed due to the process of acceleration, cruise control, and deceleration of subway trains between neighboring stations. shows a typical speed variation of subway trains operating along the Seoul Metro Line 5, between Janghanpyeong station and Gunja station. Since the pressure drop across the louver dust collector was much greater than that across the electrostatic precipitator as shown in , it was assumed that the airflow velocity at the inlet of the hybrid dust collector attached to the subway train bottom was mainly dependent on the flow resistance of only the louver dust collector. Therefore, along with the collection efficiencies shown in , the louver dust collector inlet velocity profile of Sim et al. (Citation2017) as a function of train speed was employed in this study and used in EquationEquation (12)(12)
(12) to estimate the amount of PM collected by each type of dust collector attached to the bottom of a subway train. also shows the amount of PM estimated to be collected by each dust collector, which was assumed to be attached to the bottom of a subway train operating in the tunnel between Janghanpyeong station and Gunja station. Roughly speaking, for both PM10 and PM2.5, the electrostatic precipitator was expected to collect more amount of particles than the louver dust collector during acceleration and deceleration, whereas the louver dust collector was found to be slightly more efficient than the electrostatic precipitator during cruise control. Over the most of the tunnel section between two stations, the hybrid dust collector composed of both the louver dust collector and the electrostatic precipitator was anticipated to collect the subway particles at the collection rates in the range 100 ∼ 160 μg/s for PM10 or 30 ∼ 40 μg/s for PM2.5. As a result, the total mass of subway particles collected by a single hybrid dust collector, in the tunnel section between Janghanpyeong station and Gunja station, was predicted to be 12.0 mg for PM10 or 3.4 mg for PM2.5.
Figure 10. Estimated PM collection rates of dust collectors according to flow velocity by considering the operating train speed in the tunnel section between Janghanpyeong station and Gunja station.
6. Conclusion
Because subway trains operate by repeatedly stopping, accelerating, cruising, and decelerating, it needs a dust collector with a high collection efficiency at various operating speeds. In this study, a hybrid dust collector was developed that combines an electrostatic precipitator with high collection efficiency at low flow velocities and an inertial dust separator with high collection efficiency at high flow velocities in series. A wind tunnel test and simulation were utilized to verify the performance of the hybrid dust collector. A louver dust collector was adopted as the inertial dust separator, and an electrostatic precipitator using a tungsten wire and aluminum plate was chosen. The differential pressure was measured in the wind tunnel test, and the flow resistance ratio of the louver dust collector was 10 times higher than that of the electrostatic precipitator in the hybrid dust collector. Thus, the flow rate of the hybrid dust collector is greatly influenced by the flow resistance of the louver dust collector. The collection efficiency of the electrostatic precipitator was highest at 1 m/s and decreased as the flow velocity increased up to 8 m/s. On the other hand, the collection efficiency of the louver dust collector significantly increased as the flow velocity increased from 1 to 8 m/s. Therefore, the hybrid dust collector demonstrates how each collection method could be used at various flow velocities. As a more quantitative comparison, this study predicted the amount of subway tunnel PM10 and PM2.5 collected by each dust collector, based on the mass concentration distribution of particles in the actual subway tunnel. When the velocity of air entering the dust collector was more than 2 m/s, the PM10 and PM2.5 collected by the hybrid dust collector was predicted to range from 88 to 123 μg/s, and from 30 to 35 μg/s, respectively. If multiple such hybrid dust collectors are attached to many subway trains, their driving wind can be used to effectively reduce the fine dust concentration in subway tunnels with low power consumption. Future studies will focus on improving the performance of the electrostatic precipitator and inertial dust separator and optimizing their parameters.
Conflict of interest
The author states that there are no conflicts of interest.
Additional information
Funding
References
- Aarnio, P., T. Yli-Tuomi, A. Kousa, T. Mäkelä, A. Hirsikko, K. Hämeri, M. Räisänen, R. Hillamo, T. Koskentalo, and M. Jantunen. 2005. The concentrations and composition of and exposure to fine particles (PM2.5) in the Helsinki subway system. Atmos. Environ. 39 (28):5059–5066. doi: 10.1016/j.atmosenv.2005.05.012.
- Blejan, O., P. V. Notingher, L. M. Dumitran, M. Younes, A. Samuila, and L. Dascalescu. 2010. Experimental study of the corona discharge in a modified coaxial wire-cylinder electrostatic precipitator. IEEE Trans. Ind. Appl. 46 (1):3–8.
- Böttner, C. U. 2003. The role of the space charge density in particulate processes in the example of the electrostatic precipitator. Powder Technol. 135–136:285–294. doi: 10.1016/j.powtec.2003.08.020.
- Cao, L. N. Y., J. Cao, S. Lee, Y. Zhang, and X. Tie. 2012. Numerical simulation of the micro environment in the Han Yang mausoleum museum. Aerosol Air Qual. Res. 12 (4):544–552. doi: 10.4209/aaqr.2011.12.0240.
- Cao, S. J., X. R. Kong, L. Li, W. Zhang, Z. P. Ye, and Y. Deng. 2017. An investigation of the PM2.5 and NO2 concentrations and their human health impacts in the metro subway system of Suzhou, China. Environ. Sci. Proc. Imp. 19:666–675. doi: 10.1039/C6EM00655H.
- Chen, Y. Y., C. Y. Lu, P. C. Chen, I. F. Mao, and M. L. Chen. 2017. Analysis of aerosol composition and assessment of tunnel washing performance within a mass rapid transit system in Taiwan. Aerosol Air Qual. Res. 17 (6):1527–1538. doi: 10.4209/aaqr.2017.03.0120.
- Cheng, Y. H., Z. S. Liu, and J. W. Yan. 2012. Comparisons of PM10, PM2.5, particle number, and CO2 levels inside metro trains traveling in underground tunnels and on elevated tracks. Aerosol Air Qual. Res. 12 (5):879–891. doi: 10.4209/aaqr.2012.05.0127.
- Fan, H., X. Li, J. Deng, G. Da, E. Gehin, and M. Yao. 2017. Time-dependent size-resolved bacterial and fungal aerosols in Beijing subway. Aerosol Air Qual. Res. 17 (3):799–809. doi: 10.4209/aaqr.2016.03.0114.
- Farnoosh, N., K. Adamiak, and G. S. Castle. 2011. Numerical calculations of submicron particle removal in a spike-plate electrostatic precipitator. IEEE Trans. Dielect. Electr. Insul. 18 (5):1439–1452. doi: 10.1109/TDEI.2011.6032814.
- Hinds, W. C. 1999. Aerosol technology-properties, behavior, and measurement of airborne particles. 2nd ed. New York: John Wiley.
- Jedrusik, M., A. Swierczok, and R. Teisseyre. 2003. Experimental study of fly ash precipitation in a model electrostatic precipitator with discharge electrodes of different design. Powder Technol. 135–136:295–301. doi: 10.1016/j.powtec.2003.08.021.
- Jeong, W., S. B. Kwon, S. Ko, and D. Park. 2016. Dust collection system optimization with air blowing and dust suction module. J. Korea Academia-Industrial Cooperation Soc. 17 (1):290–297. doi: 10.5762/KAIS.2016.17.1.290.
- Johansson, C., and P. Å. Johansson. 2003. Particulate matter in the underground of Stockholm. Atmos. Environ. 37 (1):3–9. doi: 10.1016/S1352-2310(02)00833-6.
- Jung, H. J., B. Kim, J. Ryu, S. Maskey, J. C. Kim, J. Sohn, and C. U. Ro. 2010. Source identification of particulate matter collected at underground subway stations in Seoul, Korea using quantitative single-particle analysis. Atmos. Environ. 44 (19):2287–2293. doi: 10.1016/j.atmosenv.2010.04.003.
- Juraeva, M., K. J. Ryu, S. H. Jeong, and D. J. Song. 2013. Influence of mechanical ventilation-shaft connecting location on subway tunnel ventilation performance. J. Wind Eng. Ind. Aerod. 119:114–120. doi: 10.1016/j.jweia.2013.05.016.
- Karlsson, H. L., L. Nilsson, and L. Möller. 2005. Subway particles are more genotoxic than street particles and induce oxidative stress in cultured human lung cells. Chem. Res. Toxicol. 18 (1):19–23. doi: 10.1021/tx049723c.
- Kawakami, H., A. Zukeran, K. Yasumoto, T. Inui, Y. Enami, Y. Ehara, and T. Yamamoto. 2012. Numerical simulation of three-dimensional particle migration and electrohydrodynamics of double cylinder electrostatic precipitator. Int. J. Plasma Environ. Sci. Technol. 6:104–110.
- Kim, S. H., and K. W. Lee. 1999. Experimental study of electrostatic precipitator performance and comparison with existing theoretical prediction models. J. Electrostat. 48 (1):3–25. doi: 10.1016/S0304-3886(99)00044-3.
- Kim, J. Y., and K. Y. Kim. 2007. Experimental and numerical analyses of train-induced unsteady tunnel flow in subway. Tunn. Undergr. Sp. Technol. 22 (2):166–172. doi: 10.1016/j.tust.2006.06.001.
- Lawless, P. A. 1996. Particle charging bounds, symmetry relations, and an analytic charging rate model for the continuum regime. J. Aerosol Sci. 27 (2):191–215. doi: 10.1016/0021-8502(95)00541-2.
- Lee, K. R., W. G. Kim, S. H. Woo, J. B. Kim, G. N. Bae, H. K. Park, H. H. Yoon, and S. J. Yook. 2016. Investigation of airflow and particle behavior around a subway train running in the underground tunnel. Aerosol Sci. Technol. 50 (7):669–678. doi: 10.1080/02786826.2016.1173185.
- Li, K., and Y. M. Jo. 2010. Dust collection by a fiber bundle electret filter in an MVAC system. Aerosol Sci. Technol. 44 (7):578–587. doi: 10.1080/02786826.2010.481227.
- Li, Z., W. Che, H. C. Frey, A. K. H. Lau, and C. Lin. 2017. Characterization of PM2.5 exposure concentration in transport microenvironments using portable monitors. Environ. Pollut. 228:433–442. doi: 10.1016/j.envpol.2017.05.039.
- Liang, X., S. Jayaram, A. A. Berezin, and J. S. Chang. 2002. Modeling of the electrical parameters of a wire-cylinder electrostatic precipitator under pulse energization. IEEE T. Ind. Appl. 38:35–42.
- Long, Z., Q. Yao, Q. Song, and S. Li. 2009. A second-order accurate finite volume method for the computation of electrical conditions inside a wire-plate electrostatic precipitator on unstructured meshes. J. Electrostat. 67 (4):597–604. doi: 10.1016/j.elstat.2008.12.006.
- Long, Z., and Q. Yao. 2010. Evaluation of various particle charging models for simulating particle dynamics in electrostatic precipitators. J. Aerosol Sci. 41 (7):702–718. doi: 10.1016/j.jaerosci.2010.04.005.
- Martins, V., T. Moreno, M. C. Minguillón, B. L. van Drooge, C. Reche, F. Amato, E. de Miguel, M. Capdevila, S. Centelles, and X. Querol. 2016. Origin of inorganic and organic components of PM2.5 in subway stations of Barcelona, Spain. Environ. Pollut. 208:125–136. doi: 10.1016/j.envpol.2015.07.004.
- McDonald, J. R., W. B. Smith, H. W. Spencer III, and L. E. Sparks. 1977. A mathematical model for calculating electrical conditions in wire-duct electrostatic precipitation devices. J. Appl. Phys. 48 (6):2231–2243. doi: 10.1063/1.324034.
- Moreno, T., F. J. Kelly, C. Dunster, A. Oliete, V. Martins, C. Reche, M. C. Minguillón, F. Amato, M. Capdevila, E. de Miguel, and X. Querol. 2017. Oxidative potential of subway PM2.5. Atmos. Environ. 148:230–238. doi: 10.1016/j.atmosenv.2016.10.045.
- Musgrove, G. O., K. A. Thole, E. Grover, and J. Barker. 2012. Performance measurements of a unique louver particle separator for gas turbine engines. J. Eng. Gas Turbine Power. 135 (1):012001. doi: 10.1115/1.4007568.
- Park, J. H., H. Y. Woo, and J. C. Park. 2014. Major factors affecting the aerosol particulate concentration in the underground stations. Indoor Built Environ. 23 (5):629–639. doi: 10.1177/1420326X12466875.
- Parker, K. R. 1997. Applied electrostatic precipitation. 1st ed. New York: Springer.
- Pfeifer, G. D., R. M. Harrison, and D. R. Lynam. 1999. Personal exposures to airborne metals in London taxi drivers and office workers in 1995 and 1996. Sci. Total Environ. 235 (1–3):253–260.
- Podliński, J., J. Dekowski, J. Mizeraczyk, D. Brocilo, and J. S. Chang. 2006. Electrohydrodynamic gas flow in a positive polarity wire-plate electrostatic precipitator and the related dust particle collection efficiency. J. Electrostat. 64 (3–4):259–262. doi: 10.1016/j.elstat.2005.06.006.
- Podliński, J., A. Niewulis, and J. Mizeraczyk. 2009. Electrohydrodynamic flow and particle collection efficiency of a spike-plate type electrostatic precipitator. J. Electrostat. 67 (2–3):99–104. doi: 10.1016/j.elstat.2009.02.009.
- Querol, X., T. Moreno, A. Karanasiou, C. Reche, A. Alastuey, M. Viana, O. Font, J. Gil, E. de Miguel, and M. Capdevila. 2012. Variability of levels and composition of PM10 and PM2.5 in the Barcelona metro system. Atmos. Chem. Phys. 12 (11):5055–5076. doi: 10.5194/acp-12-5055-2012.
- Salma, I., T. Weidinger, and W. Maenhaut. 2007. Time-resolved mass concentration, composition and sources of aerosol particles in a metropolitan underground railway station. Atmos. Environ. 41 (37):8391–8405. doi: 10.1016/j.atmosenv.2007.06.017.
- Sim, J. B., S. H. Woo, W. G. Kim, S. J. Yook, J. B. Kim, G. N. Bae, and H. H. Yoon. 2017. Performance estimation of a louver dust collector attached to the bottom of a subway train running in a tunnel. Aerosol Air Qual. Res. 17 (8):1954–1962. doi: 10.4209/aaqr.2017.01.0043.
- Son, Y. S., T. V. Dinh, S. G. Chung, J. H. Lee, and J. C. Kim. 2014. Removal of particulate matter emitted from a subway tunnel using magnetic filters. Environ. Sci. Technol. 48 (5):2870–2876. doi: 10.1021/es404502x.
- Talaie, M. R. 2005. Mathematical modeling of wire-duct single-stage electrostatic Precipitators. J. Hazard. Mater. 124 (1–3):44–52.
- Tokarek, S., and A. Bernis. 2006. An example of particle concentration reduction in Parisian subway stations by electrostatic precipitation. Environ. Technol. 27 (11):1279–1287.
- Woo, S. H., J. B. Kim, G. N. Bae, M. S. Hwang, G. H. Tahk, H. H. Yoon, and S. J. Yook. 2018. Investigation of diurnal pattern of generation and resuspension of particles induced by moving subway trains in an underground tunnel. Aerosol Air Qual. Res. 18 (9):2240–2252. doi: 10.4209/aaqr.2017.11.0444.
- Zhao, L., and K. Adamiak. 2008. Numerical simulation of the electrohydrodynamic flow in a single wire-plate electrostatic precipitator. IEEE Trans. Ind. Appl. 44 (3):683–691. doi: 10.1109/TIA.2008.921453.
- Zhu, J., Y. Shi, X. Zhang, H. Yan, and K. Yan. 2009. Current density and efficiency of a novel lab ESP for fine particles collection. Electrostatic precipitation. Berlin: Springer, p. 65–72.