
 ?Mathematical formulae have been encoded as MathML and are displayed in this HTML version using MathJax in order to improve their display. Uncheck the box to turn MathJax off. This feature requires Javascript. Click on a formula to zoom.
Abstract
Photocatalytic cement containing nano-TiO2 has been introduced to the construction industry because of its biocidal and self-cleaning properties. Although, TiO2 is classified as possibly carcinogenic to humans, the cancer risk among cement workers is currently unknown. This is partly because an assessment of exposures to airborne photocatalytic cement is missing. We characterized airborne photocatalytic cement in an experimental aerosolization set-up and compared it to regular cement. Aerosolized nanoparticle size distributions and concentrations were measured with a scanning mobility particle sizer (SMPS) and a portable aerosol spectrometer (PAS). Particle morphology was analyzed with a scanning electron microscopy (SEM) and transmission electron microscopy (TEM). Energy dispersive X-ray analysis (SEM-EDX) was used for elemental determination. The aerosolized photocatalytic cement powder contained 5% nanosized particles in number concentration while regular cement had only a negligible amount. Airborne photocatalytic cement concentration was 14,900 particles per cubic centimeter (pt/cm3) with a geometric mean diameter (GMD) of 249 nm (geometric standard deviation; GSD ±2 nm). Airborne regular cement concentration and GMD (GSD) were 9,700 pt/cm3 and 417 nm (±2 nm), respectively. Photocatalytic cement contained 18.5 times more airborne nano-TiO2 (37%) compare to bagged powder (2%). Aerosolized photocatalytic cement had a significantly smaller particle size distribution and greater particle concentration compared to regular cement. Both types of cement had 99% of the particles with sizes less than 1 m. Nano-TiO2 was directly aerosolized from the cement, followed with a coagulation/agglomeration process. Future studies should evaluate workers’ exposures associated with the use of photocatalytic cement.
Copyright © 2019 American Association for Aerosol Research
1. Introduction
Nanotechnology concerns matter at the nanoscale ranging between 1 and 100 nm, and has led to the production of new materials, devices, and structures (ISO/TS 27687 Citation2008; OSHA Citation1999; Mann Citation2006; OSHA Citation2013). In the construction industry, a new generation of “green” or “photocatalytic cement” has evolved over the past decade. These cements contain nanoscale titanium dioxide (nano-TiO2), which act as a radical-forming catalyst in the presence of oxygen. Radicals do not only react with bacteria, fungi, and other microorganisms, but also with air pollutants, deposited volatile organic compounds and soot. They thereby act as biocides rendering surfaces as “self-cleaning” (Carp, Huisman, and Reller Citation2004; Chen and Poon Citation2009; Lan, Lu, and Ren Citation2013). The world-wide cement consumption was 158 million metric tons in 2013 (PCA Citation2013). An estimated 319,300 employees or 8% of the Swiss workforce work in the Swiss construction industry (FSO Citation2017). The amount of photocatalytic cement consumed is not known nor is the number of workers using this new type of cement.
TiO2 was classified by the International Agency for Research on Cancer (IARC) in 2006 as “possibly carcinogenic to humans” (Group 2B). The inadequate evidence of carcinogenicity in humans (WHO Citation2010; IARC Citation2017), came partially from the lack of exposure assessment in the epidemiological studies (Baan Citation2007). No data were available for the IARC Monograph working group regarding the characterization or quantification of exposure to ultrafine (<100 nm) TiO2 particles.
Nano-TiO2 exposures depend on the particles’ physical and chemical properties, working conditions, frequency of use, task duration, and air concentration. The latter will depend on the particles size. The amount of inhaled nano-TiO2 will depend on the particle size distribution. Particles >10 µm will impact in the upper respiratory region or be carried out by the mucociliar escalator; while particles between 1000 and 10,000 µm will diffuse into the alveoli (Tedja et al. Citation2011; Sha et al. Citation2015). Nano-TiO2 particles have been shown to accumulate in the lungs’ interstitial tissue, especially in the alveoli, and translocate into the blood circulation where they are transported to different target organs (lymph nodes, kidney, liver, heart, and brain; Wang et al. Citation2008; Kreyling, Hirn, and Schleh Citation2010; Geiser and Kreyling Citation2010; Gaté et al. Citation2017).
About 2% by weight nano-TiO2 is added to regular cement to make photocatalytic cement. We calculated the percentage from the SEM-EDX analysis, as this information is not publicly available. These nano-TiO2 particles are not chemically bound to the cement. Nanoparticles are in general easily airborne but can also agglomerate/aggregate to larger particles depending on their intrinsic physical and chemical properties. This is needed to develop protective measures for workers using photocatalytic cement.
Our aim was to characterize airborne photocatalytic and regular cement by determining size distribution, concentration, morphology, and elemental composition using an aerosolizing system previously described by Ding and Riediker (Citation2015, Citation2016). Special attention was given to particles in the nano-range both in the obtained cement powders as well as for the airborne fraction.
2. Material and methods
We compared two types of cement: regular Portland cement type I (cement-clinker; CE number 266-043-4) produced in Switzerland, and photocatalytic cement obtained from Italcementi group. We verified that both cements had similar stochiometric compositions apart from TiO2 content measured with SEM-EDX. The cement powders were aerosolized using an aerosolizing system described earlier (Ding and Riediker Citation2015) following the experimental procedures described in Ding and Riediker (Citation2016). Briefly, dry air was blown upwards through a glass funnel containing cement powder (2 g). This aerosolized the powder in the bottom of the funnel where the airflow was turbulent (). The aerosolized particles were then diluted with air, adjusted for temperature and humidity, and led into the measurement chamber. The experiments were repeated three times. The size distribution was measured as soon as the aerosolizing system reached stable particle concentration readings.
Figure 1. Schematic of the experimental set-up. Cement powder was deposited in the glass funnel and the dry air suspends the particles in the air and moves the fine particle fraction to the mixing and measurement chambers. The analytical instruments used are listed on the right.
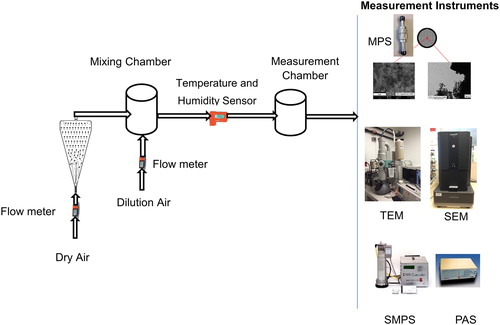
Nanoparticle size distributions and concentrations were measured with a scanning mobility particle sizer (SMPS; SMPS + C model 5400, Grimm Aerosol Technik GmbH & Co. KG, Ainring, Germany), configured to measure particle sizes ranging from 11 to 1,083 nm. The SMPS charges the particles that the mobility analyzer classifies by polarity according to their electrical mobility; and lastly, the particle counter determines the number concentration of the mobility-classified particles. A portable aerosol spectrometer (PAS; model 1.109, Grimm Aerosol Technik GmbH & Co. KG, Ainring, Germany) was used to measure concentrations of fine particles from 250 to 32,000 nm. The PAS measures the intensity of light scattered from aerosol particles through a focused light, and the amount of incident scattered light is a function of particle size. The PAS measures particle number concentrations in 31 bins from 250 to 32,000 nm and calculates mass concentrations in three particle size fractions (PM1, PM2.5, and PM10). For particle morphology determination, the aerosol particles were collected onto transmission electron microscopy (TEM) grids (Quantifoil R1/4, Quantifoil Micro Tools GmbH, Germany) using a mini particle sampler (MPS, flowrate 0.3 L/min) (Ecomesure, Sacly, France). TEM-grid sampling was stopped when the cumulative collected number concentration measured by SMPS was around 106 particles. The TEM grids were analyzed by a scanning electron microscope (SEM) (PHENOM XL BSE detector at 15 kV) and a transmission electron microscope (TEM) (TEM CM-100 [JEOL] at 80 kV) for morphology; and by energy dispersive X-ray spectroscopy (SEM-EDX) for elemental composition. In addition, a sample of the cement powders as they existed in the cement bag (“bagged powder”) was obtained and analyzed chemically as well as morphologically.
Statistical analyses were performed using STATA15. Size difference and concentration difference were compared using two sampled t-test.
3. Results
3.1. Nanoparticle size number distribution and number concentration
The SMPS showed the photocatalytic cement mean concentration to be 14,900 pt/cm3 and 9700 pt/cm3 for regular cement. Photocatalytic cement had a geometric mean diameter (GMD) of 249 nm and a geometric standard deviation (GSD) of 2 nm, while regular cement had a GMD of 417 nm (GSD 2 nm). The particle size distribution and concentration for aerosolized photocatalytic and regular cement are shown in . Between 11 and 545 nm (11 and 1,083 nm SMPS range) (x-axis), the photocatalytic cement had a greater nanoparticle number concentration (y-axis) than regular cement. Maximum particle number concentration was 12,700 pt/cm3 for photocatalytic cement particles in the range 214.4 ∼ 241.0 while regular cement had two maximum concentrations: 7,250 and 7,150 pt/cm3 at 271.8 and 692.1 nm, respectively.
Figure 2. Particle number size distribution for photocatalytic and regular cement the size distribution information obtained by SMPS and PAS. SMPS measure the nanoparticles size range from 11 to 1,083 nm, while PAS measure fine particle from 250 to 32,000 nm.
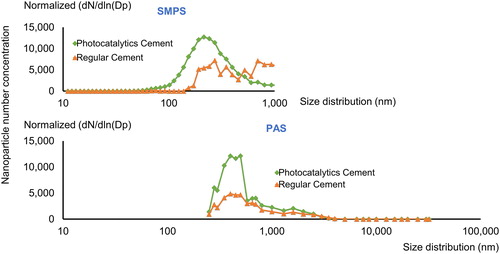
Particle number size distributions were measured with two different instruments: SMPS (11–1,083 nm) and PAS (250–32,000 nm). For simplicity and because the SMPS is more accurate in the nanoparticle region, we used the SMPS results in the overlapping nanoparticle size region (250–1,083 nm) when we combined the results from the two instruments. We used the SMPS results up to 1,083 nm and PAS results from this size to 32,000 nm. shows the particle size distributions of photocatalytic and regular cement measured by SMPS and PAS. shows particle number and mass concentration for photocatalytic and regular cement. The photocatalytic cement size distribution had a mean number concentration of 16,710 pt/cm3 with a GMD of 412 nm and a GSD of 2 nm (). The regular cement mean was 11,700 pt/cm3 with a GMD of 599 nm and a GSD of 2 nm (). The nanoparticle size for the photocatalytic cement was significantly smaller than for regular cement (two-sample t-test, p-value < 0.0005). Furthermore, the particle number concentration for photocatalytic cement was significantly greater than for regular cement particles (p-value < 0.0005).
Table 1. Particle number and mass concentration measured for photocatalytic and regular cement from triplicate experiments.
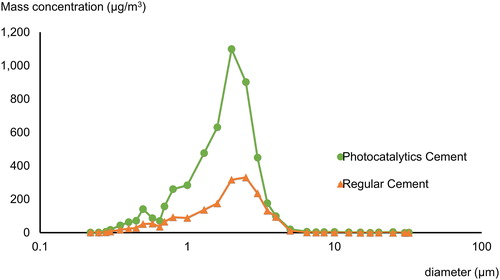
Photocatalytic cement had about 4.7% of the aerosolized particles in the nanoscale, while regular cement only had 1/10th of this (0.4%). Both cement types had over 90 percent of the particle count in the size range less than 1 µm. The mass concentration measured by PAS showed more airborne mass for photocatalytic cement (5,130 µg/m3, SD = 0.3), compared to regular cement (1,916 µg/m3, SD = 0.1) as shown in .
shows the mass-size distribution for both cement types. Photocatalytic cement had a maximum value at 2.0 µm and regular cement at 2.5 µm.
Figure 3. Mass-size distribution of photocatalytic cement and regular cement measured with PAS.
3.2. Elemental composition analysis
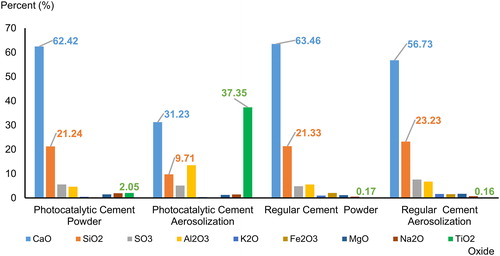
Elemental composition of the bagged powder and their airborne particles collected onto filters after aerosolization were determined by SEM-EDX analysis. As expected, calcium oxide (CaO) was the most abundant material by mass followed by silicon dioxide (SiO2), as shown in . Aerosolized particles from regular cement showed a similar elemental distribution as the material powder. There were however, clear differences in relative mass percentage between the cement types. The relative mass from CaO in photocatalytic cement powder was 62.4%, while this only made up 31.2% in the aerosolized form. The relative contribution of TiO2 showed the opposite pattern with 2.0% in the raw material and 37.4% in the aerosolized particles.
Figure 4. Elemental composition analysis (SEM-EDX) given in percent for each substance contained in regular and photocatalytic cements, both in powder and aerosol forms.
3.3. Morphology study
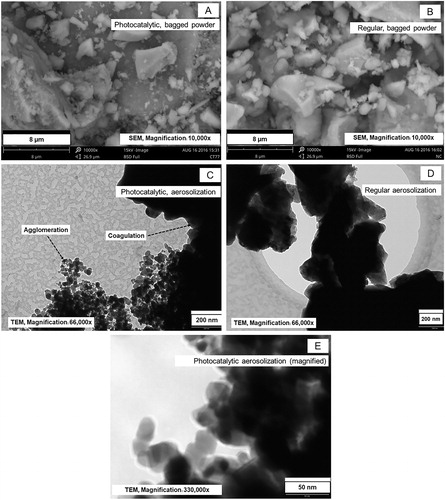
Analysis by SEM and TEM found similar morphology for photocatalytic and regular cement bagged powder (). Particles collected onto filters after aerosolization, however, differed considerably depending on cement type: photocatalytic cement showed a much greater number of small particles than regular cement. The TEM images also suggest that photocatalytic cement consisted of two distinct particle types that differed in morphology and in size (c.a. 50 nm and >200 nm, respectively () magnification with focus on particles of around 50 nm size). The regular cement contained only coarse particles (). The presence of nano-ranged spherical particles that was only found in the photocatalytic cement might possibly be attributed to nano-TiO2 ().
Figure 5. Schematic of SEM and TEM images of photocatalytic and regular cement.
4. Discussion
Aerosolized photocatalytic cement had a greater concentration of nanoscale particles compared to aerosolized regular cement. The morphology results confirmed that (a) the photocatalytic cement contained nanoparticles and (b) TiO2 is a constituent of the photocatalytic cement aerosol. Taken together, this suggests that nano-TiO2 can be easily mobilized from photocatalytic cement powder when aerosolized. This can be expected if the nano-TiO2 particles are not chemically bound to the larger cement particles.
It is important to note that the TiO2 content in photocatalytic bagged cement powder was only 2% while reaching 37% in the aerosolized form. In stable conditions, the aerosolized photocatalytic cement contained about 5% of airborne nanoparticle numbers, presumably TiO2. It is likely that a part of the airborne nano-TiO2 was present in the form of agglomerates as seen previously by (Ding and Riediker Citation2015); however, we did not verify this in our experiments. Since cement particles were only 5% of the nanosized particles, this would not be sufficient to contribute 37% of aerosolized mass. We suggest that these were attachment to larger sized cement particles which was suggested by the morphological examination ().
The size distribution curve obtained for the regular cement showed an unusual discontinuous profile for particles larger than 200 nm. A non-ideal behavior could be due to limitations in the multiple-charge correction (MCC) algorithm applied to the aerosol sample data in the SMPS measurements. For large and anisometric particles, the relationship between the aerodynamic and the electrical mobility diameters typically makes the algorithm approximations inaccurate (He and Dhaniyala Citation2013). The SMPS data obtained without MCC treatment confirmed this hypothesis showing a smooth size distribution profile for the larger particle range (Figure S1) in regular cement. However, the comparative analysis of both regular and photocatalytic cement in the absence of MCC showed qualitatively similar trend, the mean concentration for the photocatalytic cement being greater than for regular cement. The MCC algorithms for these types of particles should be developed in the future.
Exposure to regular cement is associated with lung function decline at elevated exposures (Nordby et al. Citation2016). The majority of the particle material found in both regular and photocatalytic cement was CaO. Inhaled CaO dust can cause inflammation in the upper respiratory tract due to its alkalinity (Toxicology data network (TOXNET) Citation2014). The second most abundant particle material was silica (SiO2). Exposure to crystalline silica can lead to health effects such as silicosis, tuberculosis, chronic bronchitis, COPD and lung cancer (IARC Citation1997; Merget et al. Citation2002; Kaewamatawong et al. Citation2005; Napierska et al. Citation2010). Amorphous silica is associated with reversible inflammation, granuloma formation and emphysema (McLaughlin, Chow, and Levy Citation1997; Merget et al. Citation2002; Kaewamatawong et al. Citation2005). Cement dust as such has been associated with impaired lung function, inflammation, bronchitis, chronic obstructive pulmonary disease, restrictive lung disease, and pneumoconiosis (Maciejewska and Bielichowska-Cybula Citation1991; Meo Citation2004; Penrose Citation2014; Eom et al. Citation2017). None of these toxicological assessments were made with nano-sized particles. We therefore concluded that exposures to these nano-sized particles could lead to unexplained effects on human health, and consequently, safety and environmental burden should not be neglected (Oberdörster, Oberdörster, and Oberdörster Citation2005; Maynard et al. Citation2006). The inhalation pathway is considered the major route of nanoparticle exposure, and the lungs and pleura are the major primary targets for adverse effects (Oberdörster, Oberdörster, and Oberdörster Citation2005; Donaldson and Poland Citation2012). It is difficult to say how nano-TiO2 might change health hazards already associated with cement exposure, but this should be considered when assessing exposure risks among cement workers.
We have shown that the particle size distribution for photocatalytic cement contain more particle in the smaller size range (<1 µm) () and have a greater mass concentration () than regular cement. In order to provide a safe working environment, the industry should develop risk management strategies (Friedrichs and Schulte Citation2007; Hämeri et al. Citation2009). We suggest that the amount of nanoparticles added to the product should be publicly available, and that the risk management strategies should account for the readily airborne nanoparticles.
A number of instruments are available to measure particle distribution as well as physical and chemical properties of airborne nanoparticles. Real time instruments provide information on the metrics under study; however, they are generally unable to differentiate between types of nanoparticles. We used SMPS and PAS in our experiments. These are complementary as they measure somewhat different particle size ranges; however, they both lack specificity. We used the morphology results to verify that the aerosolized nanoparticles were indeed TiO2 in our experiments.
Understanding the relationship between airborne nano-sized particles and exposure is of great importance for developing efficient control measures. Our experiments are a step in this process; understanding the aerosolized part of bagged powder. We found that aerosolized photocatalytic cement contained 5% nanoparticles compared to the 2% added to the bagged powder. We therefore conclude that we cannot assume the nanoparticles distribution to be the same in aerosolized as in the bagged powder.
The protection measures needed when working with photocatalytic cement should be similar to recommendations made for nano-TiO2 exposures.Engineering control is preferred such as closed process chambers installed with high-efficiency particulate air (HEPA) filters (Goede et al. Citation2018). Indeed, most large construction sites have the cement already mixed with water in Switzerland thereby controlling for dust exposure. Other activities where workers may be especially exposed to nanoscale particles are during bagging and cleaning operations (Plitzko Citation2009; Fonseca et al. Citation2015) (associated with dry cement). When work operations cannot be enclosed, it is necessary to implement control measures to mitigate worker exposures. Occupational hygiene strategies should be implemented to reduce exposure to the dry cement (NIOSH Citation2011; NIOSH Citation2012; NIOSH Citation2013; OSHA Citation2013). Use of personal respiratory protection (PRP) is of last resort. Current PRP recommendations for working with nanoparticles are for the US: N100, R100, and P100 (OSHA Citation2011; NIOSH Citation2014) and Europe (EN 143 EN 149): Class P3 filtering face pieces (FFP3) (Rengasamy, Eimer, and Shaffer Citation2009; Goede et al. Citation2018).
In conclusion, we were able to show that in experimental conditions the photocatalytic cement had significantly smaller particle size distribution than the regular cement; and the cement particle concentration was significantly greater for the photocatalytic compared to regular cement. Ninetynine percent of the particles were <1 m for both cement types. Nano-TiO2 can be directly aerosolized from the cement, and a coagulation process is likely followed. Future studies should evaluate exposures associated with the use of photocatalytic cement by construction workers.
Supplemental data for this article is available online at on the publisher's website.
Download Zip (149.7 KB)Acknowledgments
We greatly appreciate help from Dr. Nicolas Concha Lozano for the morphology analysis and Ms. Nicole Charrier for all practical laboratory assistance. We thank the Italcementi Group for sending us a free sample. Parts of M.R.’s work were performed while he was at IOM (Institute of Occupational Medicine) Singapore.
Additional information
Funding
Related Research Data
References
- Baan, R. A. 2007. Carcinogenic hazards from inhaled carbon black, titanium dioxide, and talc not containing asbestos or asbestiform fibers: recent evaluations by an IARC monographs working group. Inhal. Toxicol. 19 (suppl 1):213–228. doi:10.1080/08958370701497903.
- Carp, O., C. L. Huisman, and A. Reller. 2004. Photoinduced reactivity of titanium dioxide. Prog. Solid State Chem. 32 (1–2):33–177. doi:10.1016/j.progsolidstchem.2004.08.001.
- Chen, J., and C.-S. Poon. 2009. Photocatalytic construction and building materials: from fundamentals to applications. Build. Environ. 44 (9):1899–1906. doi:10.1016/j.buildenv.2009.01.002.
- Ding, Y., and M. Riediker. 2015. A system to assess the stability of airborne nanoparticle agglomerates under aerodynamic shear. J. Aerosol Sci. 88:98–108. doi:10.1016/j.jaerosci.2015.06.001.
- Ding, Y., and M. Riediker. 2016. A system to create stable nanoparticle aerosols from nanopowders. JoVE 113 (July):e54414–e54414. doi:10.3791/54414.
- Donaldson, K., and C. A. Poland. 2012. Inhaled nanoparticles and lung cancer—What we can learn from conventional particle toxicology. Swiss Medical Weekly 142 (2526). doi:10.4414/smw.2012.13547.
- Eom, S.-Y., E.-B. Cho, M.-K. Oh, S.-S. Kweon, H.-S. Nam, Y.-D. Kim, and H. Kim. 2017. Increased incidence of respiratory tract cancers in people living near Portland cement plants in Korea. Int. Arch. Occup. Environ. Health 90 (8):859–864. doi:10.1007/s00420-017-1244-9.
- Fonseca, A. S., A.-K. Viitanen, A. J. Koivisto, A. Kangas, M. Huhtiniemi, T. Hussein, E. Vanhala, M. Viana, X. Querol, and K. Hämeri. 2015. Characterization of exposure to carbon nanotubes in an industrial setting. Ann. Occup. Hyg. 59 (5):586–599. doi:10.1093/annhyg/meu110.
- Friedrichs, S., and J. Schulte. 2007. Environmental, Health and safety aspects of nanotechnology—Implications for the R&D in (Small) companies. Sci. Technol. Adv. Mater. 8 (1):12–18.
- FSO 2017. Full-Time Job Equivalent per Sector, Switzerland. Federal Statistical Office, Swiss Confederation. https://www.bfs.admin.ch/bfs/en/home/statistics/industry-services/businesses-employment/jobs-statistics/jobs.assetdetail.3243521.html.
- Gaté, L., C. Disdier, F. Cosnier, F. Gagnaire, J. Devoy, W. Saba, E. Brun, M. Chalansonnet, and A. Mabondzo. 2017. Biopersistence and translocation to extrapulmonary organs of titanium dioxide nanoparticles after subacute inhalation exposure to aerosol in adult and elderly rats. Toxicol. Lett. 265:61–69. doi:10.1016/j.toxlet.2016.11.009.
- Geiser, M., and W. G. Kreyling. 2010. Deposition and biokinetics of inhaled nanoparticles. Particle Fibre Toxicol. 7 (1):2. doi:10.1186/1743-8977-7-2.
- Goede, H., Y. Christopher-de Vries, E. Kuijpers, and W. Fransman. 2018. A review of workplace risk management measures for nanomaterials to mitigate inhalation and dermal exposure. Ann. Work Exposures Health. doi:10.1093/annweh/wxy032.
- Hämeri, K., T. Lähde, T. Hussein, J. Koivisto, and K. Savolainen. 2009. Facing the key workplace challenge: assessing and preventing exposure to nanoparticles at source. Inhal. Toxicol. 21 (suppl 1):17–24. doi:10.1080/08958370902942525.
- He, M., and S. Dhaniyala. 2013. A multiple charging correction algorithm for scanning electrical mobility spectrometer data. J. Aerosol Sci. 61:13–26. doi:10.1016/j.jaerosci.2013.03.007.
- IARC. 1997. IARC monographs on the evaluation of carcinogenic risk to human silica. Some silicates, coal dust and para-aramid fibrils, vol. 68. Lyon: World Health Organization, International Agency for Research on Cancer. http://monographs.iarc.fr/ENG/Monographs/vol68/.
- IARC 2017. IARC monographs on the evaluation of carcinogenic risk to human. List of classification, vol. 1–120. Lyon: World Health Organization, International Agency for Research on Cancer. http://monographs.iarc.fr/ENG/Classification/latest_classif.php.
- ISO/TS 27687. 2008. ISO/TS 27687: nanotechnologies. Geneva: International Organization for Standardization. https://www.iso.org/obp/ui/#iso:std:iso:ts:27687:ed-1:v2:en.
- Kaewamatawong, T., N. Kawamura, M. Okajima, M. Sawada, T. Morita, and A. Shimada. 2005. Acute pulmonary toxicity caused by exposure to colloidal silica: Particle size dependent pathological changes in mice. Toxicol. Pathol. 33 (7):745–751. doi:10.1080/01926230500416302.
- Kreyling, W. G., S. Hirn, and C. Schleh. 2010. Nanoparticles in the lung. Nat. Biotechnol. 28 (12):1275–1276. doi:10.1038/nbt.1735.
- Lan, Y., Y. Lu, and Z. Ren. 2013. Mini review on photocatalysis of titanium dioxide nanoparticles and their solar applications. Nano Energy 2 (5):1031–1045. doi:10.1016/j.nanoen.2013.04.002.
- Maciejewska, A., and G. Bielichowska-Cybula. 1991. Biological effect of cement dust. Medycyna Pracy 42 (4):281–289.
- Mann, S. 2006. Nanotechnology and construction. Nano forum report. UK: Institute of Nanotechnology. http://nanotech.law.asu.edu/Documents/2009/10/Nanotech%20and%20Construction%20Nanoforum%20report_259_9089.pdf.
- Maynard, A. D., R. J. Aitken, T. Butz, V. Colvin, K. Donaldson, G. Oberdörster, M. A. Philbert., et al. 2006. Safe handling of nanotechnology. Comments and opinion. Nature. doi:10.1038/444267a.
- McLaughlin, J. K., W. H. Chow, and L. S. Levy. 1997. Amorphous silica: A review of health effects from inhalation exposure with particular reference to cancer. J. Toxicol. Environ. Health 50 (6):553–566. doi:10.1080/15287399709532054.
- Meo, S. A. 2004. Health hazards of cement dust. Saudi Med J. 25 (9):1153–1159.
- Merget, R., T. Bauer, H. U. Küpper, S. Philippou, H. D. Bauer, R. Breitstadt, and T. Bruening. 2002. Health hazards due to the inhalation of amorphous silica. Arch. Toxicol. 75 (11–12):625–634.
- Napierska, D., L. C. J. Thomassen, D. Lison, J. A. Martens, and P. H. Hoet. 2010. The nanosilica hazard: Another variable entity. Particle Fibre Toxicol. 7 (1):39. doi:10.1186/1743-8977-7-39.
- NIOSH 2011. Occupational exposure to titanium dioxide. U.S. Department of Health and Human Services, Centers for Disease Control and Prevention, National Institute for Occupational Safety and Health.
- NIOSH 2012. General safe practices for working with engineered nanomaterials in research laboratories. U.S. Department of Health and Human Services, Centers for Disease Control and Prevention, National Institute for Occupational Safety and Health. http://www.cdc.gov/niosh/docs/2012-147/pdfs/2012-147.pdf.
- NIOSH 2013. Current strategies for engineering controls in nanomaterial production and downstream handling processes. U.S. Department of Health and Human Services, Centers for Disease Control and Prevention, National Institute for Occupational Safety and Health. http://www.cdc.gov/niosh/docs/2014-102/pdfs/2014-102.pdf.
- NIOSH 2014. NIOSH guide to the selection and use of particulate respirators, Certified under 42 CFR 84. U.S. Department of Health and Human Services, Centers for Disease Control and Prevention, National Institute for Occupational Safety and Health. http://www.cdc.gov/niosh/docs/96-101/.
- Nordby, K.-C., H. Notø, W. Eduard, M. Skogstad, A. K. Fell, Y. Thomassen, Ø. Skare, A. Bergamaschi, A. Pietroiusti, R. Abderhalden, J. Kongerud, and H. Kjuus. 2016. Thoracic dust exposure is associated with lung function decline in cement production workers. Eur. Respir. J. 48 (2):331–339. doi:10.1183/13993003.02061-2015.
- Oberdörster, G., E. Oberdörster, and J. Oberdörster. 2005. Nanotoxicology: An emerging discipline evolving from studies of ultrafine particles. Environ. Health Persp. 113 (7):823–839. doi:10.1289/ehp.7339.
- OSHA 1999. Nanotechnology safety and health topic. U.S. Department of Labor, Occupational Safety and Health Administration. https://www.osha.gov/dsg/nanotechnology/nanotechnology.html.
- OSHA 2011. Respiratory protection. - 1910.134. U.S. Department of Labor, Occupational Safety and Health Administration. https://www.osha.gov/pls/oshaweb/owadisp.show_document?p_table=STANDARDS&p_id=12716.
- OSHA 2013. Working safely with nanomaterials. U.S. Department of Labour, Occupational Safety and Health Administration. https://www.osha.gov/Publications/OSHA_FS-3634.pdf.
- PCA 2013. World cement consumption. The Portland Cement Association. http://www.cement.org/.
- Penrose, B. 2014. Occupational exposure to cement dust: Changing opinions of a respiratory hazard. Health History 16 (1):25–44.
- Plitzko, S. 2009. Workplace exposure to engineered nanoparticles. Inhal. Toxicol. 21 (sup1):25–29. doi:10.1080/08958370902962317.
- Rengasamy, S., B. C. Eimer, and R. E. Shaffer. 2009. Comparison of nanoparticle filtration performance of NIOSH-approved and CE-marked particulate filtering facepiece respirators. Ann. Occup. Hyg. 53 (2):117–128. doi:10.1093/annhyg/men086.
- Sha, B., W. Gao, X. Cui, L. Wang, and F. Xu. 2015. The potential health challenges of TiO2 nanomaterials. J. Appl. Toxicol. 35 (10):1086–1101. doi:10.1002/jat.3193.
- Tedja, R., C. Marquis, M. Lim, and R. Amal. 2011. Biological impacts of TiO2 on human lung cell lines A549 and H1299: particle size distribution effects. J. Nanoparticle Res. 13 (9):3801–3813. doi:10.1007/s11051-011-0302-6.
- Toxicology Data Network (TOXNET). 2014. Calcium oxide. Toxicology Data Network, U.S. National Library of Medicine. https://toxnet.nlm.nih.gov/cgi-bin/sis/search2/r?dbs+hsdb:@term+@DOCNO+1615.
- Wang, J., C. Chen, Y. Liu, F. Jiao, W. Li, F. Lao, Y. Li, B. Li, C. Ge, and G. Zhou. 2008. Potential neurological lesion after nasal instillation of TiO2 nanoparticles in the anatase and rutile crystal phases. Toxicol. Lett. 183 (1-3):72–80. doi:10.1016/j.toxlet.2008.10.001.
- WHO 2010. IARC monographs on the evaluation of carcinogenic risks to humans: Carbon black, Titanium dioxide, and talc. Vol.93. World Health Organization, International Agency for Research on Cancer. http://monographs.iarc.fr/ENG/Monographs/vol93/mono93.pdf.