
 ?Mathematical formulae have been encoded as MathML and are displayed in this HTML version using MathJax in order to improve their display. Uncheck the box to turn MathJax off. This feature requires Javascript. Click on a formula to zoom.
Abstract
Hard coatings for wear protection of tools, bearings, and sliding parts play an important role in industrial manufacturing. Nanocomposite coatings are being used in this context to improve the mechanical properties. The technology applied therefore is often based on physical vapor deposition (PVD), in which the different materials are co-deposited. In these processes it is not possible to control the properties of the disperse phase and continuous phase independently. Here, we present a technology which combines aerosol technology with thin film technology to produce nanocomposite coatings directly, which gives us full control over both phases. It is based on an upscaled three-stage aerodynamic lens, which allows to bring nanoparticles from an atmospheric-pressure aerosol reactor into a PVD vacuum chamber operating at low pressure (2 Pa). This requires the use of a higher mass flow rate than conventionally used in aerodynamic lenses, so that a rational upscaling strategy for designing an aerodynamic lens for larger mass flow rates is proposed. Here, an array consisting of eight parallel three-stage aerodynamic lenses having each a mass flow rate of 0.6 slm using argon and 0.71 slm using nitrogen is built and optimized, assisted by CFD and numerical trajectory analysis. The transfer efficiency has been investigated numerically and experimentally. It is possible to transfer 80% of the particles with only 1.3% of the gas into the deposition chamber. A number of coatings consisting of titanium carbonitride nanoparticles embedded in a PVD chromium oxynitride film with varying nanoparticle content were produced. Electron microscopy shows the successful incorporation of the nanoparticles in the thin film. A reduction in film crystallite size with increasing nanoparticle content was found. A reverse Hall–Petch behavior was observed.
Copyright © 2019 American Association for Aerosol Research
1. Introduction
Since the 1960s hard coatings deposited by PVD methods are investigated (Hoornaert, Hua, and Zhang Citation2010). In industrial processes and applications they are used where high wear resistance is necessary, like machining tools, casting dyes, or engine bearings (Rodrı́guez et al. Citation2004). During the last decade’s research for improved coatings was focused upon optimizing multilayer or gradient microstructures (Gulbiński et al. Citation2005a). Present research is trying to optimize even finer structures in the nanometer range, because materials with extreme mechanical properties are expected (Leyland and Matthews Citation2000). A process well suited to obtain nanostructured and nanolayered coatings is plasma-assisted vacuum processing (Leyland and Matthews Citation2000).
Experimental results reported in the scientific literature so far indicate that enhanced mechanical, tribological, anti-corrosion, and anti-oxidation properties can be realized by nanostructured composite coatings in comparison to microstructured or bulk coatings (Zhou, Zhang, and Qian Citation2007). Their nanostructured composite coatings have been prepared by electrodeposition of the main coating material nickel and an incorporation of silicon carbide nanoparticles as co-deposited second phase. Zhou, Zhang, and Qian (Citation2007) found that the parameters which influence these improved properties are mainly the size, the percentage and the distribution homogeneity of the co-deposited particles. In general, any two-phase material where the crystallite grains have sharp interfaces and the alloy materials have a large difference in their shear modulus exhibit an increased hardness (Hauert and Patscheider Citation2000; Mitterer, Mayrhofer, and Musil Citation2003). The hardening effect in dispersion coatings depends also on particle interspace. Beneficial are particles with 10–50 nm diameter and about 100 nm interspace, the volumetric content should be between 1% and 15% (Repenning Citation2004).
The hardness (H) of a coating alone is not sufficient to describe its performance as wear resistance coating. A better suited parameter suggested by Leyland and Matthews (Citation2000) is the elastic strain to failure. It is related to the ratio of hardness (H) and elastic modulus (E). In contrast to the current research that has tried improve wear resistance by using coatings with an ultra-high hardness, and thus usually a high elastic modulus, Leyland and Matthews propose the use of nanocomposite coatings, which allow to combine high hardness and a low elastic modulus. Especially for the case that the substrate material has a low elastic modulus like steels and light alloys, they expect that these coatings exhibit improved toughness and thus wear resistance. Furthermore, a matching of the elastic moduli for both materials is expected to be beneficial.
Nanocomposites can also be formed directly in a physical vapor deposition (PVD) process used for this work. When an additional material is added into a PVD process during the deposition, two different cases can happen: the additional material can either be incorporated in the existing phase and a new single phase coating is produced, or it forms its own phase and co-deposits as a second phase. If the atomic structures of the two phases differ substantially, a two phase material is formed (Abu Shgair Citation2002). Both the deposition parameter and the materials influence the formation of one or more phases (Jehn Citation2000), the crystallite size and content is however difficult to control independently. As an example, modifying the process conditions lead to simultaneous change of the carbon content and crystallite size in TiC nanocrystals in an amorphous carbon matrix (Gulbiński et al. Citation2005b). However, more control could have been obtained when manipulating carbon content and crystallite size separately. Aerosol reactors have been widely used to produce nanoparticles with small and variable crystallite sizes. As an example, titanium nitride, carbide, and carbonitride nanoparticles are easily produced using reactive anodic arc evaporation from solid titanium (Kiesler et al. 2015). However, the required process pressure for particle formation, which is usually atmospheric or slightly sub-atmospheric, is not compatible with the process pressure required for PVD processes.
Therefore, a technology is required which allows the simultaneous deposition of a PVD film and nanoparticles so that composite films containing nanoparticles having tunable sizes as well as volumetric concentrations are obtained. This asks for a transfer of the nanoparticles synthesized in an atmospheric pressure gas into the PVD chamber during the PVD process taking place at low pressure and deposit them on a substrate or product to be coated. One of the challenges is that typical PVD reactors during deposition do not allow an inflow of gas with mass flow rates above 0.1 slm to keep the necessary vacuum of around 1 Pa upright. Atmospheric aerosol generators typically use several slm for their operation, so that a device is needed which increases the particle concentration in the aerosol and allows to separate particles and a major part of the carrier gas effectively. One possibility is to use a virtual impactor, where the particles are accelerated in an expansion nozzle followed by a differentially pumped outlet tube. Due to their high velocity and inertia particles enter the outlet tube, while the major gas flow can be redirected to the side and is pumped away (Lee, Chen, and Pui Citation2003; Middha and Wexler Citation2006). However, the particle beam has a too high divergence angle to be used as inlet into a vacuum chamber as usually the substrate is placed at a considerable distance from the inlet. Nevertheless, its potential to reduce the pumping capacity of PVD reactors remains to be explored.
A more refined method which allows an efficient transfer into a low-pressure region is the aerodynamic lens, proposed by the University of Minnesota (Liu et al. Citation1995a, Citation1995b). It concentrates particles due to their inertia on the axis of a beam generator system by employing a series of axisymmetric flow contractions and enlargements followed by an expansion and a skimmer. In this way, the nanoparticles are separated from the gas molecules by the aerodynamic focusing effect (Fernández de La Mora and Riesco-Chueca Citation1988) prior to the expansion nozzle after which the carrier gas is pumped out in the ensuing vacuum chamber. A typical application of an aerodynamic lens is in the inlet of an aerosol mass spectrometer (AMS), which requires a very low pressure and a tightly collimated particle beam (Liu et al. Citation2007; Su et al. Citation2004; Ziemann et al. Citation1995). Aerodynamic lenses have also been combined with cluster beam deposition (Wegner et al. Citation2006), also with the goal to produce tribological coatings (Piazzoni et al. Citation2015) containing particles only. It has been shown that in principle it is possible to combine a PVD film growth process with a nanoparticle beam stemming from an aerodynamic lens, leading to nanoparticles embedded in a thin film (Kiesler et al. Citation2011; Kiesler et al. Citation2013; Sublemontier, Kintz, and Leconte Citation2013; Sublemontier et al. 2016).
The aerodynamic lenses allow to produce nanoparticles efficiently under ambient or low-pressure conditions, as collisions in the gas phase are necessary to induce particle formation, and then bring them in a vacuum as a collimated beam. It has been extensively tested for particles larger than 30 nm, but the standard arrangement designed for submicrometer particles (0.02–0.5 µm range) leads to a decrease of transfer efficiency for sub-30 nm particles (Nijhawan et al. Citation2003). Another problem is that the standard arrangement optimized for AMS systems having a fairly low mass flow rate of 0.1 slm, whereas most synthesis setups apply higher mass flow rates of several liters of carrier gas so that the residence time and consequently particle size is kept low. A new lens design is needed for the PVD application which allows to handle mass flow rates of several slm.
Different optimizing strategies are possible. The increase in Reynolds number with higher mass flow rates can be limited by using a slit lens design. However, previous work is limited to micron-sized particles (Novosselov and Ariessohn Citation2014) or is purely based on simulations (Goo Citation2002; Middha and Wexler Citation2005). On the other hand, the traditional cylindrical lens system has shown to be suitable for sub 30 nm particles and is more suitable for upscaling, as it is a proven system for which design tools like the Aerodynamic Lens Calculator (Wang and McMurry Citation2006) exist. Therefore, it has been chosen for the work presented here, taking care to keep the Reynolds number low (<200) during upscaling. A prototype of the upscaled cylindrical lens has been built, optimized using CFD simulations and experimentally assessed. An array containing eight of these lenses allows to coat a stack of piston rings by means of simultaneous deposition of a matrix material by means of PVD and hard ceramic nanoparticles introduced from an external aerosol reactor, thereby overcoming the problem of the different process pressure of the aerosol reactor and PVD reactor (1 bar and 2 Pa, respectively). The successful incorporation of nanoparticles into the growing PVD film is demonstrated by means of cross-sectional TEM analysis, and the influence of the nanoparticle content on the mechanical film properties is investigated.
2. Optimal design of a three-stage aerodynamic lens system for focusing 30–70 nm particles with high mass flow rate
The aerodynamic lens setup as suggested by Liu et al. (Citation1995b) consists of three different parts: an inlet orifice, a set of focusing orifices and an acceleration orifice. The inlet orifice is a critical orifice which determines the mass flow rate into the aerodynamic lens. It is followed by a series of thin plate focusing orifices designed to focus particles with a specific Stokes number onto the axis. Usually large particles are focused first due to their smaller Brownian broadening as well as larger tendency to defocus in the subsequent orifices. The last part is the acceleration nozzle which is also designed as critical orifice. This orifice determines the pressure in the lens system and accelerates the focused particles to near sonic velocities. Often a differentially pumped skimmer is attached to the aerodynamic lens to separate the particles from the excess gas.
The optimized aerodynamic lens system is to be connected to a transferred anodic arc synthesis system operating at atmospheric pressure (Kiesler et al. 2015). The particles produced are titanium nitride (TiN, ρp = 5.2 g/cm3), titanium carbide (TiC, ρp = 4.9 g/cm3), as well as titanium carbonitiride (TiNxC1−x) agglomerates consisting of 12–25 nm primary particles with a Stokes diameter of approximately 20–80 nm. The design selected for the optimized aerodynamic lens contains three focusing orifices so that particles with Stokes diameters of 30, 50, and 70 nm are perfectly focused. The geometric parameters were selected on the basis of the Aerodynamic Lens Calculator (Wang and McMurry Citation2006). The synthesis system produces 4.8 slm aerosol, which should be introduced as completely as possible in the optimized lens system, with the carrier gas being argon, nitrogen or a mixture of both. The aerosol beam focused by the lens system will pass a skimmer where most of the carrier gas is separated from the particle beam and is then introduced in a PVD reactor used for hard-coating metallic rings with chromium oxynitride (CrON). The particles are collected in the PVD chamber on a rotating annular substrate 500 mm behind the skimmer, producing a few µm thin film over the full circumference with a width of 10 mm.
2.1. Theory of scaling behavior of a single focusing orifice
As the mass flow rate to be introduced in the lens is much larger than usual (up to 4.8 slm vs. 0.1 slm), it is likely that the orifice properties such as orifice diameter D and operating conditions such as pressure p will have to be modified. We will now study the change in these properties when the mass flow rate Q is increased by a scaling factor N (scaled up mass flow rate: ). Therefore, we study the consequences for a single focusing orifice for the two most important dimensionless parameters, the Reynolds number
and the Stokes number
When scaling up, we do not want to induce turbulence and therefore choose to keep the Reynolds number constant, so that the flow behavior will not be changed. We write the Reynolds number with reference to the standard pressure conditions (
pSTP = 101,325 Pa, TSTP = 273.15 K):
(1)
(1)
with
as gas density,
as gas velocity, and
as gas viscosity. When the mass flow rate is increased by a factor of
keeping the Reynolds number identical, one can easily derive that:
(2)
(2)
with the subscript
referring to the orifice scaled up by a factor of
It can be seen that there is no pressure dependence and that the new diameter to be chosen is
(3)
(3)
when keeping the Reynolds number constant.
The second requirement is that the particle Stokes number should not change, in order not to change the focusing properties of the orifice for a given particle with diameter
density
and relaxation time
Here too, we write the equation for
referring to the standard reference conditions:
(4)
(4)
and include the following equation for the slip correction factor
valid for large Knudsen number in the free molecular limit (Rader Citation1990):
(5)
(5)
with the particle mean free path
and the Cunningham Correction constants
leading to
(6)
(6)
when including all known material constants in one constant
When now scaling-up the mass flow rate with
keeping the Stokes number constant for a given particle diameter, we find
(7)
(7)
and combining this with the result found for the orifice diameter (EquationEquation (3)
(3)
(3) ), one can derive that the pressure
in case of scaling-up has to be reduced with the scaling-up factor:
(8)
(8)
As the pressure has to be effectively reduced, this may lead to problems with the pumping capacity which is required to keep the desired low pressure level. Therefore, we check how the required pumping capacity scales as well. The pumping speed is defined as the mass flow rate needed by the pump (
) to maintain critical conditions at the acceleration nozzle, with
as the pressure before the acceleration nozzle, so that the pressure at the pump is
One can write:
(9)
(9)
so that for the scaled-up system one can derive
(10)
(10)
and finally one finds:
(11)
(11)
Overall, the conclusion of this theoretical scaling study is that the focusing orifice diameter of the aerodynamic lens scales linearly and the required pressure scales inversely proportional with the scaling factor whereas the pumping speed has to be increased quadratically. This last requirement will in most cases limit the maximum possible scaling factor, as the price and size of vacuum pumps strongly increase with the required pumping capacity.
2.2. Scaling-up a three-stage lens system
To validate the predicted scaling effects of increasing mass flow rate through a three-stage lens focusing 30–70 nm, we apply the Aerodynamic Lens Calculator (Wang and McMurry Citation2006). This software has been developed on the basis of a method giving optimal Stokes numbers inside an orifice (Wang, Kruis, and McMurry Citation2005). Starting with the last orifice for the smallest particles and a given pressure after the orifice, one obtains the orifice diameter and the pressure drop so that one can proceed to the orifices in front. We start with a mass flow rate of 0.1 slm, as this is the mass flow rate used in most conventional aerodynamic lenses. Important characteristics of the upscaled lens system are: (1) its physical dimensions, as the space around the PVD reactor is limited, (2) the maximum Reynolds number in one of the orifices, as a too large Reynolds number can deteriorate the lens performance, (3) the particle beam diameter at the for the deposition relevant distance, and (4) the required pumping speed, as this has to be related to the maximum possible pumping capacity of a given vacuum pump.
In , these characteristics can be seen for an increasing gas mass flow rate. The mass flow rate as well as the pressure before the acceleration nozzle and the diameters to be focused are used as input for the Aerodynamic Lens Calculator. The input pressure before the acceleration nozzle is calculated using the formulas given above in order to keep the dimensionless numbers (Reynolds and Stokes number) constant, leading to fluid-dynamically identical systems. As can be seen, the Reynolds number for the optimal system as found by the Aerodynamic Lens Calculator is practically constant in agreement with the theory derived earlier in this section (EquationEquation (2)(2)
(2) ), the difference being due to small rounding errors in the given pressure before the acceleration nozzle. We have chosen the maximum from the three possible Reynolds numbers (as we have three orifices), so that it is possible to ensure a laminar flow in the lens system. In Wang, Kruis, and McMurry (Citation2005), it is stated that the Reynolds number should be kept below 200 for this condition, which is also demonstrated by the experimental study of Johansen (Citation1930). Therefore, with a Reynolds number around 140 we consider that there is no turbulence in the gas flow. With increasing mass flow rate the particle beam diameter at the position of the substrate slightly increases because the beam is less focused at lower pressure due to larger diffusion broadening, but it is still acceptable. The third characteristic however, which is the total system length from inlet orifice up to accelerating nozzle outlet, increases linearly with the increase in mass flow rate, because the required spacer length is a given multiple of the orifice diameter and the orifice diameter is proportional to the mass flow rate (EquationEquation (3)
(3)
(3) ). This would lead to a required lens system length of over 7 m, which is clearly impractical. Moreover, the required pumping speed turns out to be a quadratic function of the mass flow rate as predicted by EquationEquation (11)
(11)
(11) .
Table 1. Characteristics of required three-stage lens system as determined by the Aerodynamic Lens Calculator (Wang and McMurry Citation2006) for different gas (argon) mass flow rates.
From this, we conclude that there is a practical limit to the increase in mass flow rate of a single lens system. The usage of multiple low mass flow rate lenses in a parallel array shows a better scaling behavior to achieve the same total flow because the required pumping speed is proportional to the number of used lenses. With a given maximum system length of 1 m and a pumping speed of 600 m3/h, an optimal gas mass flow rate for this particle system seems to be around 0.5 slm, which is a scaling-up factor of 5. A total aerosol mass flow rate of 4.0 slm is then reached when 8 of these 0.5 slm lenses having a length of 0.81 m are placed in a parallel array, requiring a pumping speed of 8 × 31 = 248 m3/h.
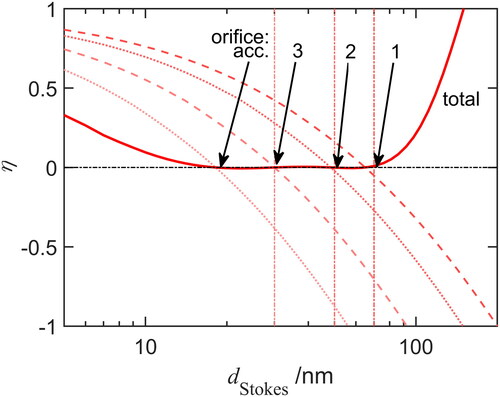
Using the selected multiple-lens system, we can now evaluate the focusing property of the system over the full size range, expressed as the particle stream contraction factor which is defined by Liu et al. (Citation1995a) as ratio of the radial position of particle’s trajectories
and the gas streamline
far downstream the orifice. Contraction factors
close to 0 indicate perfect focusing, values close to 1 indicate no focusing at all, and negative values indicate “overshooting” of the central axis. In , it can be seen that the first orifice perfectly focuses 70 nm particles, the second one 50 nm, and the third one 30 nm indicated by the dashed lines. Although the main task of the acceleration orifice is to set the correct pressure in the lens system, it can also be seen that the orifice acts as a focusing orifice effectively focusing 18 nm particles (, dotted line), because its Stokes number is in the same range as the designed focusing orifices. The total contraction factor of the system
is a product of the orifice contraction factors shown by the bold line in . A perfect focusing is achieved for TiC-particles with a Stokes diameter between 18 and 70 nm, and the targeted size range between 20 and 80 nm is sufficiently focused.
Figure 1. Size-dependent contraction factor for single focusing orifices (dashed lines) and the full aerodynamic lens (bold line) as function of particle diameter as predicted by the Aerodynamic Lens Calculator (Wang and McMurry Citation2006).
2.3. Realized three-stage lens system
For the realized system simplifications were made for a simpler manufacturing and assembly process. All orifices were constructed having the same diameter of 6.0 mm, which is a deviation of less than 5% of the optimal diameter as found with help of the Aerodynamic Lens Calculator as can be seen in . The critical inlet orifice and thereby the mass flow rates also deviate due to manufacturing tolerances, where the realized critical orifice diameter was calculated from the measured mass flow rate of 0.62 slm which is larger than the design point of 0.5 slm for argon. The focused diameter in the realized system is then recalculated on the basis of the modified geometrical properties for argon as well as for nitrogen and indicated for the different stages in as It can be seen that the realized system focuses slightly larger particles than the proposed design, perfect focusing now being attained between 22 and 76 nm in argon. As the carrier gas is sometimes changed into nitrogen or a mixture of nitrogen and argon, the effect of changing the gas was also investigated for the dimensions realized here and shown in . Changing the carrier gas to nitrogen leads to a slightly higher mass flow rate of 0.71 slm and a moderate shift of the focusing window to the range between 17 and 54 nm.
Table 2. Proposed and chosen single lens design according to Aerodynamic Lens Calculator (Wang and McMurry Citation2006): orifice diameter as well as mass flow rate for different carrier gases and focused Stokes diameter ( = 5,200 kg/m3).
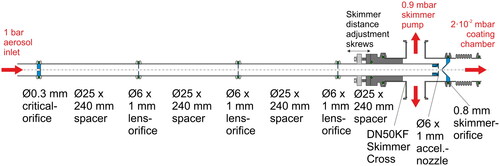
The layout of the lens assembly which was then constructed can be seen in , containing also the essential geometrical dimensions. It bases on the ISO quick flange system. Stainless steel vacuum tubes (DN25KF) are used as spacers held together with clamps. The centering ring for the gasket is interchanged by a stainless steel disk where the thin-plate orifice is integrated. The acceleration nozzle of the lens system is inserted into a DN50KF cross used as a skimmer chamber. The acceleration nozzle is movable in order to adjust the distance to the skimmer which has an orifice diameter of 0.8 mm. The two perpendicular ports of the skimmer chamber are connected to the skimmer pump.
Figure 2. The three-stage aerodynamic lens system.
3. Numerical simulation of transfer behavior
To obtain more insight into the behavior of particles in the full system excluding the inlet orifice and including the skimmer, CFD simulations (Fluent, version 6.2, Fluent Inc., Lebanon NH, USA) are performed followed by Lagrangian particle tracking. The lens assembly shown in is modeled as two-dimensional axisymmetric compressible and laminar flow using an ideal gas model. Due to the large pressure differences and critical flow, under-relaxation has to be applied in order to obtain convergence. The boundary conditions set are fixed mass flow at the inlet as shown in , and fixed gas pressure at the skimmer pump and coating chamber (wide arrows in ), based on the values obtained in the experiments. Particle trajectories are obtained using the built-in discrete phase model (DPM) using a highly diluted second phase without interaction with the continuous phase. The large pressure differences make it also necessary to use local data to calculate the forces acting on the particle by adding user-defined-functions (UDF). The particle drag force is using a Stokes–Cunningham model (Fuchs Citation1964) as proposed by Liu et al. (Citation1995a, 19995b) and adapting the slip correction value (Rader Citation1990) by the local gas properties such as pressure, mean free path and relaxation time. Brownian motion is superposed to the particle movement by including a randomly distributed external force (Li and Ahmadi Citation1992) on the particles which is calculated from the individual particle diffusion coefficient.
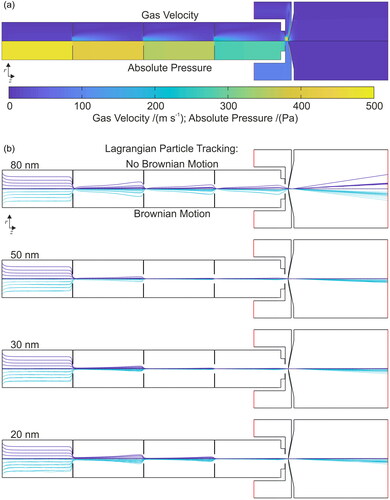
The resulting gas velocities in the case of nitrogen for the conditions shown in are displayed in . It can be seen that the pressure differences between the different stages are relatively large and abrupt and range from 470 Pa in the first stage to 280 Pa before the acceleration nozzle, followed by 90 Pa before the skimmer and 2 Pa in the deposition chamber. In Section 5.1, these results will be compared with experimental data. The gas velocities in the orifices range from 150 m/s in the first orifice to 215 m/s in the third orifice. In the expansion after the acceleration nozzle a velocity of 480 m/s is reached corresponding to a Mach number of 1.7. Exemplary particle trajectories can be seen in for four different particle diameters, in the top half of the figure without Brownian motion and in the lower half with Brownian motion simulated. Without Brownian motion the particles between 20 and 50 nm are perfectly focused, whereas particle with diameter of 80 nm are only focused to some degree. When Brownian motion is now added in the simulation, the perfect focusing in the orifice is partially lost while passing the spacer region due to diffusion. But still at a certain distance from the acceleration nozzle a well-focused beam is formed which is ideal for entrance into a skimmer. Again, at a larger distance after the skimmer the particle beam has widened which has three causes: the thermal radial velocity component of the particles at the moment they leave the acceleration nozzle (Liu et al. Citation1995a), diffusion especially for the smaller particles and off-axis presence of larger particles due to imperfect focusing.
Figure 3. Axisymmetric CFD simulation of the lens system. Display is radially stretched by a factor of 5. (a) Velocity magnitude (top part) and pressure (lower part) of the gas and (b) particle trajectories, shown without (top part) and with added Brownian motion (bottom part) for different particle diameters.
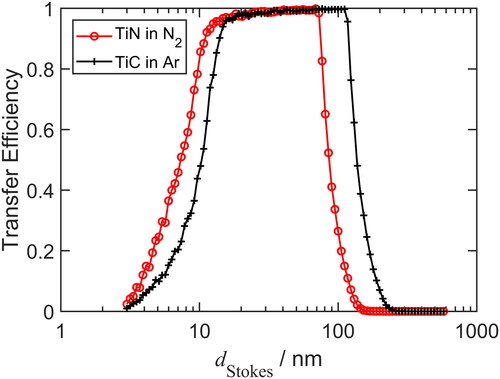
The transfer efficiency of differently sized particles through the lens assembly including the skimmer is simulated by performing the Lagrangian particle tracking with added Brownian diffusion for a large number of trajectories (160,000 in total) and analyzing the arrival statistics. For the statistics, the particles are weighted by their represented area of the inlet due to radial symmetry. shows that a transfer efficiency over 50% is reached for the range 6–100 nm in case of TiN in nitrogen and 10–150 nm in case of TiC in argon. Therefore, it can be concluded the designed lens assembly is suitable for the transfer from atmospheric pressure and subsequent deposition of the desired product particles. In reality, higher particle losses due to the exclusion of the inlet orifice from the simulation can be expected.
Figure 4. Simulated transfer efficiency of the lens assembly as function of the Stokes diameter of the particles coming from two different synthesis conditions indicated in the legend.
4. Experimental setup
Two different experimental setups have been used. The first setup consists of a single lens system and a small vacuum chamber to study the single lens performance. It has a mass flow rate of 0.62 slm using argon and 0.71 slm using nitrogen. In this setup sample position and skimmer positioning can be changed to measure transfer efficiencies, and the pressure at each individual orifice can be obtained. After determination of optimal parameters for the single lens, a system consisting of eight single lens systems as an array was assembled and coupled with the PVD coating chamber. Product particles are then transferred by the eight lens array into the PVD chamber simultaneously with the PVD coating process, with the aim of co-deposition of nanoparticles and PVD film. The thereby produced coatings on piston rings are investigated with respect to their morphology as well as their mechanical properties.
4.1. Setup for experimental assessment of individual lens
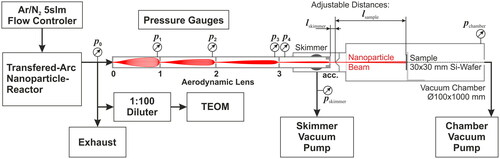
The setup used for validation of a single lens system is schematically depicted in . The single lens assembly is attached to a nanoparticle synthesis system which produces TiCxNy particles of variable composition. This system, consisting of a transferred-arc reactor having a solid titanium (Ti) rod as material source, has been described in detail in Kiesler et al. (2015). It allows to vary the composition of the product particles between pure TiC and TiN by varying the carrier gas composition between nitrogen and argon mixed with a small percentage (0.06 vol%) of methane. The variation of the gas composition also leads to a change in the nanoparticle production rate, which is measured after dilution (VKL 100, Palas, Karlsruhe, Germany) with a TEOM (Model 1405, Thermo Fisher Scientific, Waltham, MA, USA). The aerosol consists of agglomerated 10–25 nm primary particles with a mean aggregate mobility diameter = 120 nm, which need to be focused. The product aerosol is sucked through the critical inlet orifice into the lens system, a small amount of the remaining aerosol is fed to the TEOM or flows into the exhaust. To validate the accuracy of the numerical flow simulation, the pressure is measured at the individual lens stages using a vacuum gauges (Lenses: CTR100; Skimmer: TTR100; Chamber PTR90, Leybold GmbH, Cologne, Germany). The lens system is connected to a small vacuum chamber, which is essentially a cylindrical 1 m long, 100 mm diameter ISO DN100K tube. In the chamber 30 mm × 30 mm silicon wafer substrates can be placed at different distances after the skimmer, so that the deposition profile of the nanoparticle beam can be studied. The skimmer pump (Trivac D65B, Leybold GmbH) removes the main part of the gas flow, and a rotary pump assembly (RUTA WAU 1001/SV 200, Leybold GmbH) creates the technical vacuum for the deposition chamber. The construction allows the variation of distance between acceleration nozzle and skimmer (
), as well as the distance between skimmer and sample (
). The particles are deposited on silicon wafers as very smooth and flat substrates. The transfer efficiency is determined gravimetrically by weighing the particle deposit using a precision balance (XS 205, Mettler Toledo GmbH, Gießen, Germany) and comparing with the particle production rate. For the determination of the beam profile, the wafers with the deposited particles are coated with a 50 nm silver thin film by high-vacuum evaporation system (MB evap, MBraun GmbH, Munich, Germany) to secure the shape. The profile is then measured with a stylus-type profilometer (XP 200, Ambios Technology Inc., Santa Cruz, CA, USA).
Figure 5. Setup for assessment of single lens behavior and optimization of distances.
4.2. Setup for creation of coatings with multiple lenses
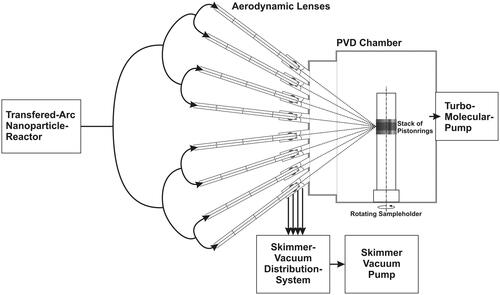
The same nanoparticle reactor as used in §4.1 is connected via an array of eight lens systems identical to the one used in Section 4.1 to an arc-PVD coating chamber (Sulzer Metaplas GmbH, Bergisch-Gladbach, Germany), schematically shown in . The aerosol flow is equally distributed among the lenses, whereas a single pump having a pumping speed of 600 m3/h (GX600L, Edwards, Burgess Hill, United Kingdom) is used to remove the carrier gas of the eight lens systems. The individual lenses are mounted on a frame which is connected to the access door (with thickness 200 mm) of a commercial PVD chamber having a rectangular size of 600 mm × 600 mm and a height of 1 m. They are placed above each other at different angles pointing towards a stack of stainless steel rings to be coated, which are placed at the center of the PVD reactor. The individual lens systems are aligned using a green DPSS-laser having a power of 10 mW which is inserted at the position of the critical orifice at the inlet. The laser beam then passes through all the lens orifices and allows to predict the exact particle deposition spot at the substrate in the PVD chamber. The individual deposition spots are placed above each other with a distance corresponding to the half-width of the experimentally determined deposition profile (Section 5.1). A number of arc-sputtering sources placed at 90° to the entrance of the lenses into the PVD reactor allow to coat the rotating sampleholder for a stack of cylindrical stainless steel rings, each having a diameter of 150 mm and a height of 1.7 mm. The chamber is connected to a turbomolecular pump (Turbovac T1600, Leybold GmbH) having a pumping speed of 1,600 l/s.
Figure 6. Experimental arrangement for incorporating nanoparticles from an atmospheric-pressure arc discharge reactor through an eightfold aerodynamic lens array onto a stack of rings inside a PVD coating chamber operated at 2 Pa.
4.3. Film characterization
The coatings produced are investigated using SEM and STEM (JSM 7500F, JEOL Ltd., Tokyo, Japan) with integrated energy dispersive X-ray spectroscopy (EDX) (X Flash 5030, Bruker Corporation, Billerica, MA, USA). For SEM analysis the samples have been cold-embedded in acrylic (DuroCit, Struers GmbH, Willich, Germany) and cross sections have been cut using a tomography saw (AccuTom, Struers GmbH) and a grinding/polishing system (TegraPol, Struers GmbH). For TEM analysis, a 1 mm thick sample of the coated surface was cut from a 5 mm long ring segment using the tomography saw. The sample was then embedded in a 3 mm brass tube using a two-component epoxy glue (G2, Gatan Inc., Pleasanton, CA, USA) and sawed into a 1 mm thick disk. This disk was further grinded down to 300 µm which exactly fitted a TEM grid holder. In order to obtain electron transparency (<100 nm), it was thinned in the center down to 10 µm using a dimple grinder (656, Gatan) followed by an ion polishing system (PIPS, Gatan Inc.). The crystallite diameter was measured using a XRD diffractometer (X’Pert Pro, Panalytical, Almelo, Netherlands) using Cu-Kα radiation for a range between 42° and 45° with a resolution of 0.008° per step and 100 s/step integration time. The sample was rotated during the measurement to obtain radially averaged data over multiple crystallites. The diffractograms are analyzed by a full profile least square fit based on a Rietveld refinement (Rietveld Citation1967, Citation1969) implemented in the free Java-based software MAUD (Lutterotti et al. Citation2004; Lutterotti Citation2010). The mechanical properties, hardness and Young’s modules, were obtained using a Nanoindenter (Berkovich indenter for NHT2, Anton Paar GmbH, Peseux, Switzerland).
5. Experimental results
In the following, we will describe the performance of the single lens system, especially with respect to transfer efficiency of the particle beam as well as the deposition profile of the particle film. Then the eightfold lens system array is used for the production of composite films by combining the focused nanoparticle beams with PVD of CrON. The resulting thin films are investigated using electron microscopy and a study is made of the mechanical properties of the film as function of the particle loading.
5.1. Single lens experiments
First we benchmark the values predicted by the CFD simulation and the Aerodynamic Lens Calculator with the pressures measured at different stages of the single lens system. The results can be seen in . The Aerodynamic Lens Calculator gives a good estimation of the pressure drop over the single orifices, whereas the detailed CFD simulation yields values which deviate no more than 1%. Therefore, designing a lens system on the basis of the Aerodynamic Lens Calculator seems to be possible with remarkable accuracy. The largest uncertainty is caused by the exact diameter of the critical inlet orifice, which is difficult to drill with high precision, so that the real mass flow rate has to be determined after manufacture of the critical orifice. Once this mass flow rate is known, the pressure calculations are precise enough to be used for system analysis.
Table 3. Comparison of design parameters using the Aerodynamic Lens Calculator with CFD simulation and experimental build setup using the pressure as comparison value.
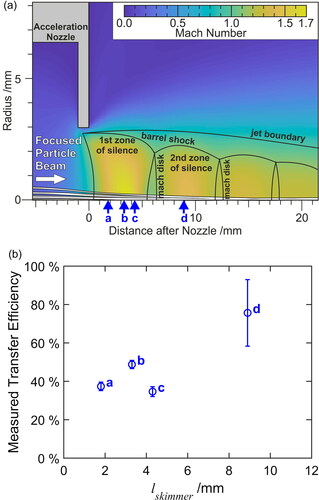
The CFD simulations were then used to determine the gas mass flows at the skimmer, because these cannot be measured directly. The mass flow through the 0.8 mm skimmer orifice with a pressure of 89.2 Pa in the skimmer chamber is 8.6 sccm in case of nitrogen and 7.7 sccm for argon. The exact position of the skimmer is of great importance for the transfer efficiency of the particles through the skimmer. Experiments on skimmer positioning from cluster beams suggest that the skimmer should be positioned in front of the Mach disk (Pauly Citation2012), so in the first zone of silence. An approximate position of the Mach disk can be calculated from (Campargue Citation1984):
(12)
(12)
which is for the conditions in our experiments 7.1 mm. In , the CFD simulations show the positions of the different zones based on the local Mach number. The transfer efficiency was then measured with the skimmer placed at the start, center and end of the first zone of silence as predicted by the CFD, as well as the middle of the second zone of silence. Local pressure measurements also enable to locate the zone of silence and the minima found are in perfect agreement with CFD. shows indeed a maximum of the transfer efficiency when the skimmer is placed centrally in the first zone of silence, but surprisingly the transfer efficiency with the skimmer placed at the second zone of silence is 76% in comparison to 49% placed at the first zone of silence. This can be explained with the smaller beam diameter at the second zone of silence, so that more particle will enter the skimmer having a diameter of only 0.8 mm. Therefore, in all ensuing experiments a skimmer position of 8.9 mm has been used. Overall, the conclusion is that in comparison to molecular and cluster beams, larger distances are needed for nanoparticle beams to collimate. Possible scattering in the shock at the Mach disks is not important due to higher particle masses.
Figure 7. (a) Fluent simulation of acceleration nozzle without skimmer indicates Mach number and position of Mach disk as well as particle beam width of 30 nm TiN particles. Skimmer positions are indicated. (b) Measured collection efficiency for different nozzle to skimmer distances. Best efficiency is reached in second zone of silence with narrower particle beam width.
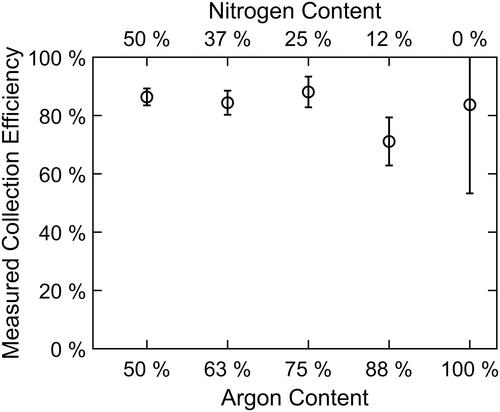
The lens assembly has to be used for varying mixtures of carrier gas, therefore the influence of the carrier gas composition on the transfer efficiency is studied experimentally. shows that there is almost no influence of the carrier gas composition. The increasing measurement error when adding argon can be explained by the reduction of the production rate upon addition of argon, so that the gravimetric measurement becomes more error-prone. Transfer efficiencies over 80% are obtained. This allows efficient differential pumping, as 80% of the particles reach the PVD chamber while only 1.3% of the gas (0.009 slm from 0.71 slm) enters the deposition chamber. This small gas mass flow ensures that the disturbances of the PVD process by the aerosol introduction are minimized.
Figure 8. Measured collection efficiency for different gas compositions using a skimmer distance of 8.9 mm. The effect of the gas composition is negligible for the transfer system.
Earlier experiments showed that the nanoparticles have a primary particle size in the range 11–20 nm and are in form of larger aggregates (Kiesler et al. Citation2013), so that the question arises if this influences the focusing behavior. The aggregates have an equivalent mean geometric diameter of
= 120 nm as found by online scanning mobility particle sizer (SMPS) analysis. The Stokes diameter can then be estimated applying the following equation assuming fractal aggregates, based on Sorensen (Citation2011), and the simplified Cunningham slip correction factor valid for large Knudsen values (EquationEquation (5)
(5)
(5) ):
(13)
(13)
When applying a mass fractal dimension = 2.17 and
= 0.97 (Sorensen Citation2011) which is typical for diffusion limited cluster aggregation (DLCA) aggregates, we find a Stokes diameter of
= 26.3 nm for a primary particle diameter
= 20 nm so that the aggregates are in the size range which is effectively focused by the lens assembly (). This is in agreement with the measured high transmission efficiency.
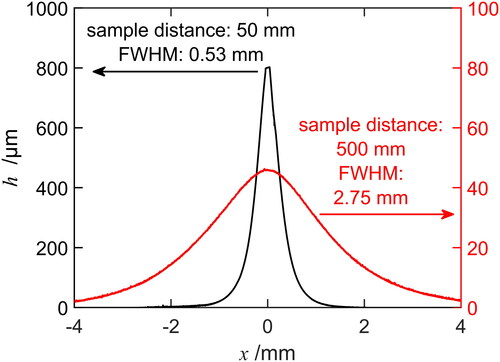
As the particle beam is narrower than the substrate to be coated, the deposition spots are placed with a certain spacing in between. For an optimal placement of the different deposits, the deposition profile has to be known. Deposits collected at a silicon substrate placed at different distances after the skimmer are characterized using the profilometer. In , it can be seen that the beam widens, from 0.53 mm at 50 mm to 2.75 mm at 500 mm. This is partly caused by particle diffusion, as the mean free path at 2 Pa is 3 mm so that the particles undergo collisions with the background carrier gas molecules. The other causes are a divergence angle of the beam at the skimmer due to off-axis presence of imperfectly focused particles and a thermal radial velocity distribution of the particles before entering the high vacuum (Liu et al. Citation1995a). A perfect Gaussian profile is found. As the distance between skimmer and substrate in the PVD reactor is 500 mm, the chosen distance between subsequent deposition spots is one full width at half maximum (FWHM) of the Gaussian curve, here 2.75 mm.
Figure 9. Profile of the deposited particles measured in different locations after the skimmer.
5.2. Coatings
Experiments with the full eight lens systems array coupled to the PVD reactor showed that particles can be deposited on the substrates in the PVD chamber without the plasma being ignited. The height of a homogeneous particle coating achieved is 10.2 mm using the array of eight lens systems. But until now, there has been no proof of principle of incorporating nanoparticles in a thin film from a nanoparticle beam which traverses a reactive plasma. It remains possible that the particle deposition is disturbed by the reactive species from the plasma, possible particle charging and deflection by the plasma ions and electric fields, as well as the bias voltage between substrate and chamber often used in PVD. Thus, experiments were conducted in order to prove the feasibility of embedding nanoparticles in growing PVD films.
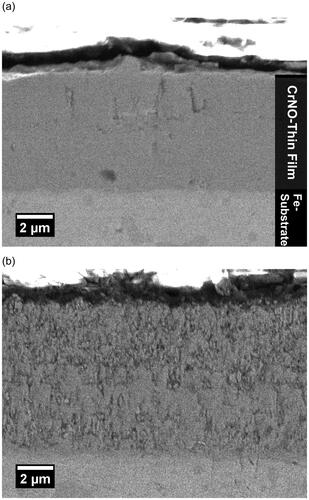
A number of coatings were produced using the eight lens systems array connected to the PVD chamber. By variation of the nitrogen content in the argon carrier gas the nanoparticle production rate was varied (Kiesler et al. 2015), while the PVD coating time and rate was kept constant. This leads to CrON films having different nanoparticle content, denominated here with In , the effect of incorporating the nanoparticles on the morphology of the CrON film can be seen. Apparently, the film volume increases which is to be expected due to the larger total mass. Furthermore, the film becomes less homogeneous by the particle incorporation and appears to have a higher roughness than the film without particles.
Figure 10. SEM images of cross-section of thin CrON films: (a) without nanoparticles and (b) with embedded nanoparticles (synthesis conditions: 50% argon in nitrogen, = 20%vol).
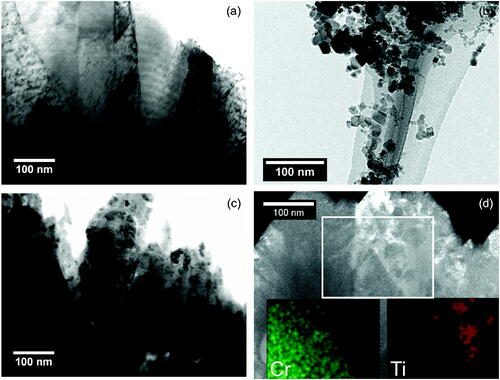
To study the microstructure of the film and to obtain experimental evidence for the successful incorporation of nanoparticles, the samples consisting of the nanocomposite films on a stainless steel substrate were prepared as electron-transparent cross section. STEM images are shown in . The reference PVD film without embedded nanoparticles in subfigure (a) shows the typical columnar growth structure, originated by crystal growth in a particular direction. The growth direction here is bottom to top. The titanium carbonitride (TiCN) nanoparticles to be embedded were deposited on a lacey TEM grid which consists of multiple narrow interconnected carbon ligaments (). The particles show the typical cubic shape of the rocksalt structure (space group: ) formed by TiCN with an average primary particle size
= 20 nm. The same small cubic structures can be found in the micrograph of the PVD film where embedded nanoparticles are expected (), the particles being present in form of aggregates. The structure of the matrix material CrON now shows a different morphology, especially the crystal defects now being less directional in comparison to the reference film. An even more convincing proof of the presence of TiCN particles is shown in , where the two-dimensional elemental EDX mapping shows the presence of Ti at positions where cubic structures can be recognized in the film. Furthermore, the particles are fully embedded in the matrix material and no porosity can be detected on this scale. Thus, one can conclude that the apparent roughness on a larger scale seen is not a result of porosity but might be a break-out of TiCN aggregates as a result of the cross section preparation which includes a polishing step. Overall, the microstructural analysis proves that TiCN aggregates are successfully embedded in the CrON film.
Figure 11. (a) STEM image of thinned cross section of CrON thin film without particles, (b) TEM image of TiCN nanoparticle agglomerates used for deposition, (c) STEM image of thinned cross section of CrON thin film with embedded TiCN particles, and (d) dark-field STEM with inset EDX elemental maps for Cr and Ti of the marked area (TiCN synthesis conditions: 50% nitrogen in argon, = 20%vol).
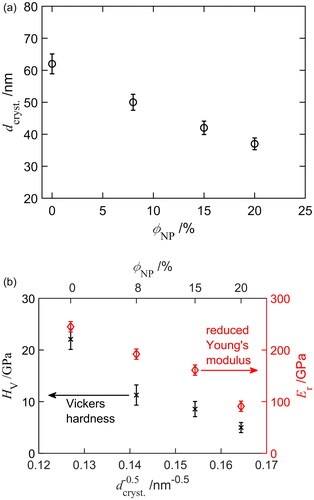
The films with embedded nanoparticles were characterized with XRD in order to investigate whether the overall film properties are modified by the nanoparticles. shows that the CrON crystallite size decreases with increasing nanoparticle content. The crystallite size without embedded nanoparticles is in good agreement with the width of the crystalline columns which can be recognized in , having a length of several 100 nm and a width of around 50 nm. The decrease of crystallite size with increasing nanoparticle content can be explained by the nanoparticles disturbing the columnar growth when they deposit together with the Cr–O–N atoms or clusters on the substrate. The change in crystallite size is also expected to change the mechanical properties of the CrON film, which is industrially used as hard coating and wear resistance material on metals. In , it can be seen that the Vickers hardness (
) decreases with increasing nanoparticle content and decreasing crystallite size. This is contrary to the proposed Hall–Petch effect for nanostructured ceramics (Palmero Citation2015), which predicts a grain boundary induced hardening effect. The Vickers hardness
varies with the crystallite size as
This can be explained by a buildup of dislocations at the grain boundary under stress, suppressing strain in neighboring grains. When the crystallite size is below a critical value and there is not enough space to form dislocation pile-ups, the reverse Hall–Petch effect can set in Takeuchi (Citation2001). This reverse Hall–Petch effect can explain the decrease in hardness seen in . Different values for the critical crystallite size in nanostructured oxide ceramics have been found, with values of 20 nm (Ryou et al. Citation2018) and 40 nm (Sokol et al. Citation2017) for MgAl2O4 and up to 130 nm for MgO (Ehre and Chaim Citation2008). For CrON, no data for a critical size could be found. The largest crystallite size of 62 nm can be expected to be near the critical threshold, because the parameters for the deposition of the CrON coatings without nanoparticles had already been optimized for maximum hardness. The decrease in hardness then also leads to an increase in the elasticity as expressed by a decrease in the Young’s modulus
as observed for the films produced.
Figure 12. (a) Crystallite size of the CrON matrix material as measured by XRD as function of nanoparticle content
and (b) mechanical film properties in form of Vickers hardness
and reduced Young’s modulus
as function of crystallite size and nanoparticle content.
6. Conclusions
A technology to embed nanoparticles in a growing PVD film has been developed and experimentally assessed. It is based on an upscaled three-stage aerodynamic lens system, which allows to bring nanoparticles from an atmospheric-pressure aerosol reactor into a PVD vacuum chamber operating at low pressure (2 Pa). This requires the use of a higher mass flow rate than conventionally used in aerodynamic lenses, so that a rational upscaling strategy for designing an aerodynamic lens for larger mass flow rates is proposed. This strategy keeps the Reynolds number as well as the particle Stokes number constant when the mass flow rate is increased by a scaling factor It is found that the orifice diameter scales linear with
while the required orifice pressure has to be reduced by a factor
The required pump capacity increases however by a factor of
thereby limiting the possible scale-up. Here, an array consisting of eight parallel three-stage lens systems having each a mass flow rate of 0.62 slm (Ar) to 0.71 slm (N2) is built and optimized, assisted by CFD and numerical trajectory analysis. An optimal transfer efficiency is predicted for Stokes diameters between 10 and 80 nm. Single lens system experiments show very good agreement with the pressures predicted by the CFD simulations and it was experimentally found that placing the skimmer position in the second zone of silence gives the highest transfer efficiency in the PVD chamber. The setup allows efficient differential pumping, as 80% of the particles reach the PVD chamber while only 1.3% of the gas (0.009 slm from 0.71 slm) enters the deposition chamber. The deposit shows a perfect Gaussian profile, with FWHM of 2.75 mm at the coating position. The full lens array is connected to a PVD reactor, focusing particles on rotating rings over a total width of 10.2 mm. A number of coatings consisting of TiCN nanoparticles in a thin CrON film with varying nanoparticle content were produced. Detailed STEM and EDX mapping show the successful incorporation of the nanoparticles in the thin film and the change in film crystallite size and mechanical film properties could be studied. A reverse Hall–Petch behavior has been observed, characteristic for small crystallite sizes. This technology allows to control independently the nanoparticle properties and PVD film characteristics, as the aerodynamic lens allows to perform the particle formation and film formation as separate processes.
Additional information
Funding
Related Research Data
References
- Abu Shgair, K. N. 2002. New possibilities for building high-vacuum chambers using glued aluminum plates and application to sputtered nanocomposite coatings. Doctoral thesis, Fachbereich Maschinenbau und Verfahrenstechnik, Technische Universität Kaiserslautern. https://kluedo.ub.uni-kl.de/frontdoor/index/index/start/0/rows/10/sortfield/score/sortorder/desc/searchtype/simple/query/Khaleel+N.+Abu+Shgair/docId/1359.
- Campargue, R. 1984. Progress in overexpanded supersonic jets and skimmed molecular beams in free-jet zones of silence. J. Phys. Chem. 88 (20):4466–4474. doi: 10.1021/j150664a004.
- Ehre, D., and R. Chaim. 2008. Abnormal Hall–Petch behavior in nanocrystalline MgO ceramic. J. Mater. Sci. 43 (18):6139–6143. doi: 10.1007/s10853-008-2936-z.
- Fernández de La Mora, J., and P. Riesco-Chueca. 1988. Aerodynamic focusing of particles in a carrier gas. J. Fluid Mech. 195 (1):1–21.[Mismatch] doi: 10.1017/S0022112088002307.
- Fuchs, N. A. 1964. The mechanics of aerosols. Oxford: Pergamon Press.
- Goo, J. 2002. Numerical simulation of aerosol concentration at atmospheric pressure by a cascade of aerodynamic slit lenses. J. Aerosol Sci. 33 (11):1493–1507. doi: 10.1016/S0021-8502(02)00109-X.
- Gulbiński, W., S. Mathur, H. Shen, T. Suszko, A. Gilewicz, and B. Warcholiński. 2005. Evaluation of phase, composition, microstructure and properties in TiC/aC: H thin films deposited by magnetron sputtering. Appl. Surf. Sci. 239 (3–4):302–310. doi: 10.1016/j.apsusc.2004.05.278.
- Hauert, R., and J. Patscheider. 2000. From alloying to nanocomposites—Improved performance of hard coatings. Adv. Eng. Mater. 2 (5):247–259. doi: 10.1002/(SICI)1527-2648(200005)2:5 < 247:AID-ADEM247 > 3.0.CO;2-U.
- Hoornaert, T., Z. K. Hua, and J. H. Zhang. 2010. Hard wear-resistant coatings: A review. In Advanced Tribology: Proceedings of CIST2008 & ITS-IFToMM2008, ed. J. Luo, Y. Meng, T. Shao, and Q. Zhao, 774–779. Berlin, Heidelberg: Springer-Verlag Berlin Heidelberg.
- Jehn, H. 2000. Tribologische PVD-Hartstoffschichten. Mo. Dünnschichttechnik 54 (54):64.
- Johansen, F. C. 1930. Flow through pipe orifices at low Reynolds numbers. Proc. R. Soc. A: Math. Phys. Eng. Sci. 126 (801):231–245. doi: 10.1098/rspa.1930.0004.
- Kiesler, D., T. Bastuck, M. Kennedy, and F. E. Kruis. 2013. Incorporation of nanoparticles into PVD coatings by means of an aerodynamic lens system. In PARTEC 2013: International Congress for Particle Technology; Nürnberg, Germany, April 23, 2013; together with POWTECH 2013, TechnoPharm 2013; abstracts and proceedings. Proceedings. Nürnberg: Nürnberg Messe.
- Kiesler, D., T. Bastuck, F. E. Kruis, and M. Kennedy. 2011. Scaling of an aerodynamic lens for use in coating technology. In European Aerosol Conference EAC 2011 Abstracts, ed. European Aerosol Assembly EAA, vol. 1, Manchester, United Kingdom.
- Kiesler, D., T. Bastuck, R. Theissmann, and F. E. Kruis. 2015. Plasma synthesis of titanium nitride, carbide and carbonitride nanoparticles by means of reactive anodic arc evaporation from solid titanium. J. Nanoparticle Res. 17 (3):121. doi: 10.1007/s11051-015-2967-8.
- Lee, P., D.-R. Chen, and D. Y. H. Pui. 2003. Experimental study of a nanoparticle virtual impactor. J. Nanoparticle Res. 5 (3/4):269–280. doi: 10.1023/A:1025538930994.
- Leyland, A., and A. Matthews. 2000. On the significance of the H/E ratio in wear control: A nanocomposite coating approach to optimised tribological behaviour. Wear 246 (1–2):1–11. doi: 10.1016/S0043-1648(00)00488-9.
- Li, A., and G. Ahmadi. 1992. Dispersion and deposition of spherical particles from point sources in a turbulent channel flow. Aerosol Sci. Technol. 16 (4):209–226. doi: 10.1080/02786829208959550.
- Liu, P. S. K., R. Deng, K. A. Smith, L. R. Williams, J. T. Jayne, M. R. Canagaratna, K. Moore, T. B. Onasch, D. R. Worsnop, and T. Deshler. 2007. Transmission efficiency of an aerodynamic focusing lens system: Comparison of model calculations and laboratory measurements for the aerodyne aerosol mass spectrometer. Aerosol Sci. Technol. 41 (8):721–733. doi: 10.1080/02786820701422278.
- Liu, P., P. J. Ziemann, D. B. Kittelson, and P. H. McMurry. 1995a. Generating particle beams of controlled dimensions and divergence: I. Theory of particle motion in aerodynamic lenses and nozzle expansions. Aerosol Sci. Technol. 22 (3):293–313. doi: 10.1080/02786829408959748.
- Liu, P., P. J. Ziemann, D. B. Kittelson, and P. H. McMurry. 1995b. Generating particle beams of controlled dimensions and divergence: II. Experimental evaluation of particle motion in aerodynamic lenses and nozzle expansions. Aerosol Sci. Technol. 22 (3):314–324. doi: 10.1080/02786829408959749.
- Lutterotti, L. 2010. Total pattern fitting for the combined size–strain–stress–texture determination in thin film diffraction. Nucl. Instrum. Methods Phys. Res. Sect. B: Beam Interact. Mater. Atoms 268 (3–4):334–340. doi: 10.1016/j.nimb.2009.09.053.
- Lutterotti, L., D. Chateigner, S. Ferrari, and J. Ricote. 2004. Texture, residual stress and structural analysis of thin films using a combined X-ray analysis. Thin Solid Films 450 (1):34–41. doi: 10.1016/j.tsf.2003.10.150.
- Middha, P., and A. S. Wexler. 2005. Particle–focusing characteristics of matched aerodynamic lenses. Aerosol Sci. Technol. 39 (3):222–230. doi: 10.1080/027868290922131.
- Middha, P., and A. S. Wexler. 2006. Design of a slot nanoparticle virtual impactor. Aerosol Sci. Technol. 40 (10):737–743. doi: 10.1080/02786820600660911.
- Mitterer, C., P. H. Mayrhofer, and J. Musil. 2003. Thermal stability of PVD hard coatings. Vacuum 71 (1–2):279–284. doi: 10.1016/S0042-207X(02)00751-0.
- Nijhawan, S., P. H. McMurry, M. T. Swihart, S.-M. Suh, S. L. Girshick, S. A. Campbell, and J. E. Brockmann. 2003. An experimental and numerical study of particle nucleation and growth during low-pressure thermal decomposition of silane. J. Aerosol Sci. 34 (6):691–711. doi: 10.1016/S0021-8502(03)00029-6.
- Novosselov, I. V., and P. C. Ariessohn. 2014. Rectangular slit atmospheric pressure aerodynamic lens aerosol concentrator. Aerosol Sci. Technol. 48 (2):163–172. doi: 10.1080/02786826.2013.865832.
- Palmero, P. 2015. Structural ceramic nanocomposites: A review of properties and powders' synthesis methods. Nanomaterials 5 (2):656–696. doi: 10.3390/nano5020656.
- Pauly, H. 2012. Atom, molecule, and cluster beams I: Basic theory, production and detection of thermal energy beams, Springer series on atomic, optical, and plasma physics. Berlin Heidelberg: Springer Berlin Heidelberg.
- Piazzoni, C., M. Buttery, M. R. Hampson, E. W. Roberts, C. Ducati, C. Lenardi, F. Cavaliere, P. Piseri, and P. Milani. 2015. Tribological coatings for complex mechanical elements produced by supersonic cluster beam deposition of metal dichalcogenide nanoparticles. J. Phys. D: Appl. Phys. 48 (26):265302. doi: 10.1088/0022-3727/48/26/265302.
- Rader, D. J. 1990. Momentum slip correction factor for small particles in nine common gases. J. Aerosol Sci. 21 (2):161–168. doi: 10.1016/0021-8502(90)90001-E.
- Repenning, D. 2004. PVD/PACVD-Nanokompositschichten: gezielt eingestellte eigenschaften. Galvanotechnik 95 (12):3014–3019.
- Rietveld, H. 1967. Line profiles of neutron powder-diffraction peaks for structure refinement. Acta Crystallogr. 22 (1):151–152. doi: 10.1107/S0365110X67000234.
- Rietveld, H. 1969. A profile refinement method for nuclear and magnetic structures. J. Appl. Crystallogr. 2 (2):65–71. doi: 10.1107/S0021889869006558.
- Rodrı́guez, R. J., J. A. Garcı́a, R. Martinez, B. Lerga, M. Rico, G. G. Fuentes, A. Guette, C. Labruguere, and M. Lahaye, 2004. Tribological metal-carbon coatings deposited by PVD magnetron sputtering. Appl. Surf. Sci. 235 (1–2):53–59. doi: 10.1016/j.apsusc.2004.05.124.
- Ryou, H., J. W. Drazin, K. J. Wahl, S. B. Qadri, E. P. Gorzkowski, B. N. Feigelson, and J. A. Wollmershauser. 2018. Below the Hall–Petch limit in nanocrystalline ceramics. ACS Nano 12 (4):3083–3094. doi: 10.1021/acsnano.7b07380.
- Sokol, M., M. Halabi, Y. Mordekovitz, S. Kalabukhov, S. Hayun, and N. Frage. 2017. An inverse Hall–Petch relation in nanocrystalline MgAl2O4 spinel consolidated by high pressure spark plasma sintering (HPSPS). Scr. Mater. 139:159–161. doi: 10.1016/j.scriptamat.2017.06.049.
- Sorensen, C. M. 2011. The mobility of fractal aggregates: A review. Aerosol Sci. Technol. 45 (7):765–779. doi: 10.1080/02786826.2011.560909.
- Su, Y., M. F. Sipin, H. Furutani, and K. A. Prather. 2004. Development and characterization of an aerosol time-of-flight mass spectrometer with increased detection efficiency. Anal. Chem. 76 (3):712–719. doi: 10.1021/ac034797z.
- Sublemontier, O., H. Kintz, and Y. Leconte. 2013. Method for the synthesis of a nanostructured composite material and a device for implementing said method. US9925557B2. US13963358, filed August 9, 2013, and issued February 13, 2014.
- Sublemontier, O., Y. Rousseau, Y. Leconte, N. Herlin, and M. Mayne. 2016. O18-AT-ABN-16 elaboration of nanocomposite coatings by coupling aerosol jets and physical vapour deposition. In European Aerosol Conference EAC 2016 Abstracts, ed. European Aerosol Assembly EAA, vol. 1, Tours, France. Accessed June 21, 2018. http://api.mycongressonline.net/Abstract_files/eac2016-abstracts/file/15585-EAC2016-Sublemontier-HYMALAYAN.pdf.
- Takeuchi, S. 2001. The mechanism of the inverse Hall–Petch relation of nanocrystals. Scr. Mater. 44 (8–9):1483–1487. doi: 10.1016/S1359-6462(01)00713-8.
- Wang, X., F. E. Kruis, and P. H. McMurry. 2005. Aerodynamic focusing of nanoparticles: I. Guidelines for designing aerodynamic lenses for nanoparticles. Aerosol Sci. Technol. 39 (7):611–623. doi: 10.1080/02786820500181901.
- Wang, X., and P. H. McMurry. 2006. A design tool for aerodynamic lens systems. Aerosol Sci. Technol. 40 (5):320–334. doi: 10.1080/02786820600615063.
- Wegner, K., P. Piseri, H. V. Tafreshi, and P. Milani. 2006. Cluster beam deposition: A tool for nanoscale science and technology. J. Phys. D: Appl. Phys. 39 (22):R439–R459. doi: 10.1088/0022-3727/39/22/R02.
- Zhou, Y., H. Zhang, and B. Qian. 2007. Friction and wear properties of the co-deposited Ni–SiC nanocomposite coating. Appl. Surf. Sci. 253 (20):8335–8339. doi: 10.1016/j.apsusc.2007.04.047.
- Ziemann, P. J., P. Liu, N. P. Rao, D. B. Kittelson, and P. H. McMurry. 1995. Particle beam mass spectrometry of submicron particles charged to saturation in an electron beam. J. Aerosol Sci. 26 (5):745–756. doi: 10.1016/0021-8502(95)00009-2.