
 ?Mathematical formulae have been encoded as MathML and are displayed in this HTML version using MathJax in order to improve their display. Uncheck the box to turn MathJax off. This feature requires Javascript. Click on a formula to zoom.
Abstract
We evaluated a newly developed Portable Aerosol Collector and Spectrometer (PACS) in the laboratory. We developed an algorithm to estimate mass concentration by size and composition with a PACS. In laboratory experiments, we compared particle size distributions measured with the PACS to research instruments for multi-modal aerosols: two-mode generated by spark discharge, consisting of ultrafine (fresh Mn fume) and fine particles (aged Cu fume); and three-mode produced by adding coarse particles (Arizona road dust) to the two-mode. Near-real-time size distributions from the PACS compared favorably to those from a scanning mobility particle sizer and an aerodynamic particle sizer for the three-mode aerosol (number, bias = 9.4% and R2 = 0.96; surface area, bias = 17.8%, R2 = 0.77; mass, bias = −2.2%, R2 = 0.94), but less so for the two-mode aerosol (number, bias = −17.7% and R2 = 0.51; surface area, bias = −45.5%, R2 = 0; for mass, bias = −81.75%, R2 = 0.08). Elemental mass concentrations by size were similar to those measured with a nano micro-orifice uniform deposition impactor for coarse-mode particles, whereas agreement was considerably poorer for ultrafine- and fine-mode particles. The PACS has merit in estimating multi-metric concentrations by size and composition but requires further research to resolve discrepancies identified for two-mode aerosol.
Copyright © 2019 American Association for Aerosol Research
1. Introduction
Adverse health effects from inhaled aerosols are a complicated function of aerosol size, composition, and concentration (Harrison and Yin Citation2000). Particles deposit in different regions of the respiratory system according to their size and shape, whereas the adverse health effects potentially resulting from these deposited particles depend on particle composition (Hinds Citation1999; Valavanidis, Fiotakis, and Vlachogianni Citation2008). Moreover, three concentration metrics (number, surface area and mass) are considered as predictors of various adverse health effects for different size particles (Kittelson Citation1998; Brouwer, Gijsbers, and Lurvink Citation2004; Ramachandran et al. Citation2005; Ellenbecker and Tsai Citation2015).
A combination of commercially available research instruments is needed to assess aerosol exposures by size, composition, and multiple concentration metrics. Some instruments provide a way to continuously measure aerosol number concentrations by size, such as the scanning mobility particle sizer (SMPS, ∼$70,000) for measuring the sub-micrometer particles by equivalent mobility particle diameter, and the aerodynamic particle sizer (APS, ∼$50,000) for measuring particles larger than ∼0.7 μm by aerodynamic particle diameter (Baron Citation1986; Wang and Flagan Citation1990). Surface area and mass size distributions can be estimated reasonably well with the SMPS and APS because the number concentrations are highly resolved by size. Such estimates, however, are improved with knowledge of particle density and shape factor, which is not available from these instruments. Other device, such as the nano micro-orifice uniform deposit impactor (nanoMOUDI, ∼$60,000), can collect particles by size onto substrates for subsequent chemical analysis, such as an inductively coupled plasma-mass spectrometry (ICP-MS) (Marple, Rubow, and Behm Citation1991; Karthikeyan, Joshi, and Balasubramanian Citation2006; Kulkarni et al. Citation2007). Combined, the SMPS, APS, and nanoMOUDI provide near-real-time size distributions by metric and composition. However, they are expensive, large, and heavy, limiting their use to research studies.
Previously, we introduced a new device—the Portable Aerosol Collector and Spectrometer (PACS)—designed to estimate aerosol size distributions of three metrics (number, surface area and mass concentration) in near-real-time (<3 min), and to collect particles to determine mass concentration by size and composition. Introduced by Cai et al. (Citation2018), the PACS hardware consists of a six-stage particle size selector, a valve system, a water condensation particle counter (WCPC) to detect number concentrations, and a photometer to detect mass concentrations. The valve system diverts airflow to pass sequentially through each stage of the selector to the detectors. The first stage of the selector allows aerosol entering the inlet to freely pass through to the valve manifold. The next three impactor stages collect particles by single-hole impactors with measured 50% collection efficiency cutoff aerodynamic diameters, d50s, of 10 µm, 1 µm, and 0.4 µm. The last two stages collect particles by diffusion with measured d50s of 16 nm and 56 nm of geometric diameter, respectively. A software program sequentially opens one valve at a time to obtain six number and six mass concentrations every 3 min. Cai et al. (Citation2018) developed a multi-modal log-normal (MMLN) fitting algorithm that leverages these low-resolution, two-metric measurements to estimate number, surface area, and mass concentration highly resolved by size from 10 nm to 10 µm in near-real-time.
In this study, we had two objectives: (1) to develop an algorithm to estimate the mass distribution of an aerosol by size and composition using data from the chemical analysis of particles collected on the stages of the PACS size selector; and (2) to compare particle size distributions measured for multi-modal aerosols with the PACS to those measured with SMPS, APS, and nanoMOUDI in the laboratory. We compared the near-real-time number, surface area and mass concentrations by size measured with the PACS to those measured with the SMPS/APS and mass concentrations by composition and size measured with the PACS to those measured with the nanoMOUDI.
2. Methods
2.1. Description of the algorithm
We developed a new algorithm—the mass distribution by composition and size (MDCS) algorithm—to estimate mass concentration by composition and size from analysis of particles collected on the stages of the PACS size separator (). The algorithm has three inputs: (1) the mass of each element e from analysis (in this work, chemical analysis by ICP-MS) of particles collected in each PACS stage k, (2) the collection efficiency of particles by size dp for each PACS stage (
experimentally determined by Cai et al. (Citation2018); equivalent mobility diameter for particles smaller than ∼700 nm and aerodynamic diameter for particles larger than ∼700 nm); (3) output from the MMLN algorithm including, for each particle size mode i, the mass concentration by size
the mass median diameter
and geometric standard deviation (
). We used a tri-modal, log-normal distribution to mathematically express the mass size distribution of a particle for a given composition:
(1)
(1)
Figure 1. Flow chart of the mass distribution by composition and size (MDCS) algorithm to estimate mass size distributions by particle compositions.
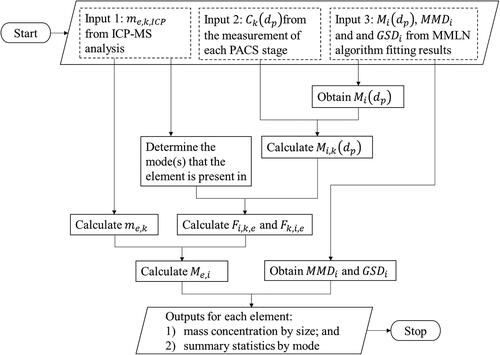
For each element, we adjust (Input 1) for the fact that lower volumes of air pass through each successive stage as follows:
(2)
(2)
where ttotal is the total time of one PACS measurement cycle, and tk is the time that air passes through a given stage during that sequence. The air volume sampled differs because the stages are in series and the valves open sequentially one at a time. For one cycle given the current arrangement of the PACS with each valve open for 30 s the total time is 180 s and the time that air passes through Stage 1 is 150 s, Stage 2 is 120 s, Stage 3 is 90 s, Stage 4 is 60 s, and Stage 5 is 30 s. Using
values that are greater than the limit of detection (LOD), we assign the element to a mode(s) as follows: (1) all modes, if mass detected in impactor and diffusion stages; (2) fine and coarse modes, if mass in all three impactor stages only; (3) coarse mode, if mass in the first two impactor stages only; (4) ultrafine and fine modes, if mass in diffusion stages only; and (5) ultrafine mode, if mass in first diffusion stage only.
We multiply from Input 2 by
from Input 3 to calculate the mass concentration of each mode in each stage by size:
(3)
(3)
Assuming that the mode structure is the same as the mode structure identified by the MMLN algorithm (Cai et al. Citation2018), we calculate the mass fraction of each mode among all three modes in each stage as:
(4)
(4)
We also calculate the mass fraction of each stage among all six stages of each mode as:
(5)
(5)
We then calculate the mass concentration in each mode as:
(6)
(6)
where Q is the PACS flowrate, and t is the sampling time.
For each element, we obtain the MMD and GSD of each mode output by the MMLN algorithm. We then distribute the mass () calculated above. The algorithm outputs: (1) composition mass size distribution from 10 nm to 10 μm resolved in 40 size bins for each decade of data; (2) summary statistics (Me, MMD, GSD) for each mode.
2.2. Aerosol generation and experimental setup
We compared aerosol size distributions measured with the PACS to those measured with research instruments two multi-modal aerosols: (1) a three-mode aerosol with fresh Mn fume for the ultrafine mode (<100 nm), aged Cu fume for the fine mode (100 nm ∼ 1 µm) and Arizona road dust for the coarse mode (>1 µm), and (2) a two-mode aerosol with fresh Mn fume for the ultrafine mode and aged Cu fume for the fine mode. The three-mode aerosol was used to mimic the structure observed by Whitby and Sverdrup (Citation1980) as typical of ambient aerosol, whereas the two-mode aerosol was used to evaluate the PACS under an extreme case (i.e., little mass concentration detected by the photometer without a coarse mode).
Fresh Mn fume (ultrafine mode aerosol) was produced with a spark discharge system described previously by Park et al. (Citation2014) with 5 kV voltage and 3 mA current applied between two identical pure Mn rods (3 mm diameter × 75 mm length, purity 99.5%, Goodfellow Corporation, PA, USA). To produce aged Cu fume (fine mode aerosol), we used a second spark discharge system operated with 5 kV voltage applied between two identical pure Cu rods (3 mm diameter × 75 mm length, purity 99.99%, McMaster-Carr Elmhurst, IL, USA). The aerosol produced with this system was aged as it was passed through two coagulation chambers in series (2 chambers × 200 L each = 400 L). The aerosols produced in the spark chambers were passed through Po-210 neutralizer before entering a mixing chamber. Coarse mode aerosol was produced by aerosolizing Arizona road dust (Fine Grade, Part # 1543094, Powder Technology Inc., Arden Hills, MN, USA) with a fluidized bed aerosol generator (3400A, TSI Inc., Shoreview, MN, USA).
Experiments were conducted using a test chamber shown in . The chamber consisted of a mixing zone (0.64 m × 0.64 m × 0.66 m) and a sampling zone (0.53 m × 0.64 m × 0.66 m), divided by a perforated plate, which contains 600 evenly spaced holes (0.6 cm in diameter). Room air was filtered with two high efficiency particulate air filters to provide the clean air to the mixing zone. We fed the generated multi-modal aerosols directly into the mixing zone of the test chamber. For each aerosol type, we conducted three experiments, and each experiment lasted 8 h.
Figure 2. Experimental set-up used to compare particle size distributions measured with the PACS to those measured with SMPS, APS, and Nano-MOUDI.
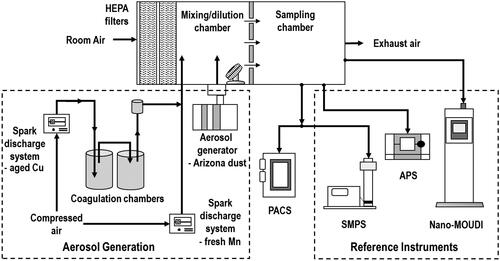
Measurement instruments were positioned outside the sampling chamber including the PACS, SMPS (SMPS 3936, TSI Inc., Shoreview, MN, USA), APS (APS 3321, TSI Inc., Shoreview, MN, USA), and nanoMOUDI (model 125-R, MSP, Shoreview, MN, USA). The impactor substrates of the PACS were greased to minimize the particle losses. Polycarbonate substrates (0.2 µm pore size, 47 mm diameter, Part # PCT0247100, Sterlitech Corporation, Kent, WA, USA) were cut in-house to 11-mm-diameter circles. A round stamp cut out of foam (37 mm in diameter) dipped into oil (Heavy-Duty Silicone Oil, Part # 07041, MSP Corporation, Shoreview, MN, USA) was pressed onto the middle of polycarbonate substrates to create a layer of silicone oil coating. Greased substrates were baked in the oven at 50 °C for 4 h to evaporate volatile material and create a thin layer of sticky silicone intended to prevent particle bounce (Pak et al. Citation1992). The greased filter was attached to pre-oiled, porous plastic discs (9.5 mm in diameter, Part # 225-388, SKC Inc., Eighty Four, PA, USA), and pressed into a recess in the impactor plate assembly. Nylon meshes (41–μm net filters, Part # NY4104700, Carrigtwohill, Co. Cork, Ireland) held in place with a 47-mm filter holder were used to collect particles by Brownian motion in the diffusion stages. We used one mesh for the first diffusion stage, and six meshes for the second diffusion stage. The PACS was operated at 0.7 L min−1 for 8 h in each experiment.
The SMPS measured particle number concentration by size (64 size bins per decade) from ∼10 to ∼400 nm (equivalent mobility diameters) every 3 min during the first hour of sampling. The APS measured particle number concentration by size (32 size bins per decade) from ∼700 nm to ∼20 μm (aerodynamic diameters) every 30 s during the first hour of sampling. The nanoMOUDI was operated at 10 L min−1 for 8 h in each experiment, and 13 polycarbonate substrates (0.2 µm pore size, 47 mm in diameter, Part # PCT0247100, Sterlitech Corporation, Kent, WA, USA) coated with silicon oil, using the same procedure described above for preparing the PACS impactor substrates. A mixed cellulose esters filter (0.8 µm pore size, 47 mm in diameter, Part # FMCE847, Zefon International, Inc., Ocala, FL, USA) was used as a backup filter in the last nanoMOUDI stage to collect remaining particles.
2.3. Near-real-time aerosol size distributions
We applied the MMLN algorithm, presented by Cai et al. (Citation2018), to convert number and mass concentrations measured by stage with PACS to number, surface area and mass concentration by size. These particle size distributions measured with the PACS were compared to those measured with the SMPS/APS. We obtained three SMPS measurements (time = 3 min × 3 times = 9 min) during the first sampling hour, and then calculated the average of them. For the same 9-min time period, we also calculated the average of all APS measurements. After measuring the number concentration by size using SMPS and APS, we converted the number concentration by size to surface area and mass concentration by size by assuming the standard density and spheres of the particles. We compared the mean concentrations measured with the PACS and SMPS/APS during the same sampling time. For each metric, we then quantified the ability of PACS to measure aerosol size distributions with the following two statistical parameters:
(7)
(7)
(8)
(8)
where PACSj and Resj are the measured aerosol concentration with the PACS and the research instruments (SMPS/APS), respectively, for each size bin, j.
is the averaged value over all size bins. To make the measurement results comparable between the PACS and SMPS/APS, we converted the aerodynamic diameter measured with the PACS for particles smaller than ∼700 nm to equivalent mobility diameter by assuming standard density spheres (particle density = 1000 kg/m3 and shape factor = 1).
Percentage bias indicates the tendency of the PACS to overestimate or underestimate the total concentration of each metric. R2 indicates how well the aerosol size distributions of number, surface area and mass concentration measured with the PACS approximates the data points measured with the SMPS/APS.
2.4. Mass concentration by element and size
Loaded PACS and nanoMOUDI substrates were digested separately using a 1:4 mixture of 29 M hydrofluoric acid (HF, Trace Metal Grade, Fisher Scientific LLC, Pittsburgh, PA, USA) and 15 M nitric acid (HNO3, Trace Metal Grade, Fisher Scientific LLC, Pittsburgh, PA, USA) in 7-ml capsules (Perfluoroalkoxy vial, Savillex Corporation, MN, USA) on a hotplate at 95 °C for 24 h (Baker et al. Citation2004). After the lids were removed, HF and HNO3 were evaporated from the samples. Then, 15 M HNO3 was added into the capsules and the digestion was repeated with HNO3 alone for another 12 h. After that the HNO3 was evaporated, we diluted the samples with 2% HNO3.
Samples were analyzed for Mn, Fe, and Cu, by ICP-MS (X Series II quadrupole, Thermo Fisher Scientific, MA, USA), in CCT (collision cell technology) mode using a H2/He gas mixture for kinetic discrimination to minimize polyatomic interferences. A known amount of Co was added to each solution as an internal standard to correct for changes in sensitivity due to matrix supression and instrument drift. The internal standard and calibration solutions were National Institute of Standards and Technology (NIST) certified reference materials sold by Inorganic Ventures (Christiansburg, VA). Standard solutions were diluted with 2% HNO3 (Trace Metal Grade, Fisher Scientific LLC, Pittsburgh, PA) to concentrations of 0, 10, 20, 30, 40, and 50 part per billion (ppb) that were used to determine a calibration curve for each mass (55Mn, 57Fe, 63Cu).
We compared the mass size distributions measured with the PACS to those measured with the nanoMOUDI for several particle compositions determined through ICP-MS. We ran the MMLN algorithm to obtain the needed inputs (
and
) for the MDCS algorithm. Together with other inputs (
from ICP-MS and
from measurement), we then ran the MDCS algorithm to calculate the mass concentrations by size for each element. Mn was used as an indicator of the ultrafine mode, and Cu was used as an indicator of the fine mode. Fe is one of the main elements in the Arizona road dust, so we used the Fe as an indicator of the coarse mode (Ramadan, Song, and Hopke Citation2000).
3. Results and discussion
3.1. Near-real-time aerosol size distributions
The near-real-time number, surface area and mass concentrations by size measured with the PACS and SMPS/APS are presented graphically for the three-mode aerosol in and for the two-mode aerosol in , and summarized in . In these figures, Panel a shows the raw concentration data from the PACS detectors (WCPC and photometer) relative to time, and Panel b shows the size distribution results from the MMLN algorithm compared to that from the SMPS/APS.
Figure 3. Near-real-time number, surface area, and mass concentration by size measured with the PACS compared to the SMPS/APS for the three-mode aerosol: (a) raw input to the multi-modal log-normal (MMLN) algorithm from the WCPC and photometer (stage d50 provided in parentheses), and (b) output size distributions from the algorithm. Error bars represent the standard deviation of three measurements during the 1st hour experiment.
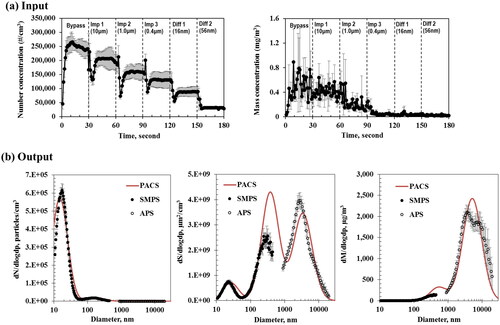
Figure 4. Near-real-time number, surface area, and mass concentration by size measured with the PACS compared to the SMPS/APS for the two-mode aerosol: (a) raw input to the multi-modal log-normal (MMLN) algorithm from the WCPC and photometer (stage d50 provided in parentheses), and (b) output size distributions from the algorithm. Error bars represent the standard deviation of three measurements during the 1st hour experiment.
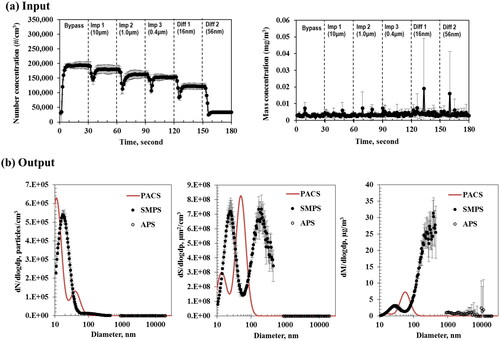
Table 1. Near-real-time particle size distributions measured with the PACS compared to the SMPS/APS.
For the three-mode aerosol, the size selector in the PACS removed more particles with each stage added in a sequence of measurement, resulting in stair steps in the raw number and mass concentration (). The number concentration was more stable than the mass concentration because the metal fume generated by the spark discharging system was more stable than the Arizona road dust generated by the fluidized bed aerosol generator. Particle number, surface area and mass concentrations by size measured with the PACS were compared to those measured with the SMPS/APS (). The number concentration measured with the PACS was similar to that measured with the SMPS/APS (percentage bias for the total number concentration was 9.4%, coupled with R2 of 0.96 shown in ). The surface area concentration was overestimated with a percentage bias of 17.8% and R2 of 0.77. The mass concentration measured with the PACS was 2.2% lower than that measured with the SMPS/APS with R2 of 0.94.
For the two-mode aerosol, mass concentrations detected with the photometer were low (0.003 ± 0.001 mg/m3) in all stages () because of the limitations of photometer for measuring mass concentrations. The photometer uses the Mie theory of light scattering of particles and the built-in optical parameters (e.g., light wavelength and detection angle) (Görner, Bemer, and Fabries Citation1995). Therefore, the mass concentration measured with the photometer is a function of the main aerosol parameters including the refractive index, particle density, particle size, etc. For metal fume, Sousan et al. (Citation2017) found that mass concentrations measured with a photometer were highly linear (correlation coefficient r = 0.99) with those measured gravimetrically, but were severely underestimated (slope of 0.2 ± 0.01; photometer concentrations were five times lower than gravimetric mass concentrations). In addition, the photometer does not measure the mass concentration of ultrafine mode particles because the photometer only responds to particles larger than 100 nm (as reported by the manufacturer).
The size distributions measured with the PACS compared poorly to those from the SMPS/APS (). For number concentration, the PACS underestimated the particle size of both ultrafine and fine modes. The inability to identify the ultrafine and fine modes resulted in underestimated total concentration and poor R2 values for number (bias = −17.7%; R2 = 0.51), surface area (bias = −45.5%; R2 = 0), and mass concentration (bias = −81.8%; R2 = 0.08) (). We attribute this poor agreement to the inability of the photometer to measure particles throughout the fine mode. If we apply the correction factor of five for the metal fume obtained from the study of Sousan et al. (Citation2017), the size distributions measured with the PACS were greatly improved (Figure S1) shown in the online supplementary information. The bias of the number concentration was increased from −17.7% to 31.8% with R2 increased from 0.51 to 0.76. The bias of the surface area concentration was increased from −45.5% to 39.6% with R2 increased from 0 to 0.25. The bias of the mass concentration was increased from −81.8% to −10.6% with R2 increased from 0.08 to 0.77.
The PACS was able to fit aerosol size distributions for the three-mode aerosol substantially better than for the two-mode aerosol. As designed, reasonable size distributions for number, surface area, and mass concentration were obtained with the MMLN fitting algorithm when raw measurement data was available in all stages (i.e., the three-mode aerosol, ). Thus, the PACS is able to successfully leverage the two-metric, low-resolution data from handheld CPC and photometer technology to estimate size distributions with high resolution over a wide size range in near-real-time.
We envision several ways to improve the ability of the PACS to measure near-real-time aerosol size distributions. For both three- and two-mode aerosols generated in this study, very little mass was detected by the photometer in diffusion stages due to the inability of the photometer to detect metal fume ( and ). The addition of a diffusion charger would provide a direct and highly sensitive way to measure ultrafine and fine particle surface area concentration of ultrafine and fine particles. However, adding a diffusion charger would increase the cost (∼$15,000) and size of the device.
Adding a stage to the size selector may also help resolve the ultrafine and fine modes. Another impactor stage between impactor stage 2 (d50 of 400 nm) and 3 (d50 of 1 μm) may provide more information needed to better estimate the fine mode, whereas adding another diffusion stage after the diffusion stage with d50 of 56 nm may help with estimating both ultrafine and fine modes. However, adding stages would increase the measurement time, device size and device weight.
3.2. Mass concentration by element and size
The results of experiments to evaluate the ability of the PACS to measure mass concentration by element and size by comparing to nanoMOUDI are presented for the three-mode aerosol in and the two-mode aerosols in . In these figures, Panel a shows the raw and time-adjusted mass of the three elements selected to represent different aerosol modes measured on each PACS stage by ICP-MS chemical analysis. Since the valve is open and closed one by one, the time adjusted masses are higher than the raw determined masses, especially in the diffusion stages. The raw data are used as input to the PACS MDCS algorithm, and Panel b shows the mass size distribution output by the MDCS algorithm compared to that from the nanoMOUDI. The mass concentrations of the three elements measured with the PACS and the nanoMOUDI are summarized in .
Figure 5. Mass concentration by size and composition measured with the PACS compared to the nanoMOUDI for the three-mode aerosol: (a) raw and adjusted input to the mass distribution by composition and size (MDCS) algorithm from ICP-MS (stage d50 provided in parentheses), and (b) output size distributions from the algorithm output. Error bars represent the standard deviation of three measurements.
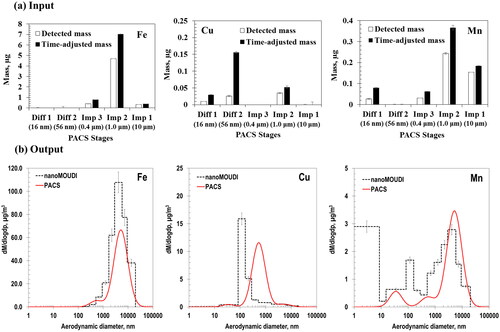
Figure 6. Mass concentration by size and composition measured with the PACS compared to the nanoMOUDI for the two-mode aerosol: (a) raw and adjusted input to the mass distribution by composition and size (MDCS) algorithm from ICP-MS (stage d50 provided in parentheses), and (b) output size distributions from the algorithm output. Error bars represent the standard deviation of three measurements.
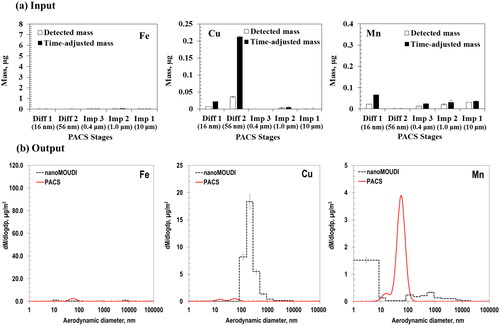
Table 2. Mass concentrations of various elements in each mode measured with the PACS and nanoMOUDI.
For the three-mode aerosol, Fe, an indicator of coarse particles, was detected in impactor stages () but not in diffusion stages. We expected this result because the measured MMD of Arizona road dust is ∼3.3 μm of aerodynamic diameter (), which is consistent with the measurement from the study of Peters, Ott, and O'Shaughnessy (Citation2006). The impactor stage with the d50 of 0.4 μm removed all dust particles. Also as expected based on SMPS/APS measurements (), the marker for fine-mode particles, Cu, was detected in both diffusion stages, and the marker for ultrafine particles, Mn, was detected in the first diffusion stage. However, we were surprised that Cu and Mn were found at appreciable levels on the impactor stages. We discuss this finding during the presentation of results for the two-mode aerosol.
The mass concentrations of elements measured with the nanoMOUDI in the three modes shown in were consistent with the time-adjusted masses of elements in PACS stages shown in . For example, the Fe was only detected in impactor stages, so the coarse mode dominated the Fe mass concentration. Cu were mainly collected by the second diffusion stage, so the fine mode dominated the Cu mass concentration. Mn were determined in both impactor and diffusion stages, the Mn concentrations were found among all three modes. In addition, since the element masses estimated with the MDCS algorithm in the three modes were found in similar particle sizes compared to the d50s of PACS stages, the mode selection process presented in the algorithm development was reasonable.
The PACS estimated the MMDs of the coarse mode well for all three elements, but overestimated the MMDs of the fine modes (). However, according to , the Cu mass concentration in fine mode measured with the PACS (7.3 μg/m3) was similar to that measured with the nanoMOUDI (6.0 μg/m3). These results suggest that the MMD of the fine mode obtained from MMLN fitting results for the three-mode aerosol may not be applicable for each specific element. This finding is consistent with a previous study showing that particles of different composition usually have different modal structures (Bardouki et al. Citation2003). The PACS substantially underestimated the particles smaller than 10 nm. For the WCPC used in the PACS, the count efficiency of particles rapidly decreases from ∼100% for 10-nm particles to ∼0% for ∼4-nm particles (Hakala et al. Citation2013). This may explain why the ultrafine mode measured with the PACS is consistent with that measured with the SMPS (), but severely underestimated when compared to that measured with the nanoMOUDI ().
For the two-mode aerosol, Fe was negligible because Arizona road dust was not present (). As expected based on SMPS/APS measurements (), Cu was mostly detected on Diffusion Stage 2, but also to a much lower extent in Impactor Stage 2 and Diffusion Stage 1. Interestingly, substantial quantities of Mn and Cu were collected on the impactor stages for the three-mode aerosol but not for the two-mode aerosol. We hypothesize that the metallic ultrafine and fine mode particles coagulated with the coarse-mode particles in the mixing and sampling zones of the chamber. The ultrafine and fine metal particles associated with larger particles were then collected on impactor plates of the PACS. We also considered losses due to diffusion, especially for ultrafine mode particles. However, the fact that Mn and Cu were present at substantially lower levels on the impactor stages for the two-mode aerosol than those for the three-mode aerosol suggests that diffusion is a minor mechanism of deposition on impactor plates.
The mass concentrations of elements measured with the nanoMOUDI in the three modes shown in are consistent with the time-adjusted masses of elements in PACS stages shown in . For example, Cu was mainly collected by the second diffusion stage, so the fine mode dominated the Cu mass concentration. Mn was measured in both impactor and diffusion stages, the Mn concentrations were found among all three modes. However, the element mass concentrations estimated with the MDCS algorithm were not inconsistent with nanoMOUDI or the d50s of PACS stages.
Agreement between the mass size distributions from the PACS and nanoMOUDI was considerably poorer for the two-mode aerosol () than that for the three-mode aerosol (). Similar to the three-mode aerosol, the PACS was unable to measure particles smaller than 10 nm. The PACS overestimated the Mn and Cu mass concentration of the ultrafine mode, but severely underestimate the Cu mass concentration of the fine mode (). Adding a backup filter as a last PACS stage might solve the issue of substantially overestimate/underestimate mass concentration for each element. With a backup filter, the PACS would be able to collect all size particles, so that conservation of mass could be used to distribute the mass of each element in each mode.
The accuracy of the fitting results from the MMLN algorithm greatly influenced the accuracy of the results from the MDCS algorithm. We used the MMD and GSD of each mode obtained from the MMLN fitting results to distribute the mass concentration of the aerosol composition in each mode. For the three-mode aerosol, the algorithm overestimated the number concentration and the CMD of the fine mode (); consequently, the PACS overestimated the mass concentration and the MMD of the fine mode as well ( and ). For the two-mode aerosol, the MMLN algorithm underestimated the CMD of the fine mode (), therefore, compared to the nanoMOUDI, the PACS substantially underestimated mass concentration of the fine mode ( and ).
The results from the MDCS algorithm were also affected by some assumptions made in the algorithm inputs. For example, we used non-chemical specific data on modes from the MMLN algorithm results to distribute the element mass data (Input 3). This assumption may explain the difference observed between the measurements from the PACS and nanoMOUDI because particles of different composition usually have various modal structures (Bardouki et al. Citation2003). In addition, when we calculated the mass percentage of each mode (EquationEquation (4)(4)
(4) ) and the mass percentage of particles collected by each stage (EquationEquation (5)
(5)
(5) ), we assumed standard density and spherical shape of all particles in the calculation. Furthermore, converting the equivalent mobility diameter measured with the PACS for particles smaller than ∼700 nm to the aerodynamic diameter was also based on the assumption of standard density spheres, which is the same as the assumption used to convert the number concentration by size measured with SMPS to surface area and mass concentration by size. However, the particle density and shape factor might be different for various aerosol types. This may be why the size distributions measured with the PACS were consistent with those measured with the SMPS/APS, but not consistent with those measured with nanoMOUDI.
We envision several ways to improve the ability of the PACS to resolve mass size distributions by composition and size in the future. First, the MDCS algorithm is dependent on the accuracy of the fitting results from the MMLN algorithm. The MMLN algorithm could be improved by applying a detector (e.g., diffusion charger) more sensitive to ultrafine mode particles and by adding impactor/diffusion stages. Knowing the modal structure by composition might improve the MDCS algorithm results. We could measure the particle size distribution by composition using the nanoMOUDI, so that we could apply the measured modal structure by composition to the MDCS algorithm. In addition, after collecting particles, we can analyze the particles physically and chemically to have more reasonable assumptions of the particle density and shape factor. By knowing the particle density and shape factor could improve the MMLN fitting results as well as presented by Cai et al. (Citation2018).
Limitations of the study include the potential that the laboratory generated multi-mode aerosols are not representative of real multi-mode aerosols in the occupational and environmental settings. In this study, we only generated fresh Mn fume and aged Cu fume for the ultrafine and fine mode particles, respectively. Many other metal and nonmetal aerosol types are needed to be tested. A field study would allow for a practical assessment of the PACS, including set up and durability, and performance of analytical methods in a ‘real-world’ environment.
4. Conclusion
In laboratory tests, we demonstrated the feasibility of measuring the size distributions of multi-modal aerosols with the PACS. For a three-mode aerosol, the near-real-time number, surface area and mass concentrations by size measured with the newly-developed PACS agreed well with those from the SMPS/APS. The mass concentration by element and size estimated with the PACS compared well to those measured with the nanoMOUDI for the coarse mode of all elements, but less so for ultrafine and fine modes. Results were considerably poorer for the two-mode aerosol, especially for near-real-time surface area and mass concentrations by size. Although promising, the PACS in its current form has insufficient accuracy to replace the SMPS/APS. However, the deviation of the PACS from SMPS/APS does not entirely reflect the bias of the PACS due to the assumptions (spherical particle with standard density) used in this study. For example, the surface area estimated in this study is geometric surface area assuming each particle is spherical. However, each instrument used in the comparison measures different equivalent size (mobility for SMPS, aerodynamic for APS, and diffusion for the PACS diffusion stages), and none of these are geometric size. The testing particles generated using spark discharge are highly agglomerated (non-sphere). Therefore, the measurements from these instruments are expected to be different. In the future, applying spherical nanoparticles as testing aerosol might be better than using the agglomerated nanoparticles generated by spark discharge. Future work will also explore ways to improve accuracy through hardware modifications, improvements to the MMLN algorithm, and making reasonable assumptions of particle density, shape factor and modal structure by composition.
Supplemental Material
Download Zip (220 KB)Acknowledgments
The authors would like to express their appreciation to Dr. Beau Farmer of TSI for providing the photometer and technical support. We would also like to thank Dr. Susanne V. Hering of Aerosol Dynamics for providing the WCPC and technical support.
Additional information
Funding
Related Research Data
Reference
- Baker, J., D. Peate, T. Waight, and C. Meyzen. 2004. Pb isotopic analysis of standards and samples using a 207 Pb–204 Pb double spike and thallium to correct for mass bias with a double-focusing MC-ICP-MS. Chem. Geol. 211 (3–4):275–303. doi: 10.1016/j.chemgeo.2004.06.030.
- Bardouki, H., H. Liakakou, C. Economou, J. Sciare, J. Smolı́k, V. Ždı́mal, K. Eleftheriadis, M. Lazaridis, C. Dye, and N. Mihalopoulos. 2003. Chemical composition of size-resolved atmospheric aerosols in the Eastern Mediterranean during summer and winter. Atmos. Environ. 37 (2):195–208. doi: 10.1016/S1352-2310(02)00859-2.
- Baron, P. A. 1986. Calibration and use of the aerodynamic particle sizer (APS 3300). Aerosol Sci. Technol. 5 (1):55–67. doi: 10.1080/02786828608959076.
- Brouwer, D. H., J. H. Gijsbers, and M. W. Lurvink. 2004. Personal exposure to ultrafine particles in the workplace: Exploring sampling techniques and strategies. Ann. Occup. Hyg. 48 (5):439–453. doi: 10.1093/annhyg/meh040.
- Cai, C., G. W. Thomas, T. Yang, J. H. Park, S. P. Gogineni, and T. M. Peters. 2018. Development of a portable aerosol collector and spectrometer (PACS). Aerosol Sci. Technol. 52 (12):1351–1369. doi: 10.1080/02786826.2018.1524985.
- Ellenbecker, M. J., and C. S. J. Tsai. 2015. Exposure assessment and safety considerations for working with engineered nanoparticles. Hoboken, NJ: John Wiley & Sons.
- Görner, P., D. Bemer, and J. F. Fabries. 1995. Photometer measurement of polydisperse aerosols. J. Aerosol Sci. 26 (8):1281–1302. doi: 10.1016/0021-8502(95)00049-6.
- Hakala, J., H. E. Manninen, T. Petäjä, and M. Sipilä. 2013. Counting efficiency of a TSI environmental particle counter monitor model 3783. Aerosol Sci. Technol. 47 (5):482–487. doi: 10.1080/02786826.2013.766666.
- Harrison, R. M., and J. Yin. 2000. Particulate matter in the atmosphere: Which particle properties are important for its effects on health? Sci. Total Environ. 249 (1–3):85–101.
- Hinds, W. C. 1999. Aerosol technology: Properties, behavior, and measurement of airborne particles. John Wiley & Sons.
- Karthikeyan, S., U. M. Joshi, and R. Balasubramanian. 2006. Microwave assisted sample preparation for determining water-soluble fraction of trace elements in urban airborne particulate matter: Evaluation of bioavailability. Anal. Chim. Acta 576 (1):23–30. doi: 10.1016/j.aca.2006.05.051.
- Kittelson, D. B. 1998. Engines and nanoparticles: A review. J. Aerosol Sci. 29 (5-6):575–588. doi: 10.1016/S0021-8502(97)10037-4.
- Kulkarni, P., S. Chellam, J. B. Flanagan, and R. K. M. Jayanty. 2007. Microwave digestion—ICP-MS for elemental analysis in ambient airborne fine particulate matter: Rare earth elements and validation using a filter borne fine particle certified reference material. Anal. Chim. Acta 599 (2):170–176. doi: 10.1016/j.aca.2007.08.014.
- Marple, V. A., K. L. Rubow, and S. M. Behm. 1991. A microorifice uniform deposit impactor (MOUDI): description, calibration, and use. Aerosol Sci. Technol. 14 (4):434–446. doi: 10.1080/02786829108959504.
- Pak, S. S., B. Y. Liu, and K. L. Rubow. 1992. Effect of coating thickness on particle bounce in inertial impactors. Aerosol Sci. Technol. 16 (3):141–150. doi: 10.1080/02786829208959544.
- Park, J. H., I. A. Mudunkotuwa, J. S. Kim, A. Stanam, P. S. Thorne, V. H. Grassian, and T. M. Peters. 2014. Physicochemical characterization of simulated welding fumes from a spark discharge system. Aerosol Sci. Technol. 48 (7):768–776. doi: 10.1080/02786826.2014.925536.
- Peters, T. M., D. Ott, and P. T. O'Shaughnessy. 2006. Comparison of the Grimm 1.108 and 1.109 portable aerosol spectrometer to the TSI 3321 aerodynamic particle sizer for dry particles. Ann. Occup. Hyg. 50 (8):843–850. doi: 10.1093/annhyg/mel067.
- Ramachandran, G., D. Paulsen, W. Watts, and D. Kittelson. 2005. Mass, surface area and number metrics in diesel occupational exposure assessment. J. Environ. Monit. 7 (7):728–735. doi: 10.1039/b503854e.
- Ramadan, Z., X. H. Song, and P. K. Hopke. 2000. Identification of sources of phoenix aerosol by positive matrix factorization. J. Air Waste Manage. Assoc. 50 (8):1308–1320.
- Sousan, S., K. Koehler, L. Hallett, and T. M. Peters. 2017. Evaluation of consumer monitors to measure particulate matter. J. Aerosol Sci. 107:123–133. doi: 10.1016/j.jaerosci.2017.02.013.
- Valavanidis, A., K. Fiotakis, and T. Vlachogianni. 2008. Airborne particulate matter and human health: Toxicological assessment and importance of size and composition of particles for oxidative damage and carcinogenic mechanisms. J. Environ. Sci. Health Part C 26 (4):339–362. doi: 10.1080/10590500802494538.
- Wang, S. C., and R. C. Flagan. 1990. Scanning electrical mobility spectrometer. Aerosol Sci. Technol. 13 (2):230–240. doi: 10.1080/02786829008959441.
- Whitby, K. T., and G. M. Sverdrup. 1980. California aerosols-their physical and chemical characteristics. Adv. Environ. Sci. Technol. 9:477–525.