
 ?Mathematical formulae have been encoded as MathML and are displayed in this HTML version using MathJax in order to improve their display. Uncheck the box to turn MathJax off. This feature requires Javascript. Click on a formula to zoom.
Abstract
The nonvolatile particle number (PN) emissions of late technology diesel heavy-duty vehicles (HDV) are very low due to the introduction of Diesel Particulate Filters (DPF). Nevertheless, a large fraction (50%) of particles below the current lower regulated size (23 nm) was recently reported. Moreover, large differences between laboratory and PN Portable Emission Measurement Systems (PN-PEMS) have been observed. In order to better understand such differences, the physical properties of the exhaust aerosol from two Euro VI technology diesel heavy-duty engines were studied. It was found that urea injection leads to formation of nonvolatile particles. The produced particles covered a wide size range spanning from below 10 nm to above 100 nm. As such, they contribute to the regulated PN emissions, with measured concentrations corresponding to as high as 2 × 10¹¹ #/kWh over a World Harmonized Transient Cycle (WHTC). However, a large fraction of them was undetected owing to their small particle size. Low-cutoff size (10 nm) Condensation Particle Counters (CPCs) (which are under discussion to be included in the regulations) measured up to twice as high concentrations. Considering the large particle losses in the sampling systems at this size range, the true concentrations can be two times higher from what the low-cutoff CPCs reported. When the temperature of the SCR system exceeded a threshold of 300 °C, the produced particles were found to be positively charged, increasing the average exhaust aerosol charge up to +3 elementary charges per particle. Scanning Mobility Particle Sizer (SMPS) measurements of non-neutralized samples revealed that even the smallest of them can carry more than one positive charge. The findings of this study can explain the differences reported between PEMS and laboratory systems and especially those based on diffusion charging. They also provide insight for a refinement of technical requirements prescribed in the European PEMS regulation to more accurately quantify the PN emissions from such technologies.
EDITOR:
1. Introduction
Air pollution is recognized as an important global health risk factor. Particulate matter (PM), nitrogen dioxide (NO2) and ground-level ozone (O3) have been identified as the most harmful pollutants for human health in Europe (EEA Citation2018). PM was identified as damaging to ecosystems and cultural sites, responsible for reduced visibility and an important global risk factor for disease (HEI Citation2017). Automotive exhaust PM has been identified as an important contributor to ambient PM and has been subject to continuously more stringent regulation worldwide. The European Commission even introduced a nonvolatile particle number (PN) method as a means to enforce emission level below the sensitivity offered by the conventional gravimetric procedure. This method counts nonvolatile (sometimes called solid) particles >23 nm, defined as those surviving a thermal pretreatment stage at 300 to 400 °C. The limit value is 6 × 10¹¹ particles per km (vehicle) or kWh (engines). The PN regulation was initially applicable to diesel vehicles but subsequently covered also direct injection gasoline vehicles. Recently, the European Commission communicated its intention for a technology-independent post-Euro 6 regulation. Furthermore, a decision was taken to extend the lowest detection size of the PN methodology to 10 nm, to cover cases that have high fraction of sub-23 nm particles (e.g., some spark ignition vehicles) (Giechaskiel et al. Citation2017; Giechaskiel, Lahde, and Drossinos Citation2019).
Another important pollutant is NO2, which is associated with both short-term and long-term adverse health effects (WHO Citation2013; Faustini, Rapp, and Forastiere Citation2014). The transport sector is the largest contributor to NO2 emissions, accounting for 39% of total NO2 emissions in the European Union (EU) in 2015 (EEA Citation2018). Diesel vehicles have high emissions of nitrogen monoxide (NO) and NO2, often reported together as nitrogen oxides (NOX).
The NOX emissions from vehicles in Europe are regulated through Euro standards, which were first introduced in the 1990s. The Euro V NOX emission standards for heavy-duty engines (HDE) practically forced the introduction of Selective Catalytic Reduction (SCR) for NOx control. The light-duty vehicle limits, even until Euro 6c, could be achieved without SCR. However, the introduction of the new test cycle and procedure and the on-road testing with Portable Emissions Measurement Systems (PEMS) rendered SCR necessary. High NOX reduction efficiency can have some side effects. Too high-urea injection leads to high N2O emissions and/or ammonia slip. Accordingly, ammonia slip catalysts are commonly used in heavy-duty applications in order to ensure that on average <10 ppm of ammonia are emitted to the atmosphere.
However, a minimum exhaust gas temperature is required (around 200 °C) before urea solution injection, in order to ensure a complete decomposition and hydrolysis of urea to ammonia and to avoid catalyst deactivation, by-products and deposits (Brack et al. Citation2016; Guan et al. Citation2014). Images of collected PM with and without urea injection showed that urea-injected particles had sizes from 200 nm to 1 μm (Lee et al. Citation2012). Recent findings have shown that urea injection can also lead to the formation of smaller particles. High numbers of volatile particles have been observed, but these volatile particles were attributed to nucleation mode formation due to the existence of a catalyst (e.g., Herner et al. Citation2011; Lehtoranta et al. Citation2015). Some studies showed an increase in the nonvolatile PN emissions due to secondary formation of nanoparticles in the SCR system (Czerwinski et al. Citation2015). These particles could be nitrates and sulfates (Amanatidis et al. Citation2014; Bao et al. Citation2016). Thermogravimetric analysis showed that a part of ammonium sulfate and ammonium bisulfate still exists as nonvolatile (solid) particles within the optimal temperature range (300–400 °C) of the SCR process, which is also the temperature of the volatile particle removers of the PN systems (Bao et al. Citation2016). Others have also assumed that these nanoparticles originate from isocyanic acid polymerization, urea pyrolysis and urea micro-explosions (Lee et al. Citation2007; Robinson et al. Citation2016). The size distribution of the formed solid particles peaks around 20 nm (Amanatidis et al. Citation2014). At concentration levels <1 × 10¹¹ p/km the sub-23 nm fraction reaches and sometimes exceeds 200% of the soot concentration (Giechaskiel Citation2018) and can be even orders of magnitude higher (Robinson et al. Citation2016). However, so far it seems that the absolute emission levels, including the sub-23 nm fraction in most cases, remain below the regulated limit.
A PN limit was recently introduced in the European Union for In-Service Conformity testing of light-duty vehicles (2017) and will be introduced for heavy-duty vehicles in the next regulatory amendment. The PN Portable Emission Measurement Systems (PN-PEMS) to be used for such measurements may employ either Condensation Particle Counters (CPCs) or advanced diffusion chargers to count the particles. However, application of such PN-PEMS instrumentation for the measurement of heavy-duty vehicles raised concerns as the experimentally determined variability was higher from what reported for light-duty vehicles (Giechaskiel et al. Citation2018). In addition, relatively high differences (>50%) were occasionally observed between the two principles (Schwelberger and Giechaskiel Citation2018, Giechaskiel et al. Citation2018), raising questions about the physicochemical properties of the emitted particles, including their size and charge state, among others.
Differences in the particle penetration characteristics of commercial sampling systems as well as the detection efficiency curves of the employed detectors can lead to large differences in the PN readings of different systems when the size distribution is peaking below the regulatory limit of 23 nm. Engine exhaust aerosol is well known to be bipolarly charged with an overall neutral charge (Maricq Citation2006). Accordingly, the regulation requires that diffusion charger-based PN PEMS instruments are calibrated against neutralized particles. However, if the exhaust particles have a net charge, the charging efficiency and consequently the inverted signal can be affected (Qi et al. Citation2009; Maricq Citation2013).
The objective of this study is to better characterize the physical properties of particles formed in SCR systems. One heavy duty engine and one heavy-duty vehicle equipped with the late aftertreatment systems were tested in three laboratories with similar experimental setups. Particle number concentrations, size distributions and mean charge were measured.
2. Experimental
The measurements were conducted in three laboratories sampling from the tailpipe of a heavy-duty engine (HDE) (lab1) or a heavy-duty vehicle (HDV) (lab2 and lab3).
2.1. Engine and vehicle
The first campaign was conducted on an engine test bed (lab1) with a 5 l, Euro VI compliant compression ignition heavy-duty engine, hereinafter HDE, with a maximum power of 140 kW. In the subsequent two campaigns, a commercial 13 l, Euro VI, 335 kW diesel truck, hereinafter HDV, was tested on two heavy-duty chassis dynamometers (lab2 and lab3).
The aftertreatment configuration for both the engine and the vehicle comprised of a Diesel Oxidation Catalyst (DOC) followed by a wall-flow Diesel Particulate Filter (DPF) in series with a Selective Catalytic Reduction (SCR) catalyst and an ammonia slip catalyst (ASC). In all measurements, raw exhaust samples were taken downstream of the ammonia slip catalyst, using dedicated probes for each instrument employed.
The HDE had a 10 L Copper Zeolite SCR with the last 15% part incorporating ASC activity. Urea was dosed with constant ammonia to NOx ratio (ANR) simply based on the NOx sensor located upstream of the DOC. The set ANR could be controlled manually and when set to zero, no urea was injected. The engine was conditioned before the campaign to remove stored NH3. All tests were performed with ANR of 0 or 1, and therefore, the amount of stored NH3 during the experiments is expected to be minimum.
No information is available on the catalytic formulation and volume of the SCR and ASC system employed in the HDV. The default ECU strategy was bypassed in the measurements. Instead, a demand ANR value was set and the required dosing was calculated taking into account the NOx sensor signal and ECU estimations of the stored urea.
Commercial diesel fuel, containing <7% biofuel (around 6% FAME), <10 ppm sulfur (5–8 ppm) and 2%–4% polycyclic aromatic hydrocarbons (2.6%–3.4%), and diesel exhaust fluid (AdBlue) were used with both vehicles.
2.2. Instrumentation
The focus of the study was on nonvolatile particles as defined in the UNECE Regulation No R49. Accordingly, the nonvolatile PN concentrations were measured with commercial instruments compliant with the regulation. A sample from the tailpipe was extracted through a short (0.5 m) heated line (150 °C) and then diluted (10:1 for labs 1 and 2 and 15:1 in lab3) with hot filtered air (150 °C). The diluted sample was thermally treated in an Evaporation Tube (ET) at 350 °C and then further diluted (10:1) with filtered air at ambient temperature. The particles surviving the Volatile Particle Remover (VPR), which are nonvolatile, were counted by a Condensation Particle Counter (CPC) with 50% counting efficiency at 23 nm. Considering the available information suggesting the formation of particles at sizes below the detection limit of commercial systems and the on-going discussions to extend the detection limit to 10 nm, a second CPC with 50% efficiency at 10 nm was employed in parallel. To further safeguard against potential re-nucleation events, a Catalytic Stripper (CS) was installed in series with the ET in the VPR at labs 1 and 2.
Size distribution measurements of nonvolatile exhaust particles were performed with Scanning Mobility Particle Sizers (SMPS) units, measuring down to 5.5 nm. Owing to the lower sensitivity of the SMPS compared to the CPCs, a lower dilution was required for these measurements. Accordingly, a dedicated sampling system was employed consisting of a hot (150 °C) primary dilution of 2:1, a VPR incorporating a CS (of the same design with the one used in the laboratory systems) and a secondary cold dilution of 3:1.
The total charge of the nonvolatile particles was measured with an electrometer sampling in parallel with either the SMPS or the CPC.
Two AVL FTIR i60 (hereinafter FTIR) analyzers were also employed at lab1. The first one was sampling upstream of the SCR and before the urea injector and the second one at tailpipe (downstream of the ASC) allowing for the real-time measurement of NO and NO2 upstream and downstream of the SCR.
A detailed overview of the instrumentation layout at the three different laboratories can be found in the online supplemental information (SI; Figure S1)
2.3. Measurement protocol
Both the HDE and the HDV were tested over selected steady state conditions to allow for SMPS scans. All tests were performed with the engine warm (oil temperature above 90 °C). Lab1 and lab2 had control on the amount of urea injected, via means of controlling the ammonia to NOx ratio (ANR) based on the ECU NOx sensor. The HDE was tested at 23% load at 1100 rpm and at 50%, 70% and 95% load at 1400 rpm. The exhaust temperature ranged from 290 to 345 °C and thus was within the operating window of the SCR, leading to NOx conversion efficiencies in the range of 90% to 95%. Each operating condition was tested once. Measurements started after the inlet SCR temperature was stabilized within 5 °C, with the ANR alternatively switched between 0 (no urea) and 1 (stoichiometric) twice, staying for approximately 5 min at each point. Some faster ANR changes at a speed/torque ramp were also performed to investigate in more detail the effect of exhaust temperature (Section 3.3).
The HDV was tested over step changes in engine torque (30% to 55% and finally 80% of the maximum torque at 1000 rpm) at a constant engine speed of 1000 rpm (hereinafter torque ramp). The engine was first warmed up to reach an oil temperature of 90 °C by driving at constant speed of 35 km/h and stayed for approximately 10 min at the first two loads and 5 min at the highest torque. Three torque ramps were performed sequentially at lab2, with intermediate stops to cool down the vehicle tires. Due to differences in the soaking period between the torque ramps and the limited control offered by the chassis dyno, the aftertreatment temperatures differed somehow between ramps (∼10 °C). The temperature at the inlet of the SCR was approximately 250 °C at the lowest load and gradually increased at the higher loads exceeding 400 °C at the end of the test. The ANR was kept constant during each torque ramp, and changed from 1 to 0 and then 2 in the three repetitions. Lab3 performed a single torque ramp test at ANR of 1.
2.4. Calculations
The total particle number concentration of >23 nm nonvolatile particles was calculated from the concentrations of the 23 nm CPCs corrected for their slope calibration factor and multiplied by the average Particle Concentration Reduction Factor (PCRF), which includes the dilution factor and the mean particle losses at 30, 50 and 100 nm, as described in the R49 regulation. The same approach was followed for the 10 nm concentrations, without applying any extra particle loss correction for sizes <30 nm. Based on the particle losses of the sampling systems employed, it is estimated that the actual 50% detection efficiency of the entire PN system would be 17 nm for the 10 nm CPC and 29 nm for the 23 nm CPC. While some approaches have been proposed for the correction of particle losses (Kittelson Citation2017; Giechaskiel, Lahde, and Drossinos Citation2019) for PN measurements with 10 nm CPC, these were not validated thus far. It was therefore decided to not apply any additional correction in the reported data. This would also allow for a direct comparison with published data on sub-23 nm PN measurements for SCR-equipped vehicles/engines.
A comparison of the total current (Iel) measured with the electrometer to the concentration measured with the 10 nm CPC (NCPC10) allows for the calculation of the average particle charge:
where Qel is the flow rate of the electrometer. A moving average of 10 s was employed to reduce the noise in the calculated average particle charge. The overestimation in the calculated average particle charge, associated with the cutoff size of the 10 nm CPC, was estimated to be in the range of 10% to 15% based on the measured distributions.
In most of the SMPS measurements, the samples were neutralized before entering the DMA. However, for some operating modes of the HDE, the measurements were repeated with the neutralizer bypassed, in order to gain some more insight on the charge level of the particles. The reference was first established by performing sequential default (the neutralizer installed) SMPS scans at a constant engine operating condition, with the urea injection being alternatively activated and deactivated. The difference between the measured size distributions would correspond to the total size distribution of any additional particles formed following urea injection. Subsequently, the same test sequence was repeated with the neutralizer removed. The difference between the raw signals would then correspond to the excess contribution of positively charged particles (produced following urea injection) exiting the negatively charged DMA column. In general, these particles may exhibit a distribution of positive charges that may also depend on size. This information cannot be recovered from such measurements. However, reconstruction of the size distributions for different distinct number of positive charges (nest) and comparison with corresponding distributions of neutralized samples (reference) can give some qualitative insight on their charge level. If the assumed particle charge (nest) is higher than the true charge, then the recovered distributions would be shifted toward larger sizes compared to the true size distribution (neutralized samples), and vice versa. Similarly, if the concentration of the recovered distributions is lower than the true one, some of the particles produced following urea injection will have negative or zero charge, as only the positively charged particles will be transmitted from the DMA.
For the inversion of the signals produced by non-neutralized particles, a dedicated inversion algorithm was developed. This was based on the procedure described by Wang and Flagan (Citation1990) making the necessary modifications. In particular, the charging probability was set to 1 since all particles were assumed to carry the same positive charge. Furthermore, the electrical mobilities, and accordingly the classification times, for +2 and more charges were adjusted to account for the assumed particle charge. The nominal efficiencies used in the latest TSI application (Aerosol Instrument Manager version 10.1.0.6) were employed to account for the CPC counting efficiency and particle penetration through the SMPS. No correction for multiple charge fractions was applied, since it was assumed that all particles carry the same distinct positive charge. The validity of the developed algorithm was verified by reproducing the size distributions reported by the TSI application for the tests with neutralized samples (SI Figure S2).
All concentrations are normalized at 0 °C and 1 atm and reported in particles per cubic centimeter.
3. Results
3.1. PN concentrations
compares the nonvolatile PN concentrations measured with the 10 and 23 nm CPCs, over selected steady-state operating conditions of the HDE and the HDV. When no urea was injected, the regulated (23 nm) PN emissions of the HDV ranged between 1.1 × 10⁴ and 2.3 × 10⁴ #/cm3. The 10 nm CPC registered 20% to 26% higher concentrations. When injecting urea at stoichiometric amount, the regulated PN emissions increased by more than twofold ranging between 4.7 × 10⁴ #/cm3 to 5.7 × 10⁴ #/cm3. The fraction of excess particles detected by the 10 nm CPC increased up to 62%, reporting concentrations in the 7.5 × 10⁴ to 7.7 × 10⁴ #/cm3 range. Overdosing urea at twice the stoichiometric quantity did not lead to a proportional increase of PN emissions. On the contrary, emission levels were on average ∼10% lower for the 10 nm CPC and ∼25% lower for the 23 nm CPC compared to those at stoichiometric urea quantity.
Figure 1. Nonvolatile PN concentrations measured with the 23 and 10 nm CPCs at different steady-state conditions of the HDV (lab2) (left side) and the HDE (lab1) (right side) at different levels of urea feed factors (ANR = 1 corresponding to stoichiometric dosing). Percentage differences correspond to the excess concentrations measured with the 10 nm CPC relative to the 23 nm one. The engine speed, torque and exhaust mass flow rates of each mode tested are reported on the horizontal axis.
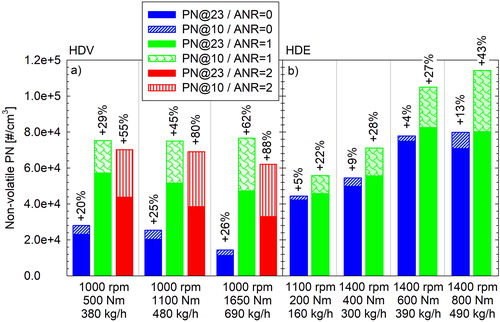
The baseline (urea deactivated) emission levels of the HDE were higher than those of the HDV. The regulated (23 nm) PN concentrations ranged between 4.2 × 10⁴ and 7.4 × 10⁴ #/cm3, while the 10 nm CPC measured at maximum 13% higher concentrations. Urea injection led to a modest 10% increase in the regulated PN emissions for this engine. A stronger effect was observed on the 10 nm recordings, which registered up to 43% higher concentrations at the highest load (800 Nm) tested. The repeatability for the two repetitions at each ANR setting was approximately 5% for both CPCs.
3.2. Size distribution
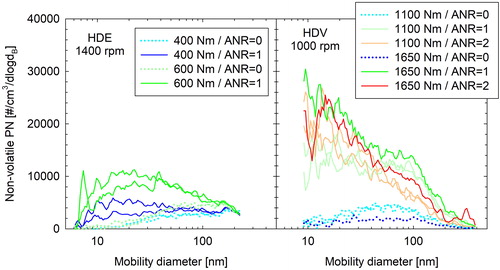
illustrates the effect of urea injection on the measured number weighted size distributions of the HDE (left-hand panel) and the HDV (right-hand panel), as quantified in labs 1 and 2, respectively. With the urea injection deactivated, a unimodal size distribution with a geometric mean diameter at 76 nm (HDE at lab1) and 55 nm (HDV at lab2) was observed. When urea was injected in the SCR, the concentrations increased over the entire size range, though predominantly in the sub-50 nm range. This led to either a shift of the peak (HDE) or the appearance of a second distinct peak (HDV) at approximately 20 nm. No significant difference could be observed in the size distributions of the HDV exhaust when increasing dosing from a stoichiometric amount of urea or twice this level, besides a systematic reduction of the concentrations above 50 nm. The specific tests were executed in the sequence of stoichiometric dosing, no dosing and overdosing. The ECU signals also confirmed that the fill state of the DPF was similar between these three repetitions at different ANR, and therefore, the distributions were not affected by a change in the DPF filtration efficiency.
Figure 2. Nonvolatile number-weighted size distributions of the HDE (lab1) (left-hand panel) and the HDV (lab2) (right-hand panel) exhaust under different operating conditions and urea feed factors. A 3-size bins average was employed to facilitate comparisons.
3.3. Charge state
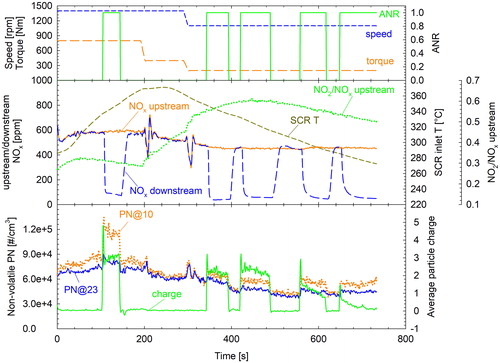
compares the average particle charge of the HDV exhaust during three transitions from 1100 to 1650 Nm at 1000 rpm, for different amounts of urea dosing. Focusing on the 1100 Nm part, in the absence of urea, the calculated average charge of the exhaust was +0.06 elementary charges (e) at 1100 Nm, indicating that particles are practically neutral. A distinctly higher average particle charge was measured when urea injection was activated, the quantity of which was found to increase with the SCR inlet temperature. A relatively constant charge of +0.15 e (stoichiometric dosing ANR = 1) and +0.3 e (overdosing ANR = 2) was measured at the beginning of the 1100 Nm mode where the inlet SCR temperature remained below ∼310 °C. As the inlet SCR temperature started increasing, so did the average particle charge reaching +0.85 e (stoichiometric dosing) and +1 e (overdosing) before switching to 1650 Nm. The inlet SCR temperatures were 10 °C higher when overdosing, owing to the different preconditioning of the vehicle between the two tests.
Figure 3. SCR inlet temperatures (dashed lines) and average particle charge of the HDV exhaust (lab2) during a torque ramp from 1100 to 1650 Nm, at three different urea feed factors. The gray vertical line at 1200 s illustrates the instance at which engine torque increased from 1100 Nm to 1650 Nm, which also resulted in a step increase of the average particle charge.
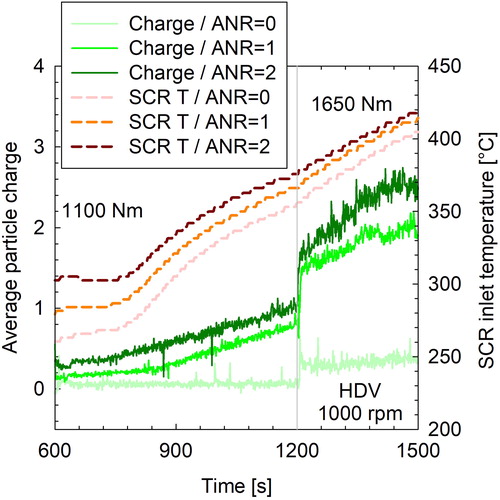
A step increase in the average charge from +0.85 e to +1.5 e and from +1 e to +1.7 e for stoichiometric dosing and overdosing, respectively, was observed in the transition from 1100 to 1650 Nm at 1200 s. A much smaller step increase in the average charge was also observed at the same transition point (1200 s) in the test when the urea was deactivated, although in that case this corresponded to ∼2 fA change (from 1.5 fA to 3.5 fA) in the electrometer readings. This could reflect an electrometer drift associated with a change in the carrier gas composition (i.e., increase in exhaust water content at the increased load). With urea activated, however, the electrometer readings were well above the noise levels, shifting from ∼60 fA to ∼90 fA. The average particle charge increased gradually during the remaining of the 1650 Nm test, as did the SCR temperature, reaching +2 e (at 410 °C) and +2.5 e (at 420 °C) for stoichiometric dosing and overdosing, respectively. The baseline (ANR = 0) 10 nm CPC concentrations at 1650 Nm were ∼40% lower from those at 1100 Nm ( and ). Since these baseline particles are practically neutral (< +0.25 e), their concentration drop from 1100 Nm to 1650 Nm would result in a lower contribution to the average particle charge. While this background concentration drop may have been a major contributor to the sharp average charge shift, it is also possible that the acquired particle charge can also be affected by the exhaust chemistry. No information is available on the composition of the exhaust reaching the SCR of the HDV.
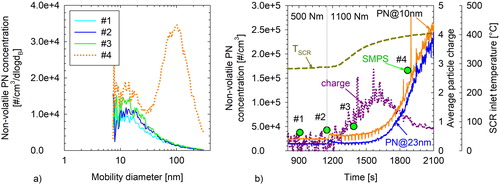
During the chassis torque ramp test of the HDV at lab3, a passive regeneration event took place during the transition from 1000 rpm/500 Nm to 1000 rpm/1100 Nm. The ANR was set to 1 in this test. Before this point, the measured size distributions exhibited a similar shape to that observed at lab2 with a distinct mode in the 10–20 nm range (first three scans in ). The oxidation of the collected soot in the DPF and the associated reduction in the filtration efficiency resulted in an increase of the nonvolatile PN and the appearance of a second accumulation mode peaking at ∼100 nm. The 10 nm mode was marginally affected by the passive regeneration with its concentration and distribution remaining relatively stable. The average particle charge of the HDV exhaust was also measured during this test (). As soon as the inlet SCR temperature exceeded ∼310 °C, the average particle charge started increasing from background levels (±0.4 e for the dilution and electrometer flow rate employed in the specific experiments – SI Figure S1) reaching a maximum of ∼+2 e charges at 1600 s. The nonvolatile PN concentrations and size distributions remained relatively stable during this period (1200–1600 s), despite the increase in average particle charge. After 1600 s, the average particle charge started decreasing, reaching +0.8 e at the end of this mode. This decline in particle charge coincided with a sharp increase of nonvolatile PN emissions and the appearance of a distinct second mode peaking at ∼100 nm. This emission behavior reflects the increased penetration of soot particles following the regeneration of the DPF. These soot particles are well documented to exhibit a bipolar charge distribution, being therefore on average approximately neutral (Maricq Citation2006). As their relative contribution to exhaust nonvolatile PN increases, the average particle charge of the total nonvolatile particle population is therefore decreasing.
Figure 4. Nonvolatile particle number emissions, average particle charge and inlet SCR temperature (right panel) of the HDV (lab3) during a torque ramp from 500 to 1100 Nm. Dots illustrate the SMPS total number concentration and the scan start time of the four sequential (#1 to #4) number-weighted size distribution measurements shown on the left panel.
Dedicated tests were performed with the HDE at lab1 to gain some more insight on the charge level of the particles formed in the SCR system (). The engine was first run at 1400 rpm/800 Nm for ∼200 s to heat up the SCR and then first the load (400 Nm) and subsequently both the speed (1100 rpm) and load (200 Nm) were reduced. These shifts led to a reduction of the temperature but also in changes in the relative fractions of NO and NO2 at the inlet of the SCR. Urea injection was activated over specific segments of the test at stoichiometric quantities. Before this test, the engine was conditioned at 1400 rpm/800 Nm with urea injection deactivated to consume any NH3 stored in the SCR.
Figure 5. Average particle charge and nonvolatile PN concentrations measured with the 23 and the 10 nm CPC (bottom panel) over a sequence of steady state modes during which urea dosing was switching between stoichiometric (ANR = 1) and zero (ANR = 0) concentrations (top panel). The corresponding temperature, NOx concentrations measured upstream of the SCR and NO2/NOx ratios at the entrance of the SCR are shown in the middle panel.
When no urea was injected, the average particle charge remained at zero levels under all operating conditions (i.e., first 100 s, 150–340 s). As soon as urea was injected in the SCR, both the charge and the readings of the 10 nm CPC increased (i.e., 100–150 s, 350–400 s). Over the last low speed/load (1100 rpm/200 Nm) segment of the tests where urea injection was active, the relative charge was decreasing with decreasing the inlet SCR temperature and dropped to zero levels at inlet temperatures below ∼280 °C, while the nonvolatile PN concentrations recorded with the two CPCs remained relatively constant. The amount of urea injected over this section was stable within 0.5% owing to the stable NOx emissions. NOx conversion efficiency was in the order of 90% when urea injection was activated, which is suboptimal owing to the lack of stored NH3 and nonideal mixing within the SCR at the employed stoichiometric ANR. Ammonia concentrations measured downstream of the ASC were at noise levels. It is difficult to draw definite conclusion on the effect of exhaust chemistry (i.e., the relative fractions of NO and NO2) at the inlet of the SCR on the average particle charge. For example, during the urea injections at 350 s and 560 s, the NO2 to NOx ratios were very similar (0.57) but the average particle charge dropped from +2.2 e to +1.2 e as the SCR inlet temperature dropped from 340 to 295 °C. Still, the average charge was higher at the urea injection at 120 s (+3 e, 1400 rpm/800 Nm) compared to the urea injection at 350 s (+2.2 e, 1100 Nm/200 Nm) even though the exhaust temperature was very similar (∼345 °C). Care needs to be taken though in interpreting these results, since the average charge shown in corresponds to the weighted average of baseline neutral particles and charged particles formed in the SCR system. The baseline concentrations (ANR = 0 sections) were varying over the test and thus also affected the average exhaust aerosol charge. More research is necessary to understand the charging process.
Some size distribution measurements with the SMPS neutralizer bypassed were also performed to get some qualitative information on the particle charge at different size fractions. The HDE was run at 1400 rpm/400 Nm and left running at this condition until the inlet SCR temperature stabilized at 345 ± 2 °C. At that point, four SMPS scans were taken with the neutralizer in place setting alternatively the ANR from 0 (#1 and #3) to 1 (#2 and #4), shown in . The difference between the scans at ANR 1 and 0, shown in , indicates the distribution of particles formed while dosing urea.
Figure 6. Top panels: Number-weighted size distribution (a) of neutralized nonvolatile particles formed in the SCR of the HDE (lab1) at 1400 rpm/400 Nm (b) calculated as the difference between consecutive size-distribution measurements with urea dosing sequentially activated (at stoichiometric quantities, ANR = 1) and deactivated. Bottom panels: (c) inverted size distributions for ANR = 0 (blue line) and ANR = 1 (green line) and their difference (excess particles formed when injecting urea – orange line) under the same operating conditions with the neutralizer bypassed assuming transmitted particles carry a single positive elementary charge and (d) corresponding distributions of excess particles formed during urea activation for different constant charge levels (from +1 to +4).
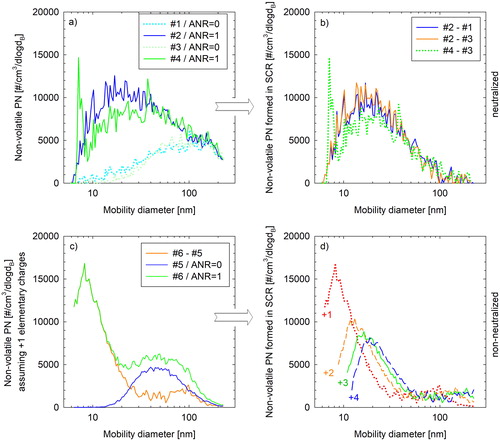
Two SMPS scans were subsequently taken with the neutralizer bypassed, with the urea deactivated first (#5) and then set at stoichiometric amount (#6). Inversion of the corresponding raw SMPS signals under the assumption that all transmitted particles carry a single positive elementary charge yielded the distributions shown in . Given that engine exhaust particles exhibit bipolar distribution (Maricq Citation2006), this assumption cannot hold for the entire distribution. However, the difference between the two distributions (orange curve in ) would cancel out the contribution of engine exhaust particles and thus allow for the direct investigation of the charge level of the excess particles formed during urea injection. shows for example the resulting size distribution of excess particles forming during urea injection for +1, +2, +3 and +4 e charges. The larger the assumed particle charge, the larger the mode and the lower the peak concentration of the recovered distribution (panel d), although concentration changes are not so large for more the +2 charges. The true charge level should be the one resulting in the distributions recovered when neutralizer was installed (), and therefore, the charge level of particles entering the DMA was known. The assumption of +1 charges leads to an underestimation of distribution peak, suggesting that even the smaller particles formed (< 10 nm) carry more than a single particle charge. The calculated concentration levels for +2 or more charges were found to be at 70% (+2) to 60% (+4) of the true ones (panel b). Still, a fraction of the produced particles could not be detected owing to their large electrical mobility (recovered distributions in extend below the lowest detectable size of the SMPS). These results provide strong evidence that the formed particles are unipolarly charged.
4. Discussion and conclusions
The effect of SCR on the physical properties of the exhaust aerosol from two Euro VI technology heavy-duty diesel engines was investigated. It was found that urea injection leads to formation of nonvolatile particles. The produced particles cover a wide size range which spans from less than 10 nm to above 200 nm, but their mode peaks at or below 20 nm. Accordingly, these particles are partly detected by the regulated PN methodology, adding 0.35 × 10⁴ to 3.5 × 10⁴ #/cm3 for the engines and operating conditions tested. These concentrations correspond to a 2.2 × 10¹⁰ to 2.2 × 10¹¹ #/kWh emission rate range over WHTC (UNECE Global technical regulation (GTR) 4), that is up to approximately one-third of the current emission limit. A 10 nm CPC would measure 20% to 90% higher than the 23 nm CPC, with existing sampling systems, but still would only capture 45% to 60% of the total nonvolatile particle population owing to the high particle losses. These figures compare well to what has been reported in previous studies. Czerwinski et al. (Citation2015) investigated the effect of urea injection on a tandem DPF SCR aftertreatment system retrofitted on a 3 l Euro 4 engine. They reported that urea injection led to an increase of the nonvolatile particles below 70 nm and above 200 nm, although the effect was more dominant at the small sizes. Based on the reported size distributions, the associated increase in the entire nonvolatile PN was in the order of 5–7 × 10⁴ #/cm3. Similarly, Amanatidis et al. (Citation2014) reported a 5–10 × 104 #/cm3 increase in the nonvolatile particle number concentrations of a 2.2 l diesel engine, following ammonia injection on a SCR catalyst downstream of the retrofitted DPF. The mode of these particles was found to peak at 20 nm. Robinson et al. (Citation2016) reported a 460% to 610% increase in the regulated PN emissions of a 447 kW heavy-duty engine equipped with a DPF and SCR, over the WHTC. Based on the total particle counts reported, the contribution of particles formed in the SCR was in the order of 1011 #/kWh.
Urea overdosing did not further increase the concentration of particles being formed with stoichiometric dosing. This is in agreement with what Czerwinski et al. (Citation2015) observed in tests of a combined SCR DPF system. Similarly, Robinson et al. (Citation2016) reported a minor effect in regulated PN emissions when shifting from 1.1 to 1.5 ANR.
An important finding of the present work is that the particles formed during urea injection can become highly charged at high temperatures. The small difference in the onset during heat-up (∼300–310 °C) and cooldown (∼280 °C) suggests that the critical temperature is the actual temperature of the aftertreatment downstream of the injector and not the measured temperature at the inlet of the SCR. At temperatures below this threshold, the particles were found to be neutral. At higher temperatures, a positive charge was building up with increasing temperature. SMPS scans of non-neutralized samples provided strong evidence that the formed particles are unipolarly charged. Furthermore, even the smallest particles formed (sub-20 nm) exhibit very high mobilities suggesting that they carry 2 or more positive charges. These levels are much higher than what conventional positive corona chargers can produce at such sizes, and therefore, the charge carried will be higher than what expected. The presence of such highly charged nanoparticles would explain the overestimations observed by Schwelberger and Giechaskiel (Citation2018) and Giechaskiel et al. (Citation2018). The fact that the buildup of charges occurs at elevated exhaust temperatures would explain the non-consistent overestimations observed. Such overestimations were not observed to our knowledge in light-duty applications (Giechaskiel, Riccobono, and Bonnel Citation2015), potentially owing to the lower exhaust temperatures. Some sharp changes in the average particle charge were observed following changes in the operating conditions of the HDV. To a certain extent, this could be attributed to changes in the relative contribution of baseline neutral exhaust particles on the total population. However, it is still possible some other exhaust properties can affect the exact amount of charges being acquired. Yet, FTIR measurements upstream of the SCR of HDE showed that the concentration and relative fraction of NO2 and NO entering the SCR had a minor effect on the final charge state of the particles.
Both particle formation and charge buildup were fast processes, visible immediately following activation/deactivation of urea injection. This is in direct contrast to the results of Amanatidis et al. (Citation2014) where an up to 200-s delay from the start of ammonia injection until an increase of the particle numbers was observed at exhaust gas temperature of 300 °C at the SCR. However, at 420 °C the particle formation started before the NH3 was detected downstream of the SCR. While ammonia slip was not actively monitored in the present study, as samples were taken downstream of an ASC, Amanatidis et al. (Citation2014) reported no link between their observed delay in particle formation and the onset of ammonia slip. It is possible that the observed delay reported by Amanatidis et al. (Citation2014) reflects the challenges associated with handling of NH3.
The chemical composition of these particles was not investigated in this study. Robinson et al. (Citation2016) indicated potential particle formation mechanisms during the different phases of urea decomposition. However, this could not explain the findings of Amanatidis et al. (Citation2014) who reported particle formation even when directly injecting ammonia. For the same reason, it is not likely that the observed particles are originating (at least not entirely) from impurities in the urea solutions. Amanatidis et al. (Citation2014) suggested that they are ammonium sulfate and ammonium bisulfate particles, which can survive the 350 °C temperature of the volatile particle removers of the PN systems (Bao et al. Citation2016). Other by-products that can withstand high temperatures (such as ammelide and ammelines – Schaber et al. Citation2004) may also be forming. The mass of the produced particles is very low, owing to their very small size, and therefore can be comprised of trace amounts (in order of ppt) of NH3, NOx, SO2. Such low concentrations should be available even at stoichiometric dosing employed owing to the finite conversion efficiencies of the SCR (90%–95% in the HDE tests) and also due to non-homogeneous mixing of the injected urea. The assumption of gas-phase particle precursors is also supported from the marginal effect of overdosing on the distribution and concentration of the produced particles observed in the present and previous (Czerwinski et al. Citation2015; Robinson et al. Citation2016) studies. It would be expected that overdosing of urea would promote particle formation originating from impurities of urea decomposition. The fact that Amanatidis et al. (Citation2014) detected these particles even when applying cold dilution indicates that they are not artifacts forming during thermal treatment (Swanson and Kittelson Citation2010). Furthermore, since Amanatidis et al. (Citation2014) did not employ an ammonia slip catalyst, it seems that their formation takes place in the SCR catalyst. While their size range is optimal for filtration on DPF systems, DPFs in many aftertreatment configurations (especially in heavy-duty applications) are located upstream of the SCR and thus will be emitted in the atmosphere.
The reason for the acquisition of large positive charge at elevated exhaust temperatures is not clear. It is well established that droplets forming by spraying can become charged. Accordingly, if the produced urea droplets can solidify during the vaporization stage (i.e., due to pyrolysis – Robinson et al. Citation2016), they could maintain the droplet charge. The charge level is reported to depend on the liquid feed rate and the liquid conductivity (Vaaraslahti, Laitinen, and Keskinen Citation2002). Since the same urea solution was employed in the tests of each engine, the charge of the droplets would then mainly depend on urea dosing. However, doubling the urea dosing did not have a strong effect on the average charge of the HDV exhaust aerosol (). Similarly, the acquired charge of the HDE exhaust was found to strongly vary with SCR inlet temperature even at constant urea dosing (last section of ). Furthermore, the buildup of charges was not accompanied by any visible change in the size distribution. Therefore, it seems unlikely that the charge buildup originates from the spraying process. It is more likely that the charge builds up after their formation and is associated with changes in their chemistry at elevated temperatures. More research is needed to better understand the origin and nature of these particles to also help access their environmental and health hazards.
At the moment the technical requirements in the regulation of particle number systems and PEMS do not efficiently address particles at this size range (peaking at or below 20 nm). Shifting the counting efficiency curves toward a smaller cutoff size would be necessary although not sufficient to precisely quantify the concentration levels considering the losses in commercially available systems. Development of optimized laboratory and portable sampling systems for low particle losses would be necessary, the performance of which will dictate whether moving below the currently investigated 10 nm cutoff size would be possible (Giechaskiel et al. Citation2017). Alternatively, the addition of size information could allow for more precise quantification of the actual losses and thus concentration leading to better agreement between sampling systems exhibiting difference penetration characteristics. One straightforward approach that would also establish link to existing procedures would be the parallel measurement of concentration with a 23 nm and a lower cutoff size CPC, as described by Kittelson (Citation2017) or Giechaskiel, Lahde, and Drossinos (Citation2019).
Similarly, the existing regulation does not include provisions for the performance of instrumentation in detecting highly charged particles. This reflects the established perception that automotive exhaust aerosol is neutral on average (Maricq Citation2006). The regulation requires that all parts in contact with the sampled exhaust are antistatic, so electrostatic losses should not be of concern. Highly charged particles at sizes close to the detection limit of the measurement sensor may, however, affect the performance of the sensor. Heterogeneous nucleation can be enhanced in the case of charged particles, but this should not be of concern unless the detection limit is shifted below 5 nm (Camero-Castaño and de la Mora Citation2002). In the case of instruments utilizing unipolar corona chargers, the effect can be significant, especially considering that positive coronas are preferred owing to the reduced ozone formation. This is because their cutoff size characteristics are controlled from the charger efficiency curve which typically lies below +1 e for neutral particles smaller than 50 nm (Dhaniyala et al. Citation2011). When sampling particles carrying more charges of the same polarity, the charge will remain largely unchanged leading to an overestimation. This effect is illustrated in more detail on an accompanying paper that also describes some of the possible techniques to overcome this (Schwelberger et al. Citation2019). Accordingly, the regulation specifications should be amended to require that the instrumentation can properly condition the highly charged exhaust particles of heavy-duty diesel vehicles equipped with SCR systems.
Supplemental Material
Download Zip (257.4 KB)Related Research Data
References
- Amanatidis, A.,. L. Ntziachristos, B. Giechaskiel, A. Bergmann, and Z. Samaras. 2014. Impact of selective catalytic reduction on exhaust particle formation over excess ammonia events. Environ. Sci. Technol. 48 (19): 11527–11534. doi:10.1021/es502895v.
- Bao, J., L. Mao, Y. Zhang, H. Fang, Y. Shi, L. Yang, and H. Yang. 2016. Effect of selective catalytic reduction system on fine particle emission characteristics. Energy Fuel 30: 1325–1334.
- Brack, W., B. Heine, F. Birkhold, M. Kruse, and O. Deutschmann. 2016. Formation of urea-based deposits in an exhaust system: numerical predictions and experimental observations on a hot gas test bench. Emiss. Control Sci. Technol. 2 (3): 115–123. doi:10.1007/s40825-016-0042-2.
- Camero-Castaño, M., and J. F. de la Mora. 2002. Ion-induced nucleation: measurement of the effect of embryo’s size and charge state on the critical supersaturation. J. Chem. Phys. 117: 3345–3353. doi:10.1063/1.1492279.
- Czerwinski, J., Y. Zimmerli, A. Mayer, G. D’Urbano, and D. Zürcher. 2015. Emission reduction with diesel particle filter with scr coating (SDPF). Emiss. Control. Sci. Technol. 1 (2):152–166. doi:10.1007/s40825-015-0018-7.
- Dhaniyala, S., M. Fierz, J. Keskinen, and M. Marjamäki. 2011. Instruments based on electrical detection of aerosols. In Aerosol measurement. principles, techniques and applications, ed. P. Kulkarni, P. Baron and K. Willeke, 393–416. Hoboken, NJ: John Wiley & Sons.
- EEA. 2018. Air quality in Europe 2018. European Environmental Agency report. No 12/2018.
- Faustini, A., R. Rapp, and F. Forastiere. 2014. Nitrogen dioxide and mortality: review and Meta-analysis of long-term studies. Eur. Respir. J. 44 (3):744–753. doi:10.1183/09031936.00114713.
- Giechaskiel, B. 2018. Solid particle number emission factors of Euro VI heavy-duty vehicles on the road and in the laboratory. IJERPH 15 (2): 304. doi:10.3390/ijerph15020304.
- Giechaskiel, B., T. Lahde, and Y. Drossinos. 2019. Regulating particle number measurements from the tailpipe of light-duty vehicles: the next step? Environ. Res. 172:1–9. doi:10.1016/j.envres.2019.02.006.
- Giechaskiel, B., A. Mamakos, J. Andersson, P. Dilara, G. Martini, W. Schindler, and A. Bergmann. 2012. Measurement of automotive non-volatile particle number emissions within the european legislative framework: a review. Aerosol Sci. Technol. 46 (7): 719–749. doi:10.1080/02786826.2012.661103.
- Giechaskiel, B., F. Riccobono, and P. Bonnel. 2015. Feasibility study on the extension of the real driving emissions (RDE) procedure to particle number (PN). Chassis dynamometer evaluation of portable emission measurement systems (Pems) to measure particle number (Pn) concentration: phase II. JRC Science and Policy Report EUR 27451 EN. doi:10.2790/74218.
- Giechaskiel, B., M. Schwelberger, C. Delacroix, M. Marchetti, M. Feijen, K. Prieger, S. Andersson, and H. Karlsson. 2018. Experimental assessment of solid particle number portable emissions measurement systems (pems) for heavy-duty vehicles applications. J. Aeros. Sci. 123: 161–170. doi:10.1016/j.jaerosci.2018.06.014.
- Giechaskiel, B., J. Vanhanen, M. Väkevä, and G. Martini. 2017. Investigation of vehicle exhaust sub-23 nm particle emissions. Aerosol. Sci. Technol. 51 (5):626–641. doi:10.1080/02786826.2017.1286291.
- Guan, B., R. Zhan, H. Lin, and Z. Huang. 2014. Review of state of the art technologies of selective catalytic reduction of NOx from diesel engine exhaust. Appl. Therm. Eng. 66 (1/2): 395–414. doi:10.1016/j.applthermaleng.2014.02.021.
- HEI. 2017. Health Effects Institute. State of global air. Special Report; HEI: Boston, MA.
- Herner, J. D., S. Hu, W. H. Robertson, T. Huai, M.-C. O. Chang, P. Rieger, and A. Ayala. 2011. Effect of advanced aftertreatment for PM and NOx reduction on heavy-duty diesel engine ultrafine particle emissions. Environ. Sci. Technol. 45 (6):2413–2419. doi:10.1021/es102792y.
- Kittelson, D. 2017. Particle number measurements: correcting for losses at 10 nm or smaller. 2017 Cambridge Particle Meeting.
- Lee, S., Y. Cho, M. Song, H. Kim, J. Park, and D. Baik. 2012. Experimental study on the characteristics of nano-particle emissions from a heavy-duty diesel engine using a urea-SCR System. Int.J Automot. Technol. 13 (3):355–363. doi:10.1007/s12239-012-0033-4.
- Lee, C., Kwangchul, O., Kim, D., and Lee, C. 2007. A characteristics of particle number distribution for the urea solution injection to urea SCR system of commercial diesel engine for an emission regulation. SAE Technical Papers 2007-01-3455.
- Lehtoranta, K., H. Vesala, P. Koponen, and S. Korhonen. 2015. Selective catalytic reduction operation with heavy fuel oil: NOx, NH3, and particle emissions. Environ. Sci. Technol. 49 (7):4735–4741. doi:10.1021/es506185x.
- Maricq, M. 2006. On the electrical charge of motor vehicle exhaust particles. J. Aeros. Sci. 37 (7):858–874. doi:10.1016/j.jaerosci.2005.08.003.
- Maricq, M. 2013. Monitoring motor vehicle PM emissions: an Evaluation of three portable low-cost aerosol instruments. Aerosol. Sci. Technol. 47 (5):564–573. doi:10.1080/02786826.2013.773394.
- Qi, C., C. Asbach, W. Shin, H. Fissan, and D. Pui. 2009. The ffect of particle pre-existing charge on unipolar charging and its implication on electrical aerosol measurements. Aerosol Sci. Technol. 43 (3):232–240. doi:10.1080/02786820802587912.
- Robinson, M.A., Backhaus, J., Foley, R., and Liu Z. G. 2016. The Effect of Diesel Exhaust Fluid Dosing on Tailpipe Particle Number Emissions. SAE Technical papers 2016-01-0995.
- Schaber, P. M., J. Colson, S. Higgins, D. Thielen, B. Anspach, and J. Brauer. 2004. Thermal decomposition (pyrolysis) of urea in an open reaction vessel. Thermochim. Acta 424 (1–2):131–142. doi:10.1016/j.tca.2004.05.018.
- Schwelberger, M., A. Mamakos, M. Fierz, and B. Giechaskiel. 2019. Experimental assessment of an electrofilter and a tandem positive-negative corona charger for the measurement of charged nanoparticles formed in selective catalytic reduction systems. Appl. Sci. 9 (6):1051. doi:10.3390/app9061051.
- Schwelberger, M., and Giechaskiel B. 2018 Evaluation of portable number emission systems for heavy-duty applications under steady state and transient vehicle operation conditions on a chassis dynamometer. SAE Technical Papers 2018-01-0348.
- Swanson, J., and D. Kittelson. 2010. Evaluation of thermal denuder and catalytic stripper methods for solid particle measurements. J. Aeros. Sci. 41 (12):1113–1122. doi:10.1016/j.jaerosci.2010.09.003.
- UNECE Global technical regulation 4. Test procedure for compression-ignition (C.I.) engines and positive-ignition (P.I.) engines fuelled with natural gas (NG) or liquefied petroleum gas (LPG) with regard to the emission of pollutant. Accessed April 25, 2019. https://www.unece.org/fileadmin/DAM/trans/main/wp29/wp29wgs/wp29gen/wp29registry/ECE-TRANS-180a4e.pdf
- UNECE Regulation No. 49. Uniform provisions concerning the measures to be taken against the emission of gaseous and particulate pollutants from compression-ignition engines and positive ignition engines for use in vehicles. Accessed April 25, 2019. https://www.unece.org/fileadmin/DAM/trans/main/wp29/wp29regs/2013/R049r6e.pdf
- Vaaraslahti, K., A. Laitinen, and J. Keskinen. 2002. Spray charging of droplets in a wet scrubber. J. Air Waste Manag. Assoc. 52 (2): 175–180.
- Wang, S. C., and R. C. Flagan. 1990. Scanning electrical mobility spectrometer. Aerosol Sci. Tech. 13 (2): 230–40. doi:10.1080/02786829008959441.
- WHO. 2013. Review of evidence on health aspects of air pollution – REVIHAAP Project. World Health Organization Copenhagen, WHO Regional Office for Europe, 2013.