
Abstract
The Single Particle Soot Photometer (SP2) is an instrument for quantifying the refractory black carbon (rBC) mass of individual aerosol particles. It heats the particle’s rBC component to vaporization and quantifies the resulting visible thermal radiation to infer rBC mass. For purely technical reasons, SP2s are unable to quantify rBC mass beyond an easily adjustable limit due to eventual saturation of the electronics that record the visible light signals. Here, we evaluate an extrapolation algorithm to estimate rBC masses exceeding this upper limit in an SP2. The algorithm is based on identifying the crossing points of linear fits to unsaturated data, and using the duration of the saturated data to constrain potential errors. We find that extrapolation performance is quite insensitive to instrument parameters including laser intensity, rate of data acquisition, and particle speed through the laser. However, this approach increases uncertainty on the detection limit of the instrument, and is hence only useful in unknown aerosols for very limited extrapolation to approximately a factor of 1.5 increase in the upper mass range, corresponding to a 15% increase in the upper diameter limit. This increased range small enough that early identification of meaningful saturation during measurement campaigns remains the only tenable approach to robustly characterizing rBC mass size distributions and, in some cases, rBC mass concentrations.
Editor:
1. Introduction
Black carbon, an aerosol material of interest for its climate and air quality impacts, is a difficult aerosol species to quantify in part due to its refractory nature, its lack of solubility, and its complex and dynamic morphology (including internal mixing with solid and liquid materials) (Bond et al. Citation2013). Many of these issues have been overcome by the single particle soot photometer (SP2, Droplet Measurement Technology, Inc.), which, since its commercial release in 2003, has increasingly been applied to determining black carbon mass concentrations and size distributions around the world. The SP2 heats the black carbon (more precisely the “refractory black carbon” or rBC [Petzold et al. Citation2013]) component of individual particles to vaporization with an IR laser, whereupon quantification of emitted thermal radiation can be used to infer rBC mass (Stephens, Turner, and Sandberg Citation2003). SP2 performance has been carefully assessed (Slowik et al. Citation2007; Cross et al. Citation2010; Laborde et al. Citation2012), yet the instrument remains challenging to apply rigorously to scientific questions due to its complexity and the possible pitfalls that can arise from choices in instrument setup. Here, we focus on signal saturation in the SP2. The issue arises because the wide range of rBC single-particle mass, and hence thermal radiation signal intensity, that is of interest to researchers can exceed the range of digitization supported by the SP2. Briefly, a linear mapping of signal intensity to voltage results in saturation when the voltage exceeds the upper range of the SP2 digitizer. This is a technical issue that must be understood and dealt with in every application of the SP2.
The smallest rBC masses of scientific interest in the atmosphere are approximately 0.007 fg. This corresponds to a single monomer of 20 nm volume-equivalent diameter, VED, assuming 1.8 g cm−3 void-free density, and is the smallest unit of rBC we know of in the atmosphere (Strawa et al. Citation1999; Dobbins and Megaridis Citation1987). Typical atmospheric size distributions (not measured at tailpipes, or directly at emission point sources) tend to fall a consistent larger range, with most rBC mass between approximately 120 and 300 nm VED (∼2–20 fg). Meanwhile, 20 nm VED rBC is far below the demonstrated detection range of the SP2. A practical low end of detection of the SP2 might reasonably be identified as approximately 80 nm VED (0.5 fg), a general limit identified in the laboratory (Schwarz et al. Citation2010) and attributed to limitations on heating of small rBC masses given the maximum laser intensity typically available in the SP2. The high end of the mass range for rBC is at least approximately 1.8 µm VED (∼5000 fg) where rBC has been observed in snow melt (Schwarz et al. Citation2013). Note that over most of the rBC mass of the atmospheric accumulation-mode, the scaling of thermal radiation to rBC mass is linear, while in the larger mass range (but beginning at rBC masses as small as ∼20 fg), the thermal emission signal falls off from the linear relationship as particle shielding becomes relevant (Moteki and Kondo Citation2010). Hence, additional complications beyond the saturation topic addressed here are associated with analysis of larger rBC, and with non-rBC materials that incandesce in the SP2 such as iron oxides (Yoshida et al. Citation2016).
The electronic gains in the SP2 detection system are typically set to allow quantification of smaller subsets of the potential range presented above. For example, the NOAA SP2 typically flies on aircraft with an upper limit of approximately 550 nm VED; the University of Tokyo SP2 typically flies with an upper limit of approximately 850 nm VED (Katich et al. Citation2018; Koike et al. Citation2014), both allowing quantification of approximately 90% of the remote-airmass accumulation-mode rBC mass. The literature also contains examples of substantially lower saturation points. For example (Baumgardner et al. Citation2008), reported a upper limit of approximately 190 nm VED rBC in an airborne deployment, which likely allowed direct quantification of approximately 50% of the typical mass range. (Sharma et al. Citation2017) reported on data from a ground-based SP2 obtained in 2015 with an upper limit of approximately 225 nm VED, allowing slightly better than 50% typical quantification (after some time the detector gain was decreased to increase the upper limit of quantifiable rBC mass to approximately 530 nm VED, thereby allowing more robust quantification of the accumulation mode rBC concentration).
A ceiling on rBC-mass information at the larger end of the SP2 detection range has different impacts on the detection of total rBC mass loadings depending on the size distribution of the target aerosol, which varies from situation to situation. For example, urban pollution can have small rBC size distributions, reaching down to mass median diameters (MMDs) of approximately 120 nm VED (∼2 fg) in Seoul (Lamb et al. Citation2018); in those cases, the contributions of rBC particles larger than approximately 500 nm to the total rBC accumulation mode is generally small. On the other hand, mixed burning (e.g., in China [Wang et al. Citation2014; Wu et al. Citation2017]) and large fires (e.g., Perring et al. Citation2011) produce modes of rBC with large MMDs in the approximately 600 nm (∼200 fg) range; here, an upper limit of 500 nm VED is clearly lower than desirable in determining the rBC concentration. In laboratory experiments, it is quite possible to restrict rBC mass content to much narrower size ranges, where a given upper limit may or may not be an issue. Hence, the optimal choice of gain (equivalently saturation level) can vary widely depending on the scientific focus of the research, and the danger of choosing an unfortunately low saturation point is real.
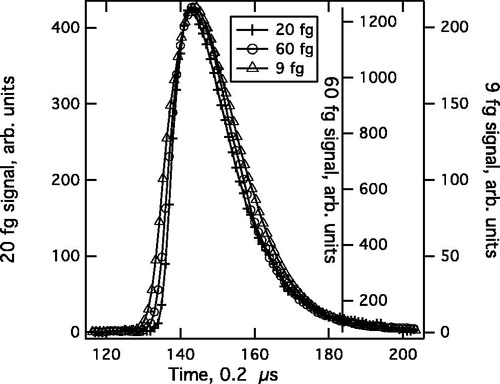
The thermal radiation signals associated with rBC and recorded by the SP2 in a time-resolved fashion share superficial similarities independent of rBC mass and morphology (Bambha and Michelsen Citation2015). shows typical signal traces for three rBC-containing particles of different masses (over a range of ∼ a factor 7), with their thermal signals aligned in time. On the basis of the strikingly similar shape of the time-resolved signals for the different masses, we present and assess a simple extrapolation algorithm for particles with the “tops” of the signals saturated in either the SP2 digitizer or detection electronics. This anticipates researcher needs to “recover” data obtained with significant saturation due to SP2 limitations. Section 2 provides details about SP2 detection and data recording, Section 3 explains the extrapolation and assesses its limitations. Section 4 summarizes our recommendations based on this analysis.
Figure 1. Time-resolved thermal radiation signal from three different rBC-containing particles of different masses. The plot shows the similarity in signal shape; this shape is approximately seen for all rBC-fractions, with the rare exceptions noted in the text. Note that changes in laser intensity, particle speed through the laser, and measurement pressure can all perturb these signals.
2. SP2 quantification of thermal radiation
The SP2 detection system, which is described in detail in the literature cited above, is quite simple. In this section, we provide only the necessary details to understand the limitations of this system, and their implications for scientific measurements.
Most SP2s detect light in four different detectors. Infrared (IR) light scattered from the laser (“scattering” data) is collected with an avalanche photo-diode detector (APD). A quadrant APD (Gao et al. Citation2007), also detecting IR light, provides position-sensitive information. Two photomultiplier tubes (PMTS) detect thermal radiation in two visible wavelength bands. Each detector is coupled to active electronics to convert the light intensities into voltages. The gain of this initial translation of light-intensity to voltage at the detector boards is controlled either via a potentiometer, or via an analog voltage in the instrument, and is easily changed. The voltages are then digitized with a multichannel high-speed digitizer for storage. The SP2 acquisition software scans buffered data from two of the detection channels for occasions in which the observed signal exceeds a threshold value; when this occurs, a short, time-synched segment of data from each channel is saved to disk for later analysis. Typically, triggering occurs on one scattered light channel, and one incandescent light channel.
For older SP2s, a four-channel digitizer with 12 bits precision and 5 MHz sampling rate was used. New SP2s use an 8-channel digitizer with 14 bits precision and a 2.5 MHz sample rate. The 8-channel systems are typically used with the same four-channels of light as the older SP2 (i.e., scattered light, position-sensitive detector, red-band visible light, blue-band visible light), but with high- and low-gain stages for each detector. Hence, the 8-channel SP2 more easily allows a wider range of light-intensity to ultimately be digitized and stored, but the main saturation problem described above is still a challenge. Note that a variety of approaches to differentiating the two different visible-light detectors to provide color-temperature information has been used over the years, but the details of detector wavelength sensitivity are separate to the saturation issue.
In the early days of the SP2, APDs were used to sense the visible thermal radiation emissions from particles. The low end of the detection range was set by the noise floor of these detectors, and gain was simply set low enough that detector noise did not make up a significant fraction of the dynamic range. When PMT detectors came into use (e.g., Schwarz et al. Citation2008), it became possible to increase detector sensitivities well beyond those appropriate for the physical lower limit of detection of the SP2 asserted by laser intensity limitations. As the smaller signals were more strongly amplified, so were the larger ones, resulting in increased potential for rBC mass “ceilings” substantially lower than optimal. (Schwarz et al. Citation2008) chose to set NOAA SP2 PMT gain only slightly (approximately a factor 5) over the original APD settings, and thereby achieved a range of approximately 1–200 fg (∼100–600 nm VED). This range allowed quantification of approximately 90% of the accumulation mode BC mass, but without the ability to size smaller or larger rBC. Note that, depending on SP2 setup, it is possible to saturate the detector voltage output before saturating the digitizer. The effect of the saturation on the analysis would be the same, if recognized. Saturation before the digitizer may not be noticed by analysists unless the raw data is examined; saturation at the digitizer results in data recorded with one saturation value, and a raised flag in the acquisition software (which may or may not be used in assessing/processing data).
To date, there have been two approaches to dealing with saturated incandescent SP2 data, neither of which are appropriate when substantial portions of the rBC mass concentration lie in sizes above the detection limit. Baumgardner et al. (Citation2008) associated the upper limit rBC mass from nonsaturated detection to the particles that saturated the digitizer. A benefit of this approximation is that an unknown fraction of the mass associated with the saturating particles was accounted for, and hence a higher lower-bound on concentration could be formed than without their inclusion. An early method (Schwarz et al. Citation2006) has been to analyze only the particles in which saturation did not occur. In this way, only particles that are well characterized are considered, and the limits of the data (i.e., the range of detection) are very clear. Clear limits on the data range are fundamental to allowing extrapolation of concentration to the entire population based on observation of the size distribution of the aerosol, as is now commonly done to estimate accumulation-mode rBC loads.
3. Extrapolation of the SP2 thermal radiation signal
When a significant (or potentially significant) fraction of rBC mass is associated with saturated detection events, it would be useful to be able to reliably extrapolate mass values from unsaturated data. Inspired by the similarity of the time-dependent evolution of incandescent signals independent of rBC mass shown in —which is a consistent feature of SP2 detections—we consider an extrapolation as presented below
3.1. Simple extrapolation approach
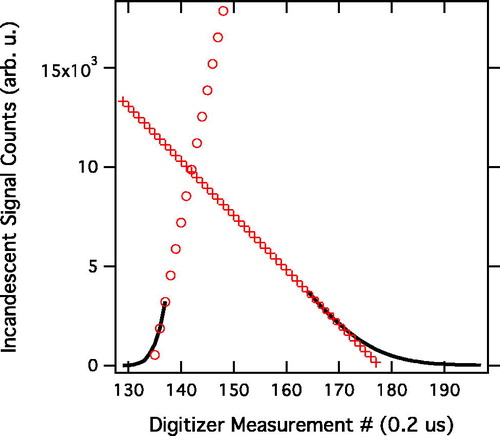
A conceptually simple extrapolation method is shown in . The two data points immediately before (after) saturation are used to generate forward (lagging) linear extrapolations over the saturated data time span. The signal intensity at the intersection of the two extrapolated lines provides the extrapolated value. A more complex extrapolation based on a Gaussian curve extrapolation over the saturated region was unable to consistently converge to reasonable extrapolation value and, hence, was discarded.
Figure 2. Simple extrapolation of the incandescent signal (black solid line, with saturated data removed). The forward linear extrapolation of the leading edge of data is shown with open circles, while the lagging linear extrapolation is demarked with crosses.
3.2. Evaluation of the extrapolation
To evaluate the extrapolation’s utility, we compare extrapolated to observed peak heights in two different scenarios. First, we examine a “synthetic” case, in which the data associated with the highest-intensity portions of unsaturated signals are removed to allow testing of the algorithm. The approach is useful for addressing extrapolations within a range of rBC mass that is fairly typical (i.e., for addressing saturation in the typical ambient accumulation-mode of rBC). Second, we use a “large particle” case, in which data were obtained with an extra incandescent detector operating with lowered gain. This case is useful for addressing extrapolations in a range of rBC mass larger than typical in the atmosphere, such as has been observed on occasion in the atmosphere in China (Wang et al. Citation2014; Huang et al. Citation2011), and in snow (Schwarz et al. Citation2013).
The left side of shows the extrapolated peak height for individual detection events plotted against the actual incandescent peak height determined from the same channel. The signal was synthetically saturated at 600 counts, allowing assessment of extrapolation accuracy up to a factor of approximately 6. In this case, no saturated data (such as would occur for signals above ∼3800 counts on this detector) were included. As can be seen in the graph, particles with very short segments of saturated data (less than ∼4 data points) lie very close to the one-to-one line. A priori, we would expect the extrapolation to over-estimate the actual peak height of the signal, because actual signals have a rounded interior angle at the transition from increasing to decreasing signal. This trend is obvious in the figure up to actual peak height of approximately 1500 counts. At very small extrapolations, also as intuitively expected, the number of saturated points increases with increasing amplitude above the saturation level. However, this relationship does not extend in robust fashion to longer extrapolations; at close to approximately 1000 counts peak height we see some points associated with 20 or more saturated data points, and others with substantially fewer. At higher extrapolations (loosely correlated with higher numbers of saturated data points per detection), the high-bias relative to the actual peak height disappears, and a low bias region appears.
Figure 3. Scatter-plots of extrapolated to actual peak height for detection events. Dashed black lines indicate perfect extrapolation (i.e., the gain relationship between the detectors used for the vertical and horizontal axes). Left: the case of synthetically saturated data. Right: The large-particle case. The color scale indicates the number of 0.2 µs data points that were saturated for each detection point. Unsaturated detections are indicated by black markers.
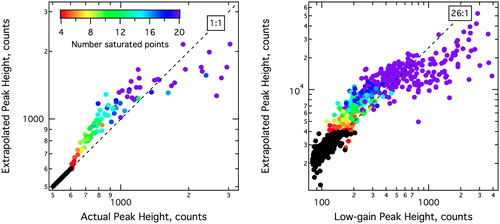
Note the strikingly similar behavior in the “actually saturated large particle” case (right side of the figure), for more massive rBC particles quantified with the additional low-gain detector (gain 1/26th of the higher-gain detector used here and on the left panel of ). Here, the black points showing un-extrapolated detections show scatter as a result of evaluating peak-heights from different detectors; the different gains are also reflected in the approximate slope of these points. However, the initial trends of high bias for smaller extrapolations followed by a switch to low bias for longer extrapolations are the same as in the synthetic case.
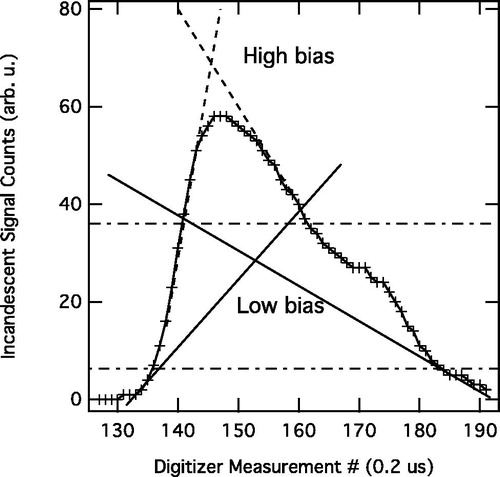
An explanation of the high bias behavior, which is appropriate for both test cases shown above, has already been given, and is visualized for a sample detection in . Alternately, low-biases arise due to longer duration saturations with significant curvature in the leading and lagging unsaturated data. The curvature of the leading-edge signal is likely in part a reflection of the non-uniformity of the SP2 laser intensity. The laser has a Gaussian profile, but almost all rBC-containing particles reach peak incandescence before reaching the center of the laser. Thus, the onset of thermal emission almost always occurs at a lower laser intensity than the maximum intensity experienced by particles during a detection.
Figure 4. A detection event showing a shoulder likely due to penetration into a lower intensity regime of the laser. Shown are extrapolations for two different cases of saturation. A modest saturation showing a high bias, and a more extreme saturation associated with low bias.
There are two mechanisms that can cause curvature in the lagging signal occurring as an rBC fragment is vaporizing. As discussed previously (Stephens, Turner, and Sandberg Citation2003; Schwarz et al. Citation2010), the rBC absorption cross-section scales as its mass, yet the loss of energy via conduction scales as its surface area. Hence, as rBC is vaporized in the laser and loses mass more quickly than surface area, vaporization will slow due to reduced net power input even as laser intensity may be increasing (relatively slowly).
The second mechanism is appropriate for particles that persist into regions of decreasing laser intensity. Note that the duration that an rBC fragment survives the laser depends on the mass and specific composition of the rBC component and any internally mixed material, particle morphology [which can influence vaporization rate (Bambha et al. Citation2013)], the ambient air pressure, and the absolute laser intensity. Particles associated with longer durations of saturated data tend also to be more massive, and require more energy to be vaporized than smaller particles. Hence, the largest particles survive passage through the center of the laser, and experience decreasing laser intensity during the tail of their emissions. The result of both the reduced mass/surface area ratio and decreasing laser intensity is a reduction in vaporization rate, first leading to a “plateauing” of the incandescent signal due to relatively constant rBC mass, as can clearly be seen in , where at around measurement point 165 a reduction in vaporization rate occurs. This will be followed by the cessation of vaporization and a decrease in particle temperature (and hence incandescent emissions), as is seen in at measurement point approximately 180. Inspection of the duration of the incandescent signal shown in the figure indicates that the signal lasted over a period of time corresponding to more than one-half of the Gaussian full-width half-maximum of the laser, supporting the idea that significant changes in laser intensity would occur on the time-scale of the signal.
3.3. Extrapolation sensitivity to experimental parameters
Laser intensity, rBC-containing particle speed through the laser, and air pressure do not affect the relationship of incandescent peak-height to mass for rBC-containing particles that reach vaporization temperature ( Schwarz et al. 2006, Citation2010 ). However, it is not clear that the extrapolation technique would share this insensitivity, as it depends on the rate of change of the incandescent signal, which does depend on these parameters. These issues have been explicitly tested in the laboratory using the “large particle” setup. Particle speed and laser intensity were changed over ranges (factors 1.40 and 2.6, respectively) wider than those typically used for SP2 measurements. The influence of air pressure, which affects convective energy loss rates, is assumed to be similar to that of laser intensity change (i.e., a direct change in net power absorption by rBC-containing particles). These tests were conducted on particles nebulized from water to provide good stability in the aerosol characteristics. The extrapolations were binned by peak-height range from the low-gain detector, and, unexpectedly, showed no significant deviations amongst themselves for all mass ranges with number statistics sufficient to produce a robust average.
shows the average extrapolated peak incandescent signal value (in counts) obtained after an extrapolation of a factor approximately 2.5 from the saturating amplitude under various conditions. The statistical uncertainties associated with these values, as reflected by variations between repeated measurements under the same conditions, are as large as any variations that might have been due to changing conditions; in short, at the level of approximately 10% there is no dependence over the ranges tested. shows the extrapolated average values as a function of incandescent peak height measured with the low-gain channel. The gray area shows the values included in the table.
Figure 5. Extrapolated amplitudes under different SP2 operational setups. Solid markers are associated with higher particle speed through the laser while lined-markers are associated with slow speed. Red triangle and asterisks are at low laser power, green diamond and cross at medium laser power, and blue circles and hash-mark for high laser power. Duplicate measurements to assess variability are shown with the same markers. Error bars represent statistical error on the mean in each bin. The gray box delineates the data points presented in .
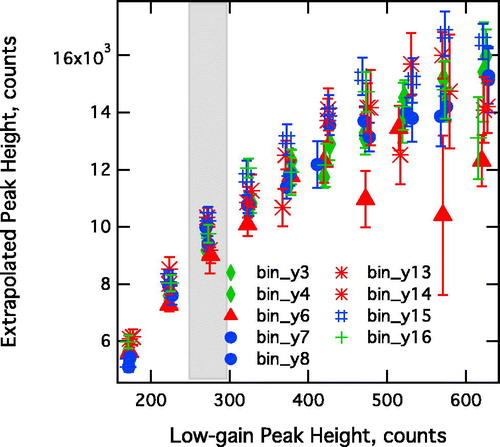
Table 1. Extrapolation averages observed for different SP2 operational set-ups.
To test sensitivity of the extrapolation to the data rate—namely to address possible differences between 8-channel SP2s sampling at 2.5 MHz, and 4-channel SP2s sampling at 5 MHz—the 5 MHz data were averaged to 2.5 Mhz. There was no substantial difference in performance due to this change, on a time-saturated basis; that is, for the same duration of saturated data, no systematic difference was observed between performance at 2.5 MHZ and 5 MHZ (although, half as many 2.5 MHz points were saturated at a given saturation time). This indicates that the performance of the extrapolation was not limited by the changes in the precision of identifying the leading and trailing slopes caused by changes in sampling frequency.
3.4. Useful limits of the extrapolation
As seen in the previous sections, the simple extrapolation presented here performs quite consistently over the different operational parameters explored. However, the extrapolation only has value if its potential range of error can be bounded from data in which the “true answer” is not known a priori. Both possible errors and the effect of the extrapolation on the detection limit of the instrumentation should be considered. Two types of error affect the results; first the systematic error resulting in mean bias between extrapolated and actual peak heights when sufficient statistics are available (such as discussed in the context of Section 3.2); second the random error that reflects the range of possible extrapolated value relative to actual for individual detections. Random error is most relevant when only small collections of saturated particle data are available.
The systematic error can be estimated via a polynomial fit to the extrapolated results for data for which the actual values are known; this is shown for binned data in the left-side panels of , over a range in which the extrapolation extended approximately a factor 4 beyond the unsaturated data. The multiple data points at each range of low-gain peak height come from the multiple sensitivity studies presented in Section 3.3. Over this range of extrapolation, the relative error () in the averaged extrapolation results peaks around +30%, and then drops as the bias shifts from positive to negative to approximately –20%. The pronounced high bias associated with short extrapolations (which are not completely equivalent to short saturation times) is due both to the consistent sign of the bias for every event relative to the unsaturated low-gain channel (i.e., random errors to lower value are excluded by the nature of the extrapolation), and the substantial impact of this error relative to the relatively small signal magnitude.
Figure 6. Errors associated with the bi-linear extrapolation. On the left, (a) and (c), errors are binned and plotted against peak height determined from the low-gain channel. On the right, (b) and (d), the plots show particle-by-particles errors plotted against the number of saturated measurement points corresponding to each detection (5 MHz data). The upper plots, (a) and (b), show relative error. Whiskers on (b) show the number fraction of particles with more than 50% relative error against a low-gain channel. (d) The range of random error extracted as a function of the number of saturated points.
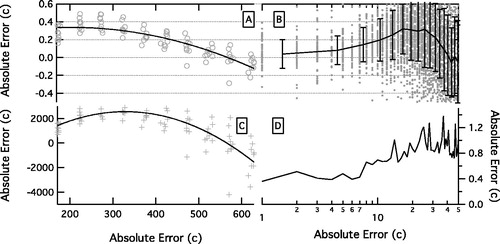
The plots on the right side of and have the number of saturated data points (0.2 µs data) on the horizontal axis to allow evaluation of errors independently from the low gain measurement. In , the individual points represent errors from individual particles, and the line shows the binned average relative error with whiskers denoting the number fraction of particles with relative errors larger than 50% (based again on the known low-gain detector signal). Now, the line and points show very small systematic error associated with saturations of just one or two data points length. This result does not contradict the previous observation that, for small extrapolations, the bias is consistently high, because the relationship between the number of saturated points and the actual peak height is quite noisy, as can be seen in the right side of . Still, bias is again shown increasing in a positive sense up to approximately 30% at 20–30 saturated points, then turning over to eventually become negative. shows the range of the extreme outliers; it is clear that the extrapolation becomes highly and consistently sensitive to random noise for saturation periods longer than approximately 25 data points (for this 5 MHz data, this corresponds to ∼5 µs).
Based on these results, it is possible to identify 5 µs saturation time as a reasonable limit for applying the extrapolation. This saturation time corresponds to particles over a wide range of size, with a mean extrapolation of a factor 2.5, and a median extrapolation of only 1.7. The median is considerably lower than the mean because of the importance of a small fraction of particles with significantly larger sizes at this maximum saturation duration, up to an extrapolation of a factor approximately 7. This result reflects the highly variable relationship between saturation duration particle size, which must arise due to the particle-by-particle variations of signal slope at the onset and end of saturation for different particles. explicitly shows the particle-size resolved fraction of particles associated with extrapolations for different maximum saturation. For particles with up to two saturated points, only a small fraction of particles associated with low-gain peak heights of approximately 130 counts are fit. Increasing the upper limit on the allowed length of saturation increases the fraction of particles, primarily at smaller sizes. For a maximal saturated data length of 25 points (here our 5 µs limit), approximately 90% of the particles in the peak-height range up to approximately 200 counts are associated with extrapolated values, but only approximately 40% of the particles with around 350 counts of low-gain peak height are.
Figure 7. The fraction of extrapolated particles for different choices of the limit on saturated signal duration, resolved by low-gain peak height as a proxy for particle size. The values in the legend indicate the maximal number of saturated points allowed in the extrapolation for 5 MHz digitization.
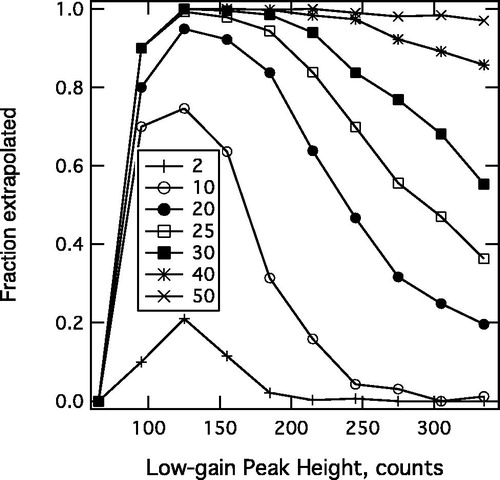
Unfortunately, the lack of a narrow relationship between saturation duration and particle size complicates interpretation of the data. As discussed in the introduction, analysis of particles only up to a well-defined maximum size allows full understanding of the size distribution and concentration of all the particles below that size (down to some minimum size). However, with this extrapolation, robust identification of the maximum size for detection is not possible beyond a very small range. The tradoff is that adoption of a cut off on saturated times is appropriate for limiting possible errors in extrapolation, but this severely limits confidence about the size range of detection for any extrapolations beyond a factor of 1.5 in peak height (∼15% in diameter).
4. Conclusions
An extrapolation algorithm for overcoming saturation in incandescent signals in a Single Particle Soot Photometer was presented and evaluated. On the positive side, the extrapolation was conceptually simple (Section 3.1), robust against changes in instrument parameters (Section 3.3), and performed reasonably well in estimating particle peak heights from detections including saturated data even at extrapolations of a factor 4. However, under conditions where the actual size distribution of an aerosol is not known a priori, the algorithm is of almost no utility because application of a reasonable constraint on the extent of the extrapolation (i.e., limiting the maximum duration of saturated data) results in significant ambiguity about the resulting detection limits of the instrument (Section 3.4). Hence, avoiding saturation remains a critical step in achieving acceptable coverage of the range of incandescence signal of interest. This can be achieved by prioritizing examination of data—both raw and processed—before and during acquisition to reveal any sub-optimal conditions, and revising detector gain as needed. Optimization of the quantification range of the instrument must occur in full consideration of the scientific goals of the measurements.
Disclosure statement
No potential conflict of interest was reported by the author.
References
- Bambha, R. P., M. A. Dansson, P. E. Schrader, and H. A. Michelsen. 2013. Effects of volatile coatings on the laser-induced incandescence of soot. Appl. Phys. B 112 (3):343–358. doi:10.1007/s00340-013-5463-9.
- Bambha, R. P., and H. A. Michelsen. 2015. Effects of aggregate morphology and size on laser-induced incandescence and scattering from black carbon (mature soot). J. Aerosol Sci. 88:159–181. doi:10.1016/j.jaerosci.2015.06.006.
- Baumgardner, D., R. Subramanian, C. Twohy, J. Stith, and G. Kok. 2008. Scavenging of black carbon by ice crystals over the Northern Pacific. Geophys. Res. Lett. 35:1–5. 10.1029/2008GL035764.
- Bond, T. C., S. J. Doherty, D. W. Fahey, P. M. Forster, T. Berntsen, B. J. Deangelo, M. G. Flanner, S. Ghan, B. Kärcher, D. Koch, S. Kinne, Y. Kondo, P. K. Quinn, M. C. Sarofim, M. G. Schultz, M. Schulz, C. Venkataraman, H. Zhang, S. Zhang, N. Bellouin, S. K. Guttikunda, P. K. Hopke, M. Z. Jacobson, J. W. Kaiser, Z. Klimont, U. Lohmann, J. P. Schwarz, D. Shindell, T. Storelvmo, S. G. Warren, and C. S. Zender. 2013. Bounding the role of black carbon in the climate system: A scientific assessment. J. Geophys. Res. Atmos. 118 (11):5380–5552. doi:10.1002/jgrd.50171.
- Cross, E. S., T. B. Onasch, A. Ahern, W. Wrobel, J. G. Slowik, J. Olfert, D. A Lack, P. Massoli, C. D. Cappa, J. P. Schwarz, J. R. Spackman, D. W. Fahey, A. Sedlacek, A. Trimborn, J. T. Jayne, A. Freedman, L. R. Williams, N. L. Ng, C. Mazzoleni, M. Dubey, B. Brem, G. Kok, R. Subramanian, S. Freitag, A. Clarke, D. Thornhill, L. C. Marr, C. E. Kolb, D. R. Worsnop, and P. Davidovits. 2010. Soot particle studies—instrument Inter-Comparison—project overview. Aerosol Sci. Technol. 44 (8):592–611. doi:10.1080/02786826.2010.482113.
- Dobbins, R. A., and C. M. Megaridis. 1987. Morphology of flame-generated soot as determined by thermophoretic sampling. Langmuir 3 (2):254–259. doi:10.1021/la00074a019.
- Gao, R. S., J. P. Schwarz, K. K. Kelly, D. W. Fahey, L. A Watts, T. L. Thompson, J. R. Spackman, J. G. Slowik, E. S. Cross, J.-H. Han, P. Davidovits, T. B. Onasch, and D. R. Worsnop. 2007. A novel method for estimating Light-Scattering properties of soot aerosols using a modified Single-Particle soot photometer. Aerosol Sci. Technol. 41 (2):125–135. doi:10.1080/02786820601118398.
- Huang, X.-F., R. S. Gao, J. P. Schwarz, L.-Y. He, D. W. Fahey, L. A. Watts, A. McComiskey, O. R. Cooper, T.-L. Sun, L.-W. Zeng, M. Hu, and Y.-H. Zhang. 2011. Black carbon measurements in the pearl river Delta region of China. J. Geophys. Res. 116:D12208. doi:10.1029/2010JD014933.
- Katich, J. M., B. H. Samset, T. P. Bui, M. Dollner, and K. D. Froyd. 2018. Strong contrast in remote black carbon aerosol loadings between the Atlantic and Pacific basins. 123 (23):386–395. 10.1029/2018JD029206.
- Koike, M., N. Moteki, P. Khatri, T. Takamura, N. Takegawa, Y. Kondo, H. Hashioka, H. Matsui, A. Shimizu, and N. Sugimoto. 2014. Case study of absorption aerosol optical depth closure of black carbon over the east China sea. J. Geophys. Res. Atmos. 119 (1):122–136. doi:10.1002/2013JD020163.
- Laborde, M., P. Mertes, P. Zieger, J. Dommen, U. Baltensperger, and M. Gysel. 2012. Sensitivity of the single particle soot photometer to different black carbon types. Atmos. Meas. Tech. 5 (5):1031–1043. doi:10.5194/amt-5-1031-2012.
- Lamb, K. D., A. E. Perring, B. Samset, D. Peterson, S. Davis, B. E. Anderson, A. Beyersdorf, D. R. Blake, P. Campuzano-Jost, C. A. Corr, G. S. Diskin, Y. Kondo, N. Moteki, B. A. Nault, J. Oh, M. Park, S. E. Pusede, I. J. Simpson, K. L. Thornhill, A. Wisthaler, and J. P. Schwarz. 2018. Estimating source region influences on black carbon abundance, microphysics, and radiative effect observed over South korea. J. Geophys. Res. Atmos. 123 (23):1–22. doi:10.1029/2018JD029257.
- Moteki, N., and Y. Kondo. 2010. Dependence of Laser-Induced incandescence on physical properties of black carbon aerosols: Measurements and theoretical interpretation. Aerosol Sci. Technol. 44 (8):663–675. doi:10.1080/02786826.2010.484450.
- Perring, A. E., J. P. Schwarz, J. R. Spackman, R. Bahreini, J. A. De Gouw, R. S. Gao, J. S. Holloway, D. A. Lack, J. M. Langridge, J. Peischl, A. M. Middlebrook, T. B. Ryerson, C. Warneke, L. A. Watts, and D. W. Fahey. 2011. Characteristics of black carbon aerosol from a surface oil burn during the deepwater horizon oil spill. Geophys. Res. Lett. 38:1–5. doi:10.1029/2011GL048356.
- Petzold, A., J. A. Ogren, M. Fiebig, P. Laj, S. M. Li, U. Baltensperger, T. Holzer-Popp, S. Kinne, G. Pappalardo, N. Sugimoto, C. Wehrli, A. Wiedensohler, and X. Y. Zhang. 2013. Recommendations for reporting black carbon measurements. Atmos. Chem. Phys. 13 (16):8365–8379. doi:10.5194/acp-13-8365-2013.
- Schwarz, J. P., R. S. Gao, D. W. Fahey, D. S. Thomson, L. A. Watts, J. C. Wilson, J. M. Reeves, M. Darbeheshti, D. G. Baumgardner, G. L. Kok, S. H. Chung, M. Schulz, J. Hendricks, A. Lauer, B. Kärcher, J. G. Slowik, K. H. Rosenlof, T. L. Thompson, A. O. Langford, M. Loewenstein, and K. C. Aikin. 2006. Single-particle measurements of midlatitude black carbon and light-scattering aerosols from the boundary layer to the lower stratosphere. J. Geophys. Res. Atmos. 111:1–15. doi:10.1029/2006JD007076.
- Schwarz, J. P., R. S. Gao, A. E. Perring, J. R. Spackman, and D. W. Fahey. 2013. Black carbon aerosol size in snow. Sci Rep 3:1356. doi:10.1038/srep01356.
- Schwarz, J. P., J. R. Spackman, D. W. Fahey, R. S. Gao, U. Lohmann, P. Stier, L. A. Watts, D. S. Thomson, D. A. Lack, L. Pfister, M. J. Mahoney, D. Baumgardner, J. C. Wilson, and J. M. Reeves. 2008. Coatings and their enhancement of black carbon light absorption in the tropical atmosphere. J. Geophys. Res. 113:D03203. doi:10.1029/2007JD009042.
- Schwarz, J. P., J. R. Spackman, R. S. Gao, A. E. Perring, E. Cross, T. B. Onasch, A. Ahern, W. Wrobel, P. Davidovits, J. Olfert, M. K. Dubey, C. Mazzoleni, and D. W. Fahey. 2010. The detection efficiency of the single particle soot photometer. Aerosol Sci. Technol. 44 (8):612–628. doi:10.1080/02786826.2010.481298.
- Sharma, S.,. W. R. Leaitch, L. Huang, D. Veber, F. Kolonjari, W. Zhang, S. J. Hanna, A. K. Bertram, and J. A. Ogren. 2017. An evaluation of three methods for measuring black carbon in alert, Canada. Atmos. Chem. Phys. 17 (24):15225–15243. doi:10.5194/acp-17-15225-2017.
- Slowik, J. G., E. S. Cross, J.-H. H. Han, P. Davidovits, T. B. Onasch, J. T. Jayne, L. R. Williams, M. R. Canagaratna, D. R. Worsnop, R. K. Chakrabarty, H. Moosmüller, W. P. Arnott, J. P. Schwarz, R.-S. S. Gao, D. W. Fahey, G. L. Kok, and A. Petzold. 2007. An inter-comparison of instruments measuring black carbon content of soot particles. Aerosol Sci. Technol. 41 (3):295–314. doi:10.1080/02786820701197078.
- Stephens, M., N. Turner, and J. Sandberg. 2003. Particle identification by laser-induced incandescence in a solid-state laser cavity. Appl. Opt. 42 (19):3726–3736. doi:10.1364/AO.42.003726.
- Strawa, A. W., K. Drdla, G. V. Ferry, S. Verma, R. Pueschel, M. Yasuda, R. J. Salawitch, R. S. Gao, S. D. Howard, P. T. Bui, M. Loewenstein, J. W. Elkins, K. K. Perkins, and R. Cohen. 1999. Carbonaceous aerosol (soot) measured in the lower stratosphere during POLARIS and its role in straospheric photochemistry. J. Geophys. Res. 104 (D21):26753–26766. doi:10.1029/1999JD900453.
- Wang, Q., J. P. Schwarz, J. Cao, R. Gao, D. W. Fahey, T. Hu, R.-J. Huang, Y. Han, and Z. Shen. 2014. Black carbon aerosol characterization in a remote area of Qinghai–Tibetan Plateau, Western China. Sci. Total Environ. 479–480:151–158. doi:10.1016/j.scitotenv.2014.01.098.
- Wu, Y., X. Wang, J. Tao, R. Huang, P. Tian, J. Cao, L. Zhang, K. Ho, Z. Han, and R. Zhang. 2017. Size distribution and source of black carbon aerosol in urban Beijing during winter haze episodes. 17 (12):7965–7975. doi:10.5194/acp-17-7965-2017.
- Yoshida, A., N. Moteki, S. Ohata, T. Mori, R. Tada, P. Dagsson-Waldhauserov, and Y. Kondo. 2016. Detection of light-absorbing iron oxide particles using a modified single-particle soot photometer. Aerosol Sci. Technol. 50 (3):1–4. doi:10.1080/02786826.2016.1146402.