
 ?Mathematical formulae have been encoded as MathML and are displayed in this HTML version using MathJax in order to improve their display. Uncheck the box to turn MathJax off. This feature requires Javascript. Click on a formula to zoom.
Abstract
Toxicological assessment of inhaled aerosols and their effects on respiratory tissue cells requires accurate measurements of particle delivery, properties, evolution, and deposition in the human respiratory tract. These measurements are affected by both anatomical features and physiological factors, such as thermal conditions in the respiratory system. We constructed a segmented cast model, based on a realistic geometry of the human respiratory tract, equipped with features to control the temperature of the air flow. We then evaluated the thermal equilibrium of the air flow through the cast using both experimental measurements and computational fluid dynamics modeling. Uniform temperature distribution in the cast shell was achieved using parallel connection of the cast segments to a thermal bath by flow splitter. Air temperature inside the cast was shown to require <1 min to equilibrate with the temperature of the cast during internal circulation of hot water. Air flow temperature was shown to equilibrate with the cast temperature in the mouth–throat region, and a uniform temperature distribution was achieved in the other segments, resembling the thermal conditions of respiratory flow in the human lung. We showed that the cast successfully represents the physiological thermal conditions of the human respiratory system.
1. Introduction
Toxicological assessment of aerosols is often performed in vivo to assess the biological effects of compounds on living organisms (Höfer et al. Citation2004). Legal and ethical mandates to reduce animal involvement in toxicological assessments following the 3Rs principle (replacement, reduction, and refinement) (Baumans Citation2004; Festing and Wilkinson Citation2007) have promoted the development of in vitro and in silico models to complement in vivo exposure systems (Holmes, Creton, and Chapman Citation2010). The applicability of such models depends on the extent to which they simulate the living system and represent physiologically relevant scenarios (Davila et al. Citation1998).
Inhalation exposes lung tissue cells to aerosols consisting of vapor in gas phase and dispersed particles in solid or liquid phases. Particle transport through the respiratory tract and deposition on airway surfaces depends on the particles physical characteristics (Hinds Citation2012; Srirama et al. Citation2012). Smaller particles are subject to interactions with the carrier gas molecules through Brownian motion (Gupta and Peters Citation1985); larger particles are not affected by such interactions, but their inertia and weight can drive them out of the flow stream and trigger deposition on respiratory tract walls (Crane and Evans Citation1977). The biological effects of particle deposition depend on the delivered dose of the substance, which is typically defined as the received particle mass per unit of time and surface area (Donaldson et al. Citation2002; Pöschl Citation2005).
The refinement of in vitro exposure systems offers increased capacity and reliability in studying direct aerosol deposition in cell cultures (Paur et al. Citation2011; Thorne and Adamson Citation2013; Majeed et al. Citation2014). To represent realistic conditions, these systems require adjustment of the aerosol concentration to achieve a delivered aerosol mass that is comparable with in vivo exposure conditions (Mülhopt et al. Citation2009). The estimated delivered aerosol mass is obtained using analytical and computational models (Comouth et al. Citation2013; Secondo, Liu, and Lewinski Citation2017). Recently Lucci et al. (Citation2018) developed a general model, not system specific, which has been thoroughly compared and validated with the in vitro exposure system measurements (Comouth et al. Citation2013; Fujitani et al. Citation2015).
Advances in computational fluid dynamics (CFD) have made it feasible to realistically estimate the retention of aerosol in the human respiratory tract under different inhalation regimes (Rostami Citation2009; Longest and Holbrook Citation2012; Rygg and Longest Citation2016). These computational models consider distinct deposition mechanisms such as impaction, diffusion, and gravitational settling, and can be applied for a wide range of particle sizes (Frederix et al. Citation2017). CFD models have been used with complex morphometric data from the human upper respiratory tract (Rahimi-Gorji et al. Citation2015; Frederix et al. Citation2018). In addition, a wide variety of aerosol properties have been modeled for various applications such as cigarette smoke particles (Zhang, Kleinstreuer, and Hyun 2012) and drug-delivery spray particles (Kimbell et al. Citation2007). Extended CFD models have also been developed to simulate aerosol evolution in the respiratory tract, namely the condensation/evaporation processes of liquid particles (Longest and Hindle Citation2010; Asgari, Lucci, and Kuczaj Citation2018). Despite extensive progress in the development of computational models, there are still challenges in model verification and validation under complex experimental conditions (Oldham Citation2006).
In parallel with CFD modeling, development of in vitro cast models enables researchers to measure the delivered aerosol dose in different regions of the respiratory tract such as trachea (Schlesinger and Lippmann Citation1976) and under various inhalation flow and aerosol exposure conditions (Chan and Lippmann Citation1980; Cheng, Zhou, and Chen Citation1999). The cast models are also used to verify the computational models and assess their accuracy (Longest and Vinchurkar Citation2007). Some cast models are based on idealized geometries of the tracheobronchial tree (Grgic et al. Citation2004b), such as the Weibel model (Yeh and Schum Citation1980). Idealization of the geometry, however, does not address the influence of the anatomical complexity on air flow and aerosol dynamics. Thus, cast models developed for realistic geometries use imaging tools such as computed tomography and magnetic resonance imaging (Grgic et al. Citation2004b; Lizal et al. Citation2015). Furthermore, anatomical variability of respiratory tract is taken into account using statistical analysis and geometry optimization (Borojeni et al. Citation2015). Most investigations to date have concentrated on the anatomical features of the human respiratory tract; less attention has been paid to reproducing physiologically relevant conditions such as temperature and humidity in an in vitro cast.
Studies by Ferron, Haider, and Kreyling (1985), Eisner and Martonen (Citation1989), Daviskas, Gonda, and Anderson (Citation1990) used 1D mathematical models and experiments to evaluate the temperature distribution in the human tracheobronchial system. Ferron, Haider, and Kreyling (Citation1985) approximated temperature and water vapor concentration in the human upper airways solving the 1D transport equations. Daviskas, Gonda, and Anderson (Citation1990) obtained the analytical solution for air flow temperature assuming a cylindrical geometry for different segments of the respiratory tract. Eisner and Martonen (Citation1989) developed a surrogate tracheobronchial system with a multicomponent physical model, in which the average Reynolds number value for the airflow within each respective compartment equals the value within the corresponding bronchial airway generation of Weibel’s model. They used the surrogate model to estimate the temperature in various segments of the surrogate bronchial system. The evaluation of temperature in the respiratory tract is particularly important for estimating liquid particles retention in the respiratory tract, as the particles are subject to influential interactions with the carrier vapor phase and condensation/evaporation processes.
We addressed some of the above-mentioned challenges by developing an in vitro respiratory tract cast model that is based on realistic anatomical features. The cast is designed to control the air flow temperature and maintain it at a constant and realistic level. This thermal-control feature is useful for conducting aerosol evolution and deposition measurements for evolving liquid particles. In this article, we present the cast development procedure, technical features, and validation by a combination of CFD modeling and experimental analysis of internal thermal equilibrium with and without air flow.
2. Materials and methods
The cast development procedure and our measurement methods are outlined in this section comprising the following steps: preparation of respiratory tract geometry, computer-aided design (CAD) of the cast, material selection for 3D printing, rapid prototyping technique, and experimental setup used for the cast assessment.
2.1. Respiratory tract geometry and cast development
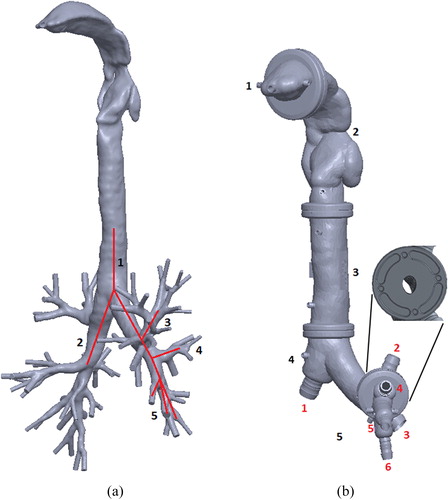
Three-dimensional (3D) cast geometry was based on the structure of the human respiratory tract (Zhang, Kleinstreuer, and Hyun Citation2012). shows the 3D reconstructed model of the human airways up to the ninth generation of the tracheobronchial tree. This geometry was used as a reference model for the CAD of the internal surface. The airway pathway was processed in MeshLab open source 3D processing software (ISTI-CNR, Pisa, Italy) and imported as a stereolithography file into SolidWorks 3D design software (Dassault Systèmes, Vélizy-Villacoublay, France). The external shell surface was constructed by applying an oversizing parameter on the initial geometry, and a Boolean operation yielded the internal shell surface. Channels for water circulation were designed inside the shell with additional Boolean operations. The structure obtained was split into five segments. Water connection interfaces were also designed in SolidWorks and added to each segment of the cast. The modular segmented format was designed to represent the mouth cavity, throat, trachea, first and second branch generations, and third to fifth branch generations of the tracheobronchial tree as shown in . The mouth inlet was designed as a cylindrical extrusion from the mouthpiece segment. Each cast segment has a cylindrical flange at the junction with its neighboring segment for assembly of the cast segments. Placeholders for four pins were designed at each junction to orient the segments correctly (, inset). The seals were designed to guarantee air-tightness at the junctions.
Figure 1. (a) The geometry of the human respiratory tract, obtained by computed tomography (Zhang, Kleinstreuer, and Hyun Citation2012). The red line indicates the branches selected for the in vitro cast up to the fifth generation. (b) CAD model of the in vitro cast. Tract segments are numbered in black; cast outlet connections are numbered in red. The figure inset magnifies a flange between two cast segments with pin placeholders to ensure correct orientation at assembly.
2.2. Water capillaries for temperature control
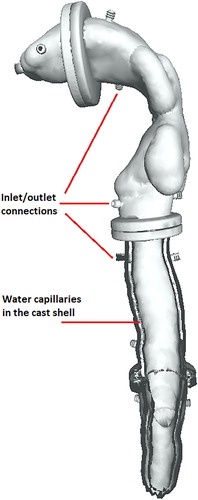
Water capillaries were embedded in the cast shell for thermal control. These capillaries were designed to circulate water from a thermal water bath at a specified temperature. The water capillaries were built into all cast segments covering a large surface area to facilitate heat exchange with the air flow inside the cast. Water capillaries were connected with inlet/outlet connections at the junctions between neighboring cast segments (see ). Water circulation between cast segments can be serial, with pipes connecting the inlets/outlets of neighboring segments, or a parallel connection of all segments directly to the thermal water bath using a flow splitter. shows the water capillaries and their connections in a cross-section of the geometry.
Figure 2. CAD model of the cast showing the inlet/outlet connections for water circulation and water capillaries inside the cast shell.
2.3. Material selection
The material selected for 3D prototyping should satisfy several property requirements, including high thermal conductivity and compatibility with various chemical compounds. The thermal conductivity of the material is vital to controlling the temperature of the air flow inside the cast using water circulation. High thermal conductivity of the resin material reduces the time required to reach thermal equilibrium between the circulating water in the cast shell and air flow through the cast. We therefore selected high-temperature resin from Formlabs (Somerville, MA, USA), as it satisfies the required high thermal conductivity and is compatible with 3D printing (Formlabs Citation2018). The mechanical tensile strength of the resin, 51.1 MPa, makes the printed cast robust to withstand the forces implemented during experiments. The thermal capacity of the material was assessed using differential scanning calorimetry. Thermal assessment was performed for both raw (uncured) and ultraviolet light (UV)-cured samples (). The raw sample was polymerized by sharp changes in heat flow during the first measurement cycle (). The UV light-cured sample did not polymerize with increased temperature indicating that it was fully polymerized in UV-curing process. To obtain the thermal capacity values, the measurements had to be calibrated using a well-documented reference material. We used sapphire as the reference. lists the calculated values. These values are in the range of heat capacity values for polymers, which is 1.0–2.5 J/g/°C. Finally, the solvent compatibility of the resin with different chemical compounds was tested by extended exposure of the resin to the target compounds reported in . The resin did not appear to degrade following contact with the chemical compounds, and its weight gain over 24 h of exposure was below 1%.
Figure 3. Differential scanning calorimetry measurements of heat flux against temperature for (a) raw material and (b) ultraviolet light-cured material.
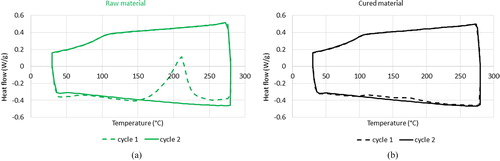
Table 1. Differential scanning calorimetry measurements of the resin heat capacity compared with the reference material (Sapphire) heat capacity.
Table 2. The solvent compatibility test of the resin exposed to the target chemical compounds.
2.4. 3D printing
3D printing of the cast was conducted using the stereolithography apparatus (SLA) technique with a Miicraft 100X 3D printer (Jena, Germany) for light-sensitive photopolymer resins. The technique is used to produce the cast in a layer-by-layer approach with photopolymerization, in which a 2D light pattern is used to form the molecules chain into polymers, building the 3D object (Hull Citation1986). The source of emitted light in this technique is a digital light projector. SLA printing provides a minimum print layer thickness of 10 µm indicating the smallest features of the geometry, which can be resolved in 3D printed object. This thickness is finer than the one provided by other technologies, such as fused filament fabrication. The high-temperature resin we selected is compatible with the SLA printing technique, and was used to print the cast ().
Figure 4. Three-dimensional cast printed using the SLA technique.
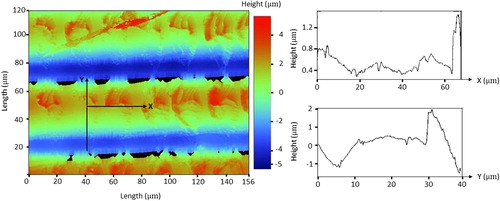
The cast is designed to be used for air flow measurements and aerosol exposure experiments, so the internal surface roughness of the printed cast is an important factor. We measured surface roughness with a Bruker optical profilometer (Billerica, MA, USA); shows the acquired data. The layer-by-layer fabrication of the cast is visible in the profilometry figure. The average surface roughness measured was approximately 0.55 µm and the maximum measured surface roughness was 3.54 µm indicating the final print resolution. The maximum roughness occurs in Y direction, where the profile covers the height of the deposited resin layer. The data indicated that the SLA printing method yielded a smoother cast surface than the fused filament fabrication technique, which offers an approximate average surface roughness of2 µm.
Figure 5. Surface roughness image (left) and measurements by optical profilometer (right). The surface pattern indicates the layer-by-layer fabrication by SLA.
2.5. Temperature and flow measurement setup
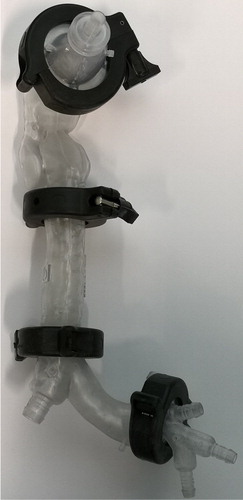
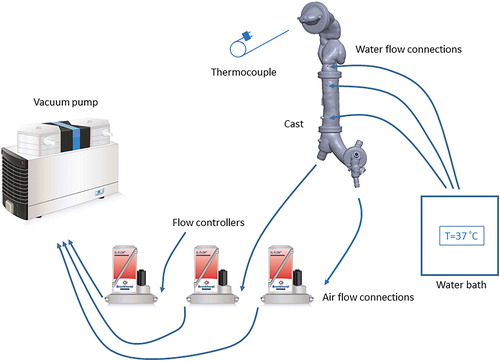
shows the experimental setup used to control air flow through the cast and to measure the surface and internal temperatures. Air flow rates at the cast outlets were fixed using red-y gas flow controllers (Vgtlin Instruments GmbH, Aesch, Switzerland). The flow controllers were connected to a KNF N 920 G vacuum pump (KNF Neuberger GmbH, Freiburg, Germany). The air flow rate at the inlet connection was measured using a TSI 4100 flowmeter (TSI Inc., Shoreview, MN, USA), to ensure that the inlet flow equaled the total flow pulled from the outlets; the equivalence of the inlet and outlet flow rates indicates the air-tightness of the cast shell. The water capillaries in the cast shell were connected to an Isotemp water bath (Thermo Fisher Scientific, Waltham, MA, USA) controlling the water temperature. Water capillaries in the cast segments were connected in parallel using a flow splitter. Temperature was measured by two techniques. A Fluke Ti300 infrared thermal camera (Fluke Corporation, Everett, WA, USA) was used to measure the external surface temperature of the cast with and without internal air flow. To measure air flow temperature, we inserted a thermocouple probe through the inlet connection inside the mouth cavity and along the central axis. Temperature was measured inside the cast at different locations to map the temperature gradient along the path of the air flow.
Figure 6. Flow and temperature measurement setup.
2.6. Computational model
We used a CFD model to simulate the air flow distribution in the cast and obtain the air flow rates through the outlet branches. The calculated flow rates from simulations are used in the experimental setup to adjust the flow controllers. The CFD model is then used to simulate the air flow heat transfer in the cast. After validation by experimental temperature measurements at various points inside the cast, the model can give a full picture of thermal equilibrium in the cast. The model includes the continuity equation for mass, Navier–Stokes equations for momentum, and energy equation for temperature. These equations are:
(1)
(1)
(2)
(2)
(3)
(3)
In this set of equations, ρ is the gas density, represents the gas velocity, p is the pressure, t is the time, and T represents the temperature. The material properties of the air including μ as the dynamic viscosity, cp as the heat capacity at constant pressure, and κ as the heat conductivity are temperature dependent.
denotes the rate of the strain tensor defined as
with
as the identity tensor.
The mathematical equations were solved with the AeroSolved (AeroSolved 2018) open source software developed in the OpenFOAM framework. Time integration was performed using a first-order Euler implicit scheme. The discretization of flow velocity and temperature was performed with a second-order upwind scheme. All gradient and Laplacian terms were discretized with a second-order accuracy central scheme.
The computational domain for solving the equations was the internal space of the cast geometry (). The computational mesh generated for the domain consisted of 1,264,893 cells. We tested the independence of the numerical results against discretization by refining the mesh to 2,376,540 cells. The flow rates and temperature values obtained using the refined mesh were altered from the coarse mesh calculations by <10%. We used a constant flow boundary condition at the inlet, 1.5 L/min, with fixed room temperature value, 22 °C. Considering a fully developed flow at the cast outlets in steady-state condition, a fixed pressure boundary was applied. A no-slip condition for the flow velocity was applied at the walls. The temperature of the wall was kept constant at 37 °C.
3. Results and discussion
3.1. CFD simulations and flow rate measurements
We performed CFD calculations to measure the air flow velocities and streamlines for a given flow rate at the inlet connection. shows the air flow streamlines color-coded by velocity through the respiratory tract geometry. The inlet air flow rate was 1.5 L/min. Maximum velocity occurred in the jet flow through the inlet connection, decreasing as the air moved through the cast. The density of the streamline in each branch is an indication of the flow rate; lists the flow rate in each outlet branch. The outlet flow rate was highest at the two largest outlet connections, numbered 1 and 3. The calculated flow rates were used to adjust the flow controllers in the experimental setup ().
Figure 7. Flow streamlines inside the cast color-coded by air flow velocity.
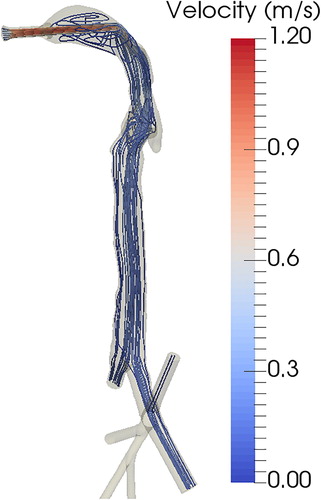
Table 3 Flow rates calculated in each outlet branch of the cast for an inlet flow rate of 1.5 L/min.
3.1.1. Temperature measurements
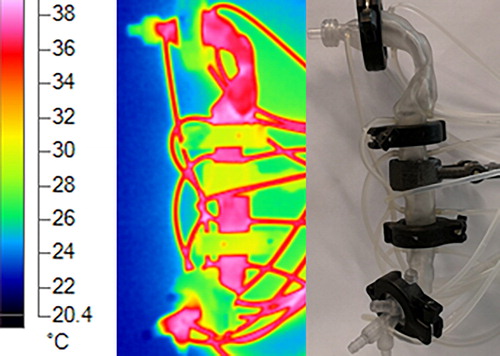
The temperature of the cast was controlled by circulation of hot water in the capillaries inside the cast shell. These water capillaries were connected to a thermal bath, providing stable temperature. shows the surface temperature of the cast, measured using an infrared thermal camera. The temperature of the thermal bath was kept at 40 °C, but the cast remained at an average temperature of 37 °C with ∼1 °C of variation between the cast segments. The temperature change from the thermal bath to the cast (40 to 37 °C) was due to heat loss as the water flowed through the connecting pipes. The temperature variation along the cast was minimized by parallel-connecting the cast segments to the thermal bath using a flow splitter.
Figure 8. External surface temperature of the cast, measured using an infrared thermal camera. Hot water is circulated in the cast shell capillaries using the connected tubes.
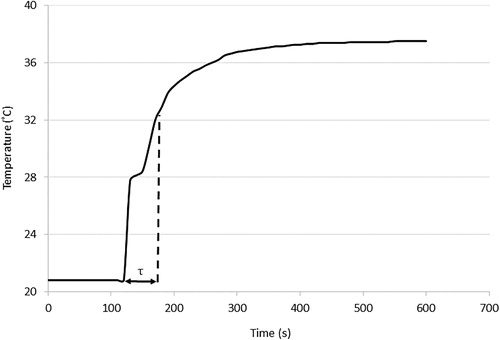
The air flow temperature is influenced by the heat exchange with the cast shell. We have measured the air temperature in the cast lumen using a thermocouple inserted through the inlet connection. shows the air temperature measured versus time. The measurement was started without the circulating hot water in the cast and, therefore, the initial temperature was in equilibrium with the ambient conditions. During the measurement, the water circulation was started at t = 120 s and, consequently, air temperature started to increase. The time constant of the heating process can be estimated referring to the lumped heat capacity analysis, in which the convective thermal process is modeled as a first-order system (Lewis, Nithiarasu, and Seetharamu 2004). With this analysis, the time constant of the process equals to the time that the air temperature reaches 63% of the initial temperature difference between air and the cast. This time equals to t = 45 s. Thus, the dynamic response of the air temperature to the changes implemented in the cast temperature can be expected in the order of a minute.
Figure 9. Air temperature measurements inside the cast. Hot water circulation commenced at t = 120 s. The time constant of the heating process, τ, equals the time required to reach 63% of the initial temperature difference between the air and the cast.
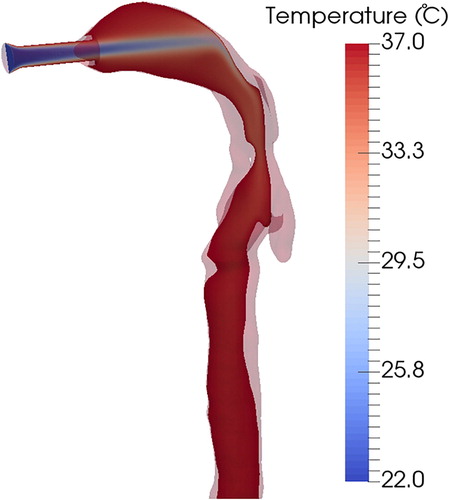
The temperature measurement depicted in was performed for stationary conditions without air flow inside the cast, which would change the thermal equilibrium in the cast. shows the temperature distribution inside the cast for an air flow rate of 1.5 L/min, calculated using CFD simulations. The air flow temperature at the inlet was 22 °C (laboratory temperature), and it equilibrated with the cast temperature of 37 °C in the throat region. The thermal equilibration depends on the temperature differences between the air flow and the cast, but also on the flow residence time in the cast, which is indicated by the inlet air flow rate. The lowest temperature was observed for the jet flow entering the cast through the inlet connection. In the mouth cavity, the air velocity was reduced, increasing residence time for conductive heat transfer from the cast to the air flow.
Figure 10. Air temperature distribution inside the cast with a flow rate of 1.5 L/min, calculated by CFD simulation. The air flow temperature at the inlet was T = 22 °C, and the cast wall temperature was maintained at T = 37 °C.
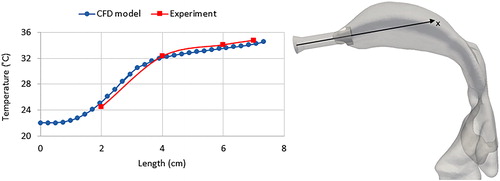
We measured the temperature of the air flow inside the cast experimentally using an inserted thermocouple. The temperature was measured inside the mouth cavity by inserting the thermocouple probe through the inlet connection and along the central axis (). Ambient air entering the cast through the inlet connection increased in temperature, reaching a temperature just below that of the cast wall (T = 37 °C). This measurement is in good agreement with the CFD prediction (), validating the CFD model of thermal equilibrium inside the cast (). We compared our results with the analytical solution obtained by Daviskas, Gonda, and Anderson (Citation1990) for the temperature distribution in the tracheobronchial system and we have a variation of <1 °C. The variation in the calculated temperatures can be explained by the fact that Daviskas, Gonda, and Anderson (Citation1990) obtained their empirical coefficients by fitting their equation to experimental data for inspiration flow rates of 15 and 100 L/min. Therefore, using their obtained equation for other flow rates would result in some error.
Figure 11. Air flow temperature measured using a thermocouple inserted through the inlet connection. The air flow rate is 1.5 L/min. The temperature was measured along the line (x) and compared with CFD predictions.
4. Conclusion
We developed a human respiratory tract cast model with realistic geometry that included the first five generations of the tracheobronchial tree. The cast is equipped with water capillaries controlling the temperature of the air flow to represent the physiological conditions in the human lung. The cast design, comprising five separable segments, is suitable for aerosol exposure studies as it facilitates the measurement of particle deposition within the respiratory tract. The resin material selected can withstand high temperatures without polymerizing, and the average surface roughness of the printed cast’s internal surface did not exceed 0.55 µm. Surface characteristics have been shown to be important for the local deposition of particles in airway models (Holbrook and Longest Citation2013).
The temperature control feature of the cast was tested for uniform temperature distribution in the cast shell and maximum variation of 1 °C was obtained using parallel connection of the cast segments to the thermal bath by flow splitter. We are also able to simulate the physiological temperature gradient with the temperature increasing from throat to deeper segments of the tracheobronchial system (Ferron, Haider, and Kreyling Citation1985; Eisner and Martonen Citation1989), since the water capillaries in different segments of the cast can be connected to heat sources with various temperatures.
The air temperature inside the cast was measured without air flow, and required <1 min to equilibrate with the temperature of the cast during circulation of hot water. This relatively short response time justifies the selection of the resin material and will be useful for inhalation studies with different thermal conditions. This time scale is still much longer than one inhalation cycle time (4 s), and hence does not allow the control of the thermal conditions within one breathing cycle. This can be a place for future improvement to reduce the response time to order of a second for more detailed investigations. Air flow rates at the casts outlet branches were calculated by CFD simulations and used to adjust the settings for the experimental measurement. Air temperature inside the cast was also measured with air flow, and was in good agreement with CFD predictions. We then used the validated computational model to assess the thermal equilibrium in the full cast. We showed that the flow temperature equilibrates with the cast temperature in the mouth–throat region, and a uniform temperature distribution is achieved in the other segments. This resembles the thermal conditions of respiratory flow in the human lung.
The cast was developed to obtain an anatomically realistic respiratory tract model that imitates physiological lung thermal conditions and is suitable for aerosol exposure studies. This cast will facilitate evaluation of size evolution and deposition of liquid particles following condensation/evaporation events under varying temperature conditions. Further studies and cast development toward the integration of features controlling air flow humidity to represent physiological conditions in the respiratory tract are warranted to promote in vitro research in inhalation toxicology and aerosol physics.
Disclosure statement
The authors declare no competing financial interests.
Additional information
Funding
References
- AeroSolved 2018. Accessed October 18, 2018. https://www.aerosolved.com.
- Asgari, M., F. Lucci, and A. Kuczaj. 2018. Multispecies aerosol evolution and deposition in a bent pipe. J. Aerosol Sci. doi:10.1016/j.jaerosci.2018.12.007.
- Baumans, V. 2004. Use of animals in experimental research: an ethical dilemma? Gene Therapy 11 (S1):S64. doi:10.1038/sj.gt.3302371.
- Borojeni, A., M. Noga, A. Martin, and W. Finlay. 2015. An idealized branching airway geometry that mimics average aerosol deposition in pediatric central conducting airways. J. Aerosol Sci. 85 :10–16. doi:10.1016/j.jaerosci.2015.03.002.
- Chan, T., and M. Lippmann. 1980. Experimental measurements and empirical modelling of the regional deposition of inhaled particles in humans. Am. Ind. Hygiene Assoc. 41 (6):399–409. doi:10.1080/15298668091424942.
- Cheng, Y., Y. Zhou, and B. Chen. 1999. Particle deposition in a cast of human oral airways. Aerosol Sci. Technol. 31 (4):286–300. doi:10.1080/027868299304165.
- Comouth, A., H. Saathoff, K. Naumann, S. Muelhopt, H. Paur, and T. Leisner. 2013. Modelling and measurement of particle deposition for cell exposure at the air–liquid interface. J. Aerosol Sci. 63 :103–114. doi:10.1016/j.jaerosci.2013.04.009.
- Crane, R., and R. Evans. 1977. Inertial deposition of particles in a bent pipe. J. Aerosol Sci. 8 (3):161–170. doi:10.1016/0021-8502(77)90003-9.
- Davila, J., R. Rodriguez, R. Melchert, and J. Acosta. 1998. Predictive value of in vitro model systems in toxicology. Annu. Rev. Pharmacol. Toxicol. 38 (1):63–96. doi:10.1146/annurev.pharmtox.38.1.63.
- Daviskas, E., I. Gonda, and S. Anderson. 1990. Mathematical modeling of heat and water transport in human respiratory tract. J. Appl. Physiol. 69 (1):362–372. doi:10.1152/jappl.1990.69.1.362.
- Donaldson, K., D. Brown, A. Clouter, R. Duffin, W. MacNee, L. Renwick, L. Tran, and V. Stone. 2002. The pulmonary toxicology of ultrafine particles. J. Aerosol Med. 15 (2):213–220. doi:10.1089/089426802320282338.
- Eisner, A., and T. Martonen. 1989. Simulation of heat and mass transfer processes in a surrogate bronchial system developed for hygroscopic aerosol studies. Aerosol Sci. Technol. 11 (1):39–57. doi:10.1080/02786828908959298.
- Ferron, G., B. Haider, and W. Kreyling. 1985. A method for the approximation of the relative humidity in the upper human airways. Bull. Math. Biol. 47 (4):565–589.
- Festing, S., and R. Wilkinson. 2007. The ethics of animal research: talking point on the use of animals in scientific research. EMBO Rep. 8 (6):526–530. doi:10.1038/sj.embor.7400993.
- Formlabs 2018. Accessed October 18, 2018. https://www.formlabs.com.
- Frederix, E., A. Kuczaj, M. Nordlund, A. Veldman, and B. Geurts. 2017. Eulerian modeling of inertial and diffusional aerosol deposition in bent pipes. Comput. Fluids 159 :217–231. doi:10.1016/j.compfluid.2017.09.018.
- Frederix, E. M. A., A. K. Kuczaj, M. Nordlund, M. Bělka, F. Lizal, J. Jedelský, J. Elcner, M. Jícha, and B. J. Geurts. 2018. Simulation of size-dependent aerosol deposition in a realistic model of the upper human airways. J. Aerosol Sci. 115 :29–45. doi:10.1016/j.jaerosci.2017.10.007.
- Fujitani, Y., Y. Sugaya, M. Hashiguchi, A. Furuyama, S. Hirano, and A. Takami. 2015. Particle deposition efficiency at air–liquid interface of a cell exposure chamber. J. Aerosol Sci. 81 :90–99. doi:10.1016/j.jaerosci.2014.10.012.
- Grgic, B., W. Finlay, P. Burnell, and A. Heenan. 2004a. In vitro intersubject and intrasubject deposition measurements in realistic mouth–throat geometries. J. Aerosol Sci. 35 (8):1025–1040. doi:10.1016/j.jaerosci.2004.03.003.
- Grgic, B., W. Finlay, and A. Heenan. 2004b. Regional aerosol deposition and flow measurements in an idealized mouth and throat. J. Aerosol Sci. 35 (1):21–32. doi:10.1016/S0021-8502(03)00387-2.
- Gupta, D., and M. Peters. 1985. A Brownian dynamics simulation of aerosol deposition onto spherical collectors. J. Colloid Interface Sci. 104 (2):375–389. doi:10.1016/0021-9797(85)90046-3.
- Hinds, W. 2012. Aerosol technology: properties, behavior, and measurement of airborne particles. New York, NY: John Wiley & Sons.
- Höfer, T., I. Gerner, U. Gundert-Remy, M. Liebsch, A. Schulte, H. Spielmann, R. Vogel, and K. Wettig. 2004. Animal testing and alternative approaches for the human health risk assessment under the proposed new European chemicals regulation. Arch. Toxicol. 78 (10):549–564. doi:10.1007/s00204-004-0577-9.
- Holbrook, L., and P. Longest. 2013. Validating CFD predictions of highly localized aerosol deposition in airway models: in vitro data and effects of surface properties. J. Aerosol Sci. 59 :6–21. doi:10.1016/j.jaerosci.2013.01.008.
- Holmes, A., S. Creton, and K. Chapman. 2010. Working in partnership to advance the 3Rs in toxicity testing. Toxicology 267 (1–3):14–19. doi:10.1016/j.tox.2009.11.006.
- Hull, C. 1986. Apparatus for production of three-dimensional objects by stereolithography. US Patent 4,575,330.
- Kimbell, J., R. Segal, B. Asgharian, B. Wong, J. Schroeter, J. Southall, C. Dickens, G. Brace, and F. Miller. 2007. Characterization of deposition from nasal spray devices using a computational fluid dynamics model of the human nasal passages. J. Aerosol Med. 20 (1):59–74. doi:10.1089/jam.2006.0531.
- Lewis, R., P. Nithiarasu, and K. Seetharamu. 2004. Fundamentals of the finite element method for heat and fluid flow. New York, NY: John Wiley & Sons.
- Lizal, F., M. Belka, J. Adam, J. Jedelsky, and M. Jicha. 2015. A method for in vitro regional aerosol deposition measurement in a model of the human tracheobronchial tree by the positron emission tomography. Proc. Inst. Mech. Eng, Part H: J. Eng. Med. 229 (10):750–757. doi:10.1177/0954411915600005.
- Longest, P., and M. Hindle. 2010. CFD Simulations of enhanced condensational growth (ECG) applied to respiratory drug delivery with comparisons to in vitro data. J. Aerosol Sci. 41 (8):805–820. doi:10.1016/j.jaerosci.2010.04.006.
- Longest, P., and S. Vinchurkar. 2007. Validating CFD predictions of respiratory aerosol deposition: effects of upstream transition and turbulence. J. Biomech. 40 (2):305–316. doi:10.1016/j.jbiomech.2006.01.006.
- Longest, P. W., and L. Holbrook. 2012. In silico models of aerosol delivery to the respiratory tract-development and applications. Adv. Drug Deliv. Rev. 64 (4):296–311. doi:10.1016/j.addr.2011.05.009.
- Lucci, F., N. Castro, A. Rostami, M. Oldham, J. Hoeng, Y. Pithawalla, and A. Kuczaj. 2018. Characterization and modeling of aerosol deposition in vitro cell exposure systems—exposure well chamber deposition efficiency. J. Aerosol Sci. 123 :141–160. doi:10.1016/j.jaerosci.2018.06.015.
- Majeed, S., S. Frentzel, S. Wagner, D. Kuehn, P. Leroy, P. Guy, A. Knorr, J. Hoeng, and M. Peitsch. 2014. Characterization of the in vitro cell 24/48 in vitro aerosol exposure system using mainstream cigarette smoke. Chem. Central J. 8 (1):62.
- Mülhopt, S., S. Diabaté, T. Krebs, C. Weiss, and H. Paur. 2009. Lung toxicity determination by in vitro exposure at the air liquid interface with an integrated online dose measurement. J. Phys.: Conf. Ser. 170 :012008. doi:10.1088/1742-6596/170/1/012008.
- Oldham, M. 2006. Challenges in validating CFD-derived inhaled aerosol deposition predictions. Inhal. Toxicol. 18 (10):781–786. doi:10.1080/08958370600748752.
- Paur, H., F. Cassee, J. Teeguarden, H. Fissan, S. Diabate, M. Aufderheide, W. Kreyling, O. Hänninen, G. Kasper, M. Riediker, B. Rothen-Rutishauser, and O. Schmid. 2011. In-vitro cell exposure studies for the assessment of nanoparticle toxicity in the lung—a dialog between aerosol science and biology. J. Aerosol Sci. 42 (10):668–692. doi:10.1016/j.jaerosci.2011.06.005.
- Pöschl, U. 2005. Atmospheric aerosols: composition, transformation, climate and health effects. Angew. Chem. Int. Ed. Engl. 44 (46):7520–7540. doi:10.1002/anie.200501122.
- Rahimi-Gorji, M., O. Pourmehran, M. Gorji-Bandpy, and T. Gorji. 2015. CFD simulation of airflow behavior and particle transport and deposition in different breathing conditions through the realistic model of human airways. J. Mol. Liquids 209 :121–133. doi:10.1016/j.molliq.2015.05.031.
- Rostami, A. 2009. Computational modeling of aerosol deposition in respiratory tract: a review. Inhal. Toxicol. 21 (4):262–290. doi:10.1080/08958370802448987.
- Rygg, A., and P. Longest. 2016. Absorption and clearance of pharmaceutical aerosols in the human nose: development of a CFD model. J. Aerosol Med. Pulm. Drug Deliv. 29 (5):416–431. doi:10.1089/jamp.2015.1252.
- Schlesinger, R., and M. Lippmann. 1976. Particle deposition in the trachea: in vivo and in hollow casts. Thorax 31 (6):678–684.
- Secondo, L., N. Liu, and N. Lewinski. 2017. Methodological considerations when conducting in vitro, air–liquid interface exposures to engineered nanoparticle aerosols. Crit. Rev. Toxicol. 47 (3):225–262. doi:10.1080/10408444.2016.1223015.
- Srirama, P., C. Wallis, D. Lee, and A. Wexler. 2012. Imaging extra-thoracic airways and deposited particles in laboratory animals. J. Aerosol Sci. 45 :40–49. doi:10.1016/j.jaerosci.2011.10.007.
- Thorne, D., and J. Adamson. 2013. A review of in vitro cigarette smoke exposure systems. Exp. Toxicol. Pathol. 65 (7–8):1183–1193. doi:10.1016/j.etp.2013.06.001.
- Yeh, H., and G. Schum. 1980. Models of human lung airways and their application to inhaled particle deposition. Bull. Math. Biol. 42 (3):461–480. doi:10.1016/S0092-8240(80)80060-7.
- Zhang, Z.,. C. Kleinstreuer, and S. Hyun. 2012. Size-change and deposition of conventional and composite cigarette smoke particles during inhalation in a subject-specific airway model. J. Aerosol Sci. 46 :34–52. doi:10.1016/j.jaerosci.2011.12.002.