
 ?Mathematical formulae have been encoded as MathML and are displayed in this HTML version using MathJax in order to improve their display. Uncheck the box to turn MathJax off. This feature requires Javascript. Click on a formula to zoom.
Abstract
Biomass combustion produces black carbon (BC) and brown carbon (BrC) aerosols that contribute substantially to warming the Earth’s atmosphere. Accurate knowledge of their emissions and absorption per unit mass (mass absorption cross-section; MAC) can be used to quantify the radiative impact of these combustion products. We isolated particles generated from laboratory biomass burning fires by morphology and found that some particles from biomass burning do not correspond to either BC or BrC according to common operational definitions. Unlike BrC, these particles strongly absorb red light, with a MAC and spectral dependence of absorption between that of BrC and BC. They also have intermediate volatility: they survive thermodenuding at 250 °C but do not heat to incandescence in a single particle soot photometer (SP2) instrument. We also found evidence for intermediate properties in ambient wildfire smoke from the 2013 Rim Fire in California. More work is needed to understand how much this intermediate material contributes to atmospheric light absorption from typical combustion, whether or not it corresponds to “tar balls,” and how it may affect previous MAC measurements that were attributed to enhanced absorption by transparent coatings.
Copyright © 2019 American Association for Aerosol Research
1. Introduction
Combustion produces light-absorbing aerosol particles that warm the atmosphere and have a major effect on climate (Bond et al. Citation2013). Major combustion sources include fossil fuel use for transportation, energy production, and industry, biofuel burning, and open burning of grasslands, crop residues, and forests. Here, we focus on emissions from biomass burning, which includes both wildfires and agricultural burning, and accounts for one-third of the global light-absorbing carbon aerosol budget (Bond et al. Citation2013).
The light-absorbing aerosols that are produced from combustion are typically classified as black carbon (BC) or brown carbon (BrC) (Andreae and Gelencser Citation2006; Bond et al. 2013). As conventionally defined, BC absorbs light across the entire ultraviolet (UV)-visible spectrum, is nonvolatile, refractory, and insoluble, and has a distinctive agglomerate morphology (Bond et al. Citation2013; Petzold et al. Citation2013). In both the combustion and atmospheric literature (Quay et al. Citation1994; Andreae and Gelencser Citation2006), BC is often operationally defined as equivalent to refractory black carbon (rBC), the refractive material that is quantified via incandescence with a characteristic color temperature when sufficiently heated by a suitable laser beam (Schwarz et al. Citation2010; Bladh et al. Citation2015; Kholghy et al. Citation2017). Other examples of the different operational definitions of BC using various measurement techniques are described in detail in Lack et al. (Citation2014).
BrC is conventionally defined as an aerosol with a strong wavelength-dependent absorption that peaks in the UV spectral region and declines through the visible spectral region (Kirchstetter and Thatcher Citation2012). BrC is a poorly classified material because its chemical composition is varied, complicated, and not yet well-understood. BrC was previously defined as light-absorbing organic aerosol that is not BC (Andreae and Gelencser Citation2006). Since this definition is ambiguous, BrC is mostly quantified via operational definitions. Properties used to quantify BrC include solubility in water and/or organic solvents such as methanol (Kirchstetter and Thatcher Citation2012; Forrister et al. Citation2015), volatility (vaporized at 250–300 °C in a thermodenuder (TD)) (Cappa et al. Citation2012), a spherical shape in the aerosol mode (Tang et al. Citation2016), and, as befits the word “brown”, a strongly wavelength-dependent absorption spectrum (Kirchstetter and Thatcher Citation2012; Lu et al. Citation2015). Recently, extensive work has been undertaken to identify and characterize the molecular composition and optical properties of BrC chromophores (e.g. Lin et al. Citation2016), an approach limited to solvent-extractable material. Various studies may define BrC with different subsets of these characteristics.
The differentiation between BC and BrC explained above is widely used (Andreae and Gelencser Citation2006). However, biomass burning is a complex process that involves multiple chemically complex fuels burning simultaneously with fuel-to-oxygen ratios and the efficiency of flame-processing varying significantly over short distance scales, potentially resulting in many intermediate products. These organic products may form aerosol with a continuum of optical properties between BrC and BC that could be inconsistently categorized as BrC or BC depending on the set of operational definitions discussed above (Saleh et al. Citation2018).
In this study we provide new information about an intermediate absorber that could have been previously categorized as BC, BrC, or neither, depending on the operational definitions applied. We sampled biomass burning aerosol generated by burning fuels typical of wildfires in the western United States. Particles were isolated based on volatility (via TD) and morphology, i.e. fractal or spherical. Low-volatility, fractal particles had the optical and refractory properties expected for BC, whereas the low-volatility spherical particles did not incandesce but absorbed light strongly from the near-UV through the red. These low-volatility spherical particles have properties that are intermediate between BC and BrC. We hypothesize that this intermediate absorber is partially formed BC that is less volatile than polycyclic aromatic hydrocarbons (PAHs) but lacks the incandescent properties of BC. We also measured light absorption in the near-UV for polydisperse, low-volatility populations that we obtained from different biomass burning samples, and show they are consistent with a combination of BC and an intermediate absorber.
2. Instrumentation and methods
2.1. Burns and sampling system
Laboratory measurements of the light-absorbing properties of fresh smoke particles were conducted at the U.S. Forest Service Missoula Fire Sciences Laboratory for a variety of fuel types typical of wildfires in the western US, including lodgepole pine canopy, ceanothus, manzanita (both clean and contaminated with urban pollution), ponderosa pine litter, and pine forest fuels (see Table S1). For the smoke samples discussed here, the fuel was burned over a relatively short period (5 - 30 minutes), and the smoke from the fire was collected in a 12.5 m × 12.5 m × 22 m burn chamber and sampled over a period of a 3–4 h. The burns were ignited by rapidly heating ∼30 cm2 of wire under the fuels, which covered about 1 m2. The ignition process typically involved a few seconds of localized “pure pyrolysis” that created a small white smoke plume before the sudden onset of a localized flame. “Mostly pure flaming” then consumed most of the fuels over the next few minutes followed by several minutes of a less-productive mix of flaming, pyrolysis, and glowing. The combined emissions were allowed to become well-mixed in the room (as confirmed by the OP-FTIR and other real-time data) before sampling the aerosols (typically ∼15 min after ignition). Additional general information on room burns is provided elsewhere (Stockwell et al., Citation2014). Details on the fuels are in supplemental material Table 1 and Selimovic et al. (Citation2018). Videos are available on the FIREX website.
Three experimental setups were used to study morphology-selected or polydisperse aerosols.
Setup 1(morphology selection) (): A 250 °C TD (residence time 1.5–3 s) was placed upstream of the mass and size selection. Following the TD, a differential mobility analyzer (DMA) selected aerosol particles with a set electrical mobility, followed by an additional selection for mass-to-charge with a centrifugal particle mass analyzer (CPMA). This instrumentation combination enabled us to select particle populations with specific morphologies ranging from spherical particles to low-density agglomerates.
Figure 1. The schematic of the three experimental setups utilized during the Missoula Fire Science Laboratory experiments. Acronyms used in this figure: NOx – nitrogen oxide, AMS – aerosol mass spectrometer, CPC – condensation particle counter, SP2 – single particle soot photometer, PAS – photoacoustic spectrometer, SEM – scanning electron microscopy, BrC PILS – brown carbon particle-into-liquid sampler for water-soluble species, DMA – differential mobility analyzer, CPMA – centrifugal particle mass analyzer.
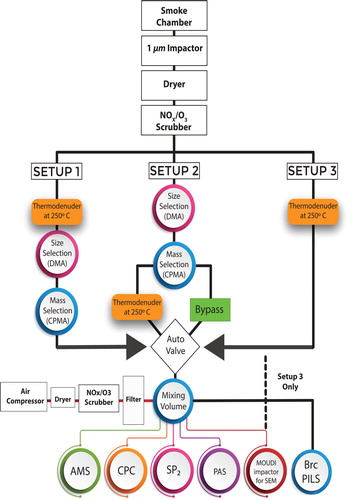
The particles were then introduced into a 1 L mixing volume, where the aerosol sample was diluted (factor ∼4) with dried and filtered air. A photoacoustic spectrometer (PAS) quantified aerosol light absorption. A single particle soot photometer (SP2) measured the rBC mass concentration and provided an estimate of the amount of non-refractory material internally mixed with rBC in individual particles (generically referred to as the “coating thickness” without suggesting any specific morphology). A condensation particle counter (CPC) measured the number density of particles (#/cm3) and, combined with the CPMA, was used to retrieve the average total mass per particle. An aerosol mass spectrometer (AMS) measured the non-refractory aerosol mass and composition.
Setup 2 (morphology selection) (): The aerosol particles were size and mass selected, then directed down one of two channels: (i) a bypass channel; and (ii) a thermodenuded (250 °C) channel to remove volatile material. The aerosol particles were then introduced to the mixing volume and measured in the same way as described above for Setup 1. Typical dilution for setup 2 was ∼1:4.
Setup 3 (polydisperse particle population) (): The particles were introduced into the TD with no mass or size selection. The particles were introduced directly into the mixing volume and measured in the same way as described above for setups 1 and 2, with the additional measurement of the Brown Carbon Particle-Into-Liquid Sampler (BrC-PILS). In setup 3, a collection of aerosol instruments (which are not used for this analysis) sampled from the mixing volume resulting in a more significant dilution to the original smoke sample (typically ∼1:40).
2.2. Centrifugal particle mass analyzer (CPMA) and differential mobility analyzer (DMA)
The CPMA (APM-3600; Cambustion Ltd, Cambridge, UK) classifies aerosol particles by their mass-to-charge ratio by balancing centrifugal and electrostatic forces between two concentric rotating cylinders. Aerosol with a bipolar charge distribution after a 210Po neutralizer enters the CPMA, and only particles with a narrow range of mass-to-charge ratios pass through the instrument. Other particles are lost on the walls of the cylinder. The CPMA is capable of classifying particles in the range 0.2 attograms to 1050 femtogram (fg). The CPMA mass and equivalent size selection was validated using three sizes of Polystyrene Latex (PSL) spheres (diameters of 100 nm, 250 nm, 600 nm), following a DMA (custom built, similar to Brechtel Model 2100).
The mass resolution of the CPMA (RCPMA) characterizes the width of the mass selected range. The resolution is the specific mass set point (m*) divided by the full width at half maximum range of the CPMA transfer function ΔmFWHM, where the transfer function is the probability that a particle of a given specific mass is transferred through the CPMA as shown in the following equation:
(1)
(1)
During morphology-selected experiments (setups 1 and 2) a 1.8 standard liter per minute (slpm) flow was introduced to a DMA (sheath flow of 8.5 slpm), then the aerosol sample was classified by the CPMA at a set mass-to-charge ratio. At each point of the experiment, a size was set at the DMA and a mass-to-charge ratio and resolution was set at the CPMA. The selected mass-to-charge ratios were within the 3–12 fg range. The resolution used was varied between 5 and 15. Because particles with the same electrical mobility diameter and varying particle mass exiting the DMA were subsequently filtered by the CPMA-specified mass-to-charge ratio, most multiply-charged particles were eliminated which was later verified using the SP2 BC size distribution.
2.3. Single particle soot photometer (SP2)
The NOAA SP2 (Droplet Measurement Technology) detects rBC in the accumulation mode size range, with rBC volume-equivalent diameters (assuming a void-free density of 1.8 g cm−3) between 90 and 500 nm (0.7–150 fg) quantified here. The lower size/mass limit of detection is determined by the necessity of heating rBC particles to incandescence with a continuous laser (Schwarz et al. Citation2010). Absolute uncertainty in the rBC mass concentration is due to both potential differences between rBC reference materials and the generated aerosols, as well as uncertainty in the sampling flow rate, and is estimated to total 25% (Laborde et al. Citation2012). Previous simultaneous measurements with independently operated SP2s, demonstrated that rBC mass concentrations agree within ±15% (Laborde et al. Citation2012). SP2 mass calibrations were performed twice during the campaign, using the accepted BC reference material (Fullerene Soot, Sigma Aldrich, lot #F12SO11) size-selected through a DMA (Baumgardner et al. 2012); these mass calibrations were stable to within 2%, indicating relative rBC-mass uncertainty between fires measured with the same SP2 was significantly lower than the absolute uncertainty. The laser power and the position of particles relative to the transverse profile of the laser beam were monitored using measurements of 220 nm PSLs before and immediately following sampling for each fire. The fraction of rBC-containing particles that were optically sized was typically greater than 90% for rBC cores >2 fg. The rBC absorption enhancement was estimated by comparing the observed optical size of rBC to that of bare BC, applying Mie Shell-and-Core theory to model absorption, as was previously described in Schwarz et al. (Citation2008). This approach used a complex index of refraction for ambient rBC provided by Moteki, Kondo, and Nakamura (Citation2010) (ncore = 2.26 + 1.26i). An index of refraction of 1.45 + 0i was assumed for the internally mixed materials. A temperature dependent correction was applied to the optical scattering signal to account for decreased laser efficiency at warmer temperatures since laboratory temperature often increased significantly during the day.
2.4. Photoacoustic spectrometer (PAS)
The PAS instrument is custom built and described in detail by Lack et al. (2012b). Briefly, the PAS instrument consisted of five photoacoustic channels. For the morphology-selected experiments, we used the three channels operating under dry conditions (<30% relative humidity) at red, green, and blue wavelengths (661, 532, and 401n, respectively). The instrumental background, resonant frequency, and acoustic quality factor of each acoustic sample cell are dependent on the internal pressure and temperature. Every 7 min, automated valves placed a filter in line with the inlet for a period of 100 s, allowing the background acoustic signal (due to absorption of scattering light by the cell walls and windows) to be measured. The background signal drifted slowly and typically varied less than 0.25 Mm−1 between adjacent filter periods but in some cases the change was as large as 0.5 Mm−1. The total measurement accuracy was estimated to be ±0.5 Mm−1 + 10% for the red and the green channels and ±0.5 Mm−1 + 30% for the blue channels.
2.5. Aerosol mass spectrometer (AMS)
Measurements of the non-refractory aerosol chemical composition were obtained with a compact, time-of-flight aerosol mass spectrometer (c-ToF AMS) equipped with an internal light-scattering module (Liao et al. Citation2017). The vaporizer temperature was roughly 600 °C. Mass spectra were acquired while cycling through different data acquisition modes, with bulk mass spectra recorded approximately every 6.5 s plus mass distributions and light-scattering single particle data recorded roughly once a minute. Because of uncertainties in the AMS collection efficiency and volatilized fraction for particles that have passed through a thermodenuder, we use relative AMS signals in this article.
2.6. Brown carbon particle-into-liquid sampler (BrC PILS)
Measurements of water-soluble organic aerosol absorption were measured using a particle-into-liquid sampler coupled to a liquid waveguide capillary cell, based on the design described in Hecobian et al. (Citation2010). Briefly, aerosols are collected in water using a particle-into-liquid sampler (4001; Brechtel Manufacturing Inc., Hayward, CA, USA). The flow passes through a filter to remove insoluble components. The absorption of the solution is measured using a deuterium/halogen lamp (DH-mini; Ocean Optics Inc., Dunedin, FL, USA), 2.5 m liquid waveguide capillary cell (LWCC-3250; World Precision Instruments, Sarasota, FL, USA), and grating spectrometer (Acton InSpectrum 150; Princeton Instruments, Trenton, NJ, USA). We calculate the absorption coefficient of the aerosol using Beer’s law and the known inlet flow. The calculated uncertainty for water-soluble absorption is 25%. Because the particle-into-liquid sampler is only capable of operating with water as a working fluid and the absorption of the solution is measured online, measurements of methanol-soluble absorption are not available for this experiment.
2.7. Scanning electron microscopy (SEM)
Particle morphology was measured using SEM. A sample flow of 1.5 slpm was introduced in a micro-orifice uniform deposition impactor (Mini-MOUDI; MSP Inc., Shoreview, MN, USA), and the particles were collected on silicon chips. The samples were later sputter coated with approximately 5 nm of platinum to prevent damage from charging and analyzed under high vacuum with accelerating voltages of 5–15 kV using an SEM (SU3500; Hitachi, Tokyo, Japan). These images were used to observe the different selected morphologies.
3. Experimental results
3.1. Separating the intermediate absorber and BC at the fire sciences laboratory
upper panel shows electron microscope images of particles with fixed total mass (mp = 6 fg) and selected mobility diameters (Dm = 200 nm, 300 nm) for the same fire (lodgepole pine canopy fuel, Burn 87 in Table S1). For this and other fires, the DMA and CPMA combination (setup 1 in ) provided streams of particles with chain-aggregate or near-spherical geometry for further analysis. The separation allowed investigating optical and compositional properties as a function of the effective density ρeff, which is defined as:
(2)
(2)
where mp is the aerosol mass and Dm is the selected electrical mobility diameter. In these experiments, the effective density is an indication of the morphology (chain-aggregate or spherical).
Figure 2. Top panels: SEM micrographs showing particle morphology for two different effective densities (mobility diameters of 200 and 300 nm for a fixed mass of 6 fg). Particle properties were measured after a 250 °C thermodenuder. The combination of a DMA and CPMA produced streams of particle selected by morphology. Lower panel: the fraction of refractory (rBC) total mass measured by the SP2 compared to the selected CPMA mass times the number of particles. The SP2 quantitatively counted the mass and number of chain-aggregate soot particles whereas most of the spherical particles did not produce an incandescence signal in the SP2.
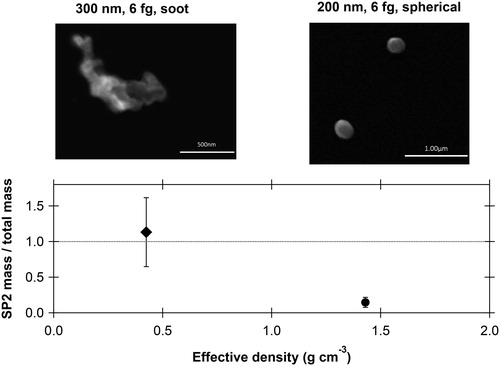
The low effective density particles appeared as fractal agglomerates of small spherules in SEM images. For those particles, the mass measured by incandescence (SP2) was close to 90% of the average total mass (, lower panel). The SP2 indicated extremely thin (≪40 nm, Figure S1) coatings on these particles. In contrast, the 6 fg particles with a mobility diameter of 200 nm did not exhibit mass and morphology properties associated with BC. These particles appeared as individual spheres in SEM images and less than 20% of the mass was incandescent in the SP2. We next show that, despite not being BC in the traditional sense, these spherical particles were highly absorbing and relatively black.
3.2. The MAC of BC and the intermediate absorber
The mass absorption cross-section (MAC with units of m2 g−1) is an important parameter for quantifying the light absorption by aerosol particles as it is used in many models to relate the absorption of light by carbon to mass emission factors (Bond et al. 2013). It is defined as
(3)
(3)
where αabs is the absorption coefficient and m is the total mass concentration of the particles. We refer to the MAC computed using the rBC mass measurement of the SP2 as MACSP2 and the MAC computed using the CPMA mass-to-charge setpoint coupled with the particle number density measured by the CPC as MACCPMA.
shows the MACs for the two morphology selections shown in . For the chain-aggregate soot particles the light absorption per unit mass was consistent with literature values for BC (Bond and Bergstrom Citation2006; Bond et al. 2013). Additionally, very low mass concentration was detected by the AMS, close to the detection limit of the instrument, indicating very little material volatizing at 600 °C, the AMS oven temperature. In short, our experimental suite reproduced literature values for the properties of BC when presented with non-spherical particles with low effective density, typical of chain-aggregate soot particles.
Figure 3. Mass absorption coefficients (MACs) at three wavelengths for the chain-aggregate soot and spherical particles after a 250 °C thermodenuder as shown in . The middle curves and points show that the soot particles produced MACs similar to literature values for black carbon (Bond and Bergstrom Citation2006). The MACCPMA and MACSP2 are similar for the soot particles because the SP2 quantitatively measured their total mass. Per unit mass, the spherical particles (filled circles with lines) absorbed 40–70% of the light compared to black carbon across the entire visible range. The MACs for the spherical particles using the SP2 mass (open circles) are artificially large because most of these particles did not incandesce in the SP2. Nevertheless, the values indicate what would be inferred if the mass of light-absorbing particles were operationally defined from an SP2.
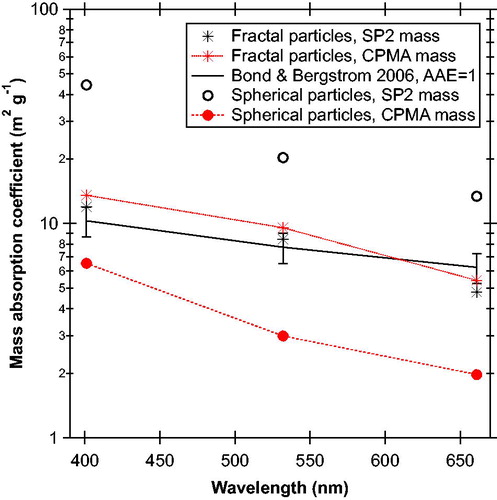
The low-volatility, spherical particles absorbed a significant amount of light across the visible spectrum. The MACCPMA for the spherical particles was about 50% of that for BC at 401 nm and still 35% of BC at 661 nm. Such particles are highly absorbing. Their absorption Ångstrom exponent (AAE)401–661 nm is 2.4, and is between that for BC (1–1.5, Bond et al. 2013) and BrC, for which AAEs of 3–11 are often reported (Kirchstetter and Thatcher Citation2012). In contrast to the chain-aggregate particles, the AMS measured mass well above its detection limit for these thermodenuded, spherical particles. In short, these particles had properties intermediate between BC and BrC.
We repeated experiments similar to that shown in and for a range of selected masses (2–12 fg), mobility diameters (150–300 nm), and a variety of fuel types (see Table S1). These experiments were conducted downstream of the 250 °C TD using setups 1 and 2 (). shows the average MACCPMA at 661 nm together with the expected MACBC, which is the MAC attributed to BC only, derived by scaling the measured average MACBC (4.9 ± 0.8 m2 g−1) to rBC number fraction of the mass-selected particles. The experiments are plotted as a function of rBC number fraction (the fraction of particles detected by the SP2 as compared to the CPC). When rBC particles dominated, the MACCPMA was in good agreement with the expected MACBC value, meaning that both the measured absorption and the mass in this case was associated with rBC.
Figure 4. Retrieved MACCPMA values at 401, 532, and 661 nm for thermodenuded biomass burning particles with a range of mobility size and mass selection. For the morphology-selected particles after the 250 °C TD: (A) the MAC normalized by the average total mass (MACCPMA) at 661 nm (marked in red circles) is plotted as a function of the number fraction of rBC particles (measured by the SP2) to the total number of particles (measured by the CPC). The expected calculated MACBC is plotted for comparison (dashed black lines), as we well as the absorption enhancement retrieved by our measurements, for the range MACCPMA 661 nm shown panel B combined with the maximum lensing range retrieved by the SP2 (blue bars). (B) The ratios of the MACCPMA at 401 (marked in blue), 532 (marked in green) to that measured at 661 nm as a function of the number fraction of rBC particles. Dashed and dotted lines show what the ratio would be for various AAE.
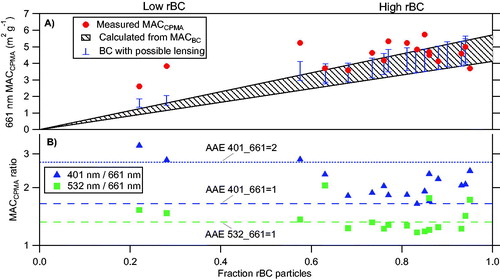
In contrast, at low rBC number fraction, values of MACCPMA were higher by factors of 2–4, depending on wavelength, than the expected value from BC alone. This confirms the presence of an additional absorber at 661 nm, since the fraction of BC present could not fully account for the observed absorption. It is possible that coating by a weakly absorbing material could enhance total BC-containing particle absorption (this phenomenon is often referred to as “lensing”). Our measurements were conducted after the samples passed through a 250 °C TD, which should remove most of such coatings, as confirmed by the SP2. Nonetheless, we have estimated the upper limit of the absorption enhancement caused by such residual coatings (blue bars, ) using the SP2 determination of particle optical size in combination with Mie theory for a shell-and-core morphology. The calculation of the upper limit to absorption enhancement was self-consistent with the Mie shell-and-core calculations that are part of the SP2 determination of coating thickness (Schwarz et al. Citation2008; see also Section 2.3).
shows the MACCPMA at three wavelengths (401, 532, and 661 nm), and their respective uncertainties. The AAE401–661 nm of the low rBC number fraction is between 2.0 and 2.4, intermediate between BC and BrC, whereas the measured AAE for the high rBC number fraction is lower, between 1.0 and 1.6, consistent with BC (). If we did not have the measurements of the rBC to compare to the total mass from the CPMA and the SEM images, we would naturally categorize this material as BC. The measured MACCPMA values when rBC particle do not dominate the number fraction are higher than the expected MACBC values and would be even higher if lower mass from the SP2 was used. Hence, this could provide an explanation for some of the high MACBC reported in previous literature (see discussion section below).
When BC particles dominate the aerosol population we calculate an average MACCPMA of 4.9 ± 0.8 m2 g−1 at 661 nm, which is slightly lower than the average values reported by Bond and Bergstrom (Citation2006) using AAE of 1 (6.25 m2 g−1 ± 1 at 660 nm) but in good agreement with ∼5 m2 g−1 extrapolated to 661 nm from Radney et al. (Citation2014) using an AAE of 1. Conversely, our value at 401 nm (12 m2 g−1) is in better agreement with Bond and Bergstrom (Citation2006) than with Radney et al. (Citation2014) (10.3 and 5.7 m2 g−1, respectively). Our AAE for chain-aggregate soot is somewhat larger than the value of 1 used by both of these references. SEM images of particles collected from several fires with a variety of fuel types were similar to those shown in , with agglomerated particles at a high rBC number fraction and predominantly spherical particles at a low rBC number fraction.
At low BC fractions, the aerosol still exhibits significant light absorption at 661 nm. If we attribute all the non-rBC mass to the additional intermediate absorber, the estimated MACCPMA of this intermediate absorber would be in the range of 0.9–2 m2 g−1 at 661 nm. This result is based on the three experiments with SP2 rBC number concentration <0.6 of the total number concentration measured with the CPC.
(4)
(4)
where MACIA is the MAC calculated for intermediate absorber; mrBC is the rBC mass concentration (measured by the SP2); mCPMA is the total average mass concentration measured using the CPMA and CPC, MACBC is the average MACCPMA measured in this study for predominantly rBC particles, L is the absorption enhancement (lensing).
The most likely explanation for the absorption which does not correspond to the literature MACBC is that there is significant absorption at 661 nm by an absorber that is nonvolatile at 250 °C but is not incandescent in the SP2. This could have important implications for the assumptions and measurement techniques applied to attribute absorption to BC and BrC.
3.3. The contribution of the intermediate absorber to the bulk optical properties of biomass burning smoke
During a recent aircraft study (2013 NASA SEAC4RS mission), we sampled the smoke plume from the Rim Fire, a wildland fire that started in Stanislaus National Forest near Yosemite National Park and was then the third largest in California’s history (Mason et al. Citation2018). rBC mass was measured using the SP2, and bulk aerosol absorption was measured using the same PAS instrument as in the experiments described above. In particular, during SEAC4RS the PAS measured light absorption at 661 nm both upstream and downstream of a 250 °C TD. The biomass burning aerosol showed high MACSP2 values, with average values of 19.2 m2 g−1 and 12.3 m2 g−1 upstream and downstream the TD, respectively. Parts of the plume had even higher MACSP2 values than the average (up to 18.4 ± 4.7 m2 g−1 at 661 nm downstream of the TD). For these cases we note a factor of ∼3 discrepancy between the measured MACSP2 and the literature BC value of freshly emitted BC (6.2 ± 1 m2g−1 at 661 nm) (Bond and Bergstrom Citation2006; Cross et al. 2010).
The absorption at 661 nm without a denuder agreed to within approximately 20% with an independently calibrated filter absorption measurement (Mason et al. Citation2018), hence the factor of ∼3 is far outside measurement uncertainty. The measured absorption in the Rim Fire plume could not be accounted for by a coating enhancement of BC absorption even if some coatings survived the TD (Figure S2). Likewise, there is no evidence to support a factor of ∼3 underestimate of rBC mass concentration by the SP2. The discrepancy in MACSP2 could be resolved by assuming that the Rim Fire smoke contained two absorbers at 661 nm, one that is rBC as defined operationally by incandescence, and the other that is an intermediate absorber as observed in our laboratory studies.
In addition to the morphology-selected experiments at the Fire Sciences Laboratory, we also measured the light absorption of a polydisperse aerosol population (i.e. no size and mass selection, setup 3). However, these experiments were conducted for different fuel types than the morphology-selected experiments, resulting in a BrC-dominant aerosol population. We focus on the 401 nm data in this case since we have additional water soluble BrC measurements after the 250 °C TD. Methanol-soluble BrC was not measured in this study.
Polydispersed aerosol (without morphology selection) was sampled using setup three shown in . The polydispersed data in shows the sum of BC and water-soluble BrC absorption downstream of the TD as a percentage of the total absorption at 401 nm measured by PAS as a function of different fires, ordered by the relative abundance of organic aerosols (OA) to BC mass. BC absorption was retrieved using the rBC mass as measured by the SP2, combined with MACBC found in this study for predominantly BC population (9.1 ± 1.1 m2 g−1 at 401 nm). The relative BC to OA is presented as an order rather than absolute values since the AMS collection efficiency and volatilized fraction after the TD are uncertain. Uncertainties in the light absorption in are probably 10–20% based on consistency of measurements from fire to fire. The absolute uncertainties are larger but do not apply because the same PAS and SP2 instruments are used both throughout and to define the rBC MAC ().
Figure 5. For the fires/fuel types with high BC content, the absorption of the polydisperse population retrieved from BC and water soluble BrC is presented as a function of the fire number ordered by the relative ratio of BC to OA. The dashed line shows the 100% absorption as detected by the PAS at 401 nm. The BC absorption was retrieved using the measured rBC mass and the MACBC found in this study (9.1 ± 1.1 m2 g−1 at 401 nm). The coating enhancement of BC absorption represents the maximum value calculated from the coating thickness retrieved by the SP2. The water-soluble BrC absorption was measured by the BrC PILS.
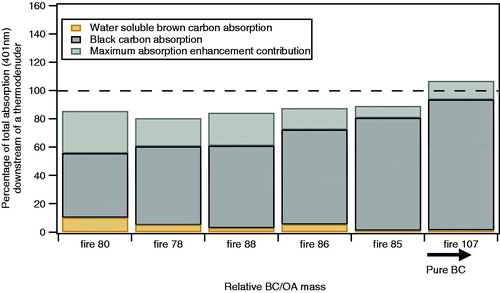
demonstrates that there is significant absorption at 401 nm from low-volatility species beyond that expected from BC. We do not have enough data on the amount of intermediate absorber present during these experiments to calculate an absorption closure, but the amount of intermediate absorber required to account for the 401 nm absorption in is within plausible limits (using the MACCPMA from ).
At 661 nm in the same experiments there was insufficient certainty regarding the MACBC for unambiguous results. If the MACBC at 661 nm is 6.2 m2 g−1 (Bond and Bergstrom Citation2006; Cross et al. 2010), then the measured 661 nm polydisperse absorption would be compatible with just BC without an additional intermediate absorber. If the MACBC at 661 nm−1 is closer to 4.9 m2 g−1 (our chain-aggregate soot data or Radney et al. (Citation2014)), then the measured polydisperse absorption at 661 nm would be compatible with the presence of an intermediate absorber as well as BC.
4. Discussion
4.1. Hypothesis of intermediate combustion material
Previous studies investigating premixed fuel combustion processes point to the existence of many intermediate products with characteristics between PAHs and BC. These intermediate products are described as liquid droplets that absorb light at 532 nm and contain clusters of PAHs (Kholghy et al. 2017), but do not incandesce (hence would not be measured by the SP2) (Michelsen Citation2017). Nanoparticles (1–2 nm), 10–20 nm liquid-like droplets, stacked PAHs, alkylated PAHs, and polymeric structures have all been proposed to exist in the soot formation region (review by Desgroux, Mercier, and Thomson Citation2013). Bimodal nanoparticle size distributions have been found, suggesting more than one process proceeding simultaneously. PAHs and nanoparticles are found simultaneously at different radial positions of a flame (Vander Wal, Jensen, and Choi Citation1997). Some intermediate products were shown to evaporate at lower temperatures than mature BC (Michelsen Citation2017). In addition, sufficiently small nascent soot particles would not incandesce in the continuous laser SP2 even if they are nonvolatile enough to incandesce in the pulsed LII often used in flame studies.
Bond and Bergstrom (Citation2006) addressed the existence of intermediate combustion materials by noting that the nature of a carbon particle depends on the pathway it has followed through the flame region and the exhaust. High temperatures in the flame (above 500 °C) affect both structural and optical properties, where the final molecular form depends not only on the maximum temperature but also on the residence time at each temperature (Bond and Bergstrom Citation2006). We note that biomass burning has erratic flames and hence may provide more opportunities for intermediate products to exit the fire than from a steady laboratory burner. Unsteady flames can have different emissions than similar steady flames (Shaddix, Harrington, and Smyth 1994). Saleh, Cheng, and Atwi (Citation2018) showed that BC and BrC particles lie on a continuum of light absorption and an increase in molecular size and decrease in volatility of the BrC species are associated with an increase in the BrC absorption. Saleh, Cheng, and Atwi (Citation2018) focused on benzene and toluene as a model fuel, while here we demonstrate the potential for this continuum using chemically varied biomass burning aerosols. We found distinct types of absorbing material on particles selected with differing morphologies that should affect the bulk light-absorption properties for a real fire with simultaneous types of burning conditions.
The properties of the intermediate absorber described here are consistent with two trends described in previous literature. First, combustion particles with larger MAC have a flatter wavelength dependence (lower Angstrom exponent) for absorption (Bond Citation2001). This relationship between absorption and spectral dependence has been described in terms of an optical band gap (Minutolo, Gambi, and D’Alessio Citation1996; Bond Citation2001). The intermediate absorber we describe follows this behavior, with a lower MAC and higher AAE than chain-aggregate soot (). This could be either the result of a material with an intermediate optical gap between BrC and BC, or particles internally composed of a mixture of materials with optical gaps similar to BrC and BC.
Second, combustion particles with smaller values of AAE have less hydrogen and organic content (Millikan Citation1961; Török et al. Citation2018). The chain-agglomerate particles where the BC mass nearly matches the CPMA mass have lower AAE than the spherical particles (). In addition, we examined the AMS mass spectra from the morphology-selected experiments shown in and , with lodgepole pine canopy fuel at a fixed mass (6 fg), and the 200 nm and 300 nm diameter selections. The spherical particles had relatively higher PAH abundance (Figure S3).
The intermediate absorber could arise from precursors to BC, partially formed BC, and/or absorbing, low volatility organics. Whatever the species, it would have to form or exit from a complex biomass burning fire more efficiently than from a typical laboratory burner. We also do not have enough data to know if the intermediate spherical particles are internally homogeneous or are each a mixture of low-volatility organics along with soot precursors too small or immature to incandesce. A future experiment could include more wavelengths in order to perform an optical gap analysis (Minutolo, Gambi, and D’Alessio Citation1996), higher resolution electron microscopy to look for inclusions, along with tracking absolute concentrations of the morphology-selected particles through the DMA and CPMA.
4.2. The relationship between the intermediate absorber and tar balls
This intermediate absorber could be related to what has been reported as “tar balls” or “BrC spheres” in aged smoke downwind of biomass- or biofuel burning emissions (Alexander, Crozier, and Anderson 2008; Chakrabarty et al. Citation2010, China et al. Citation2013). Some studies describing tar balls show similar characteristics to what we identify as an intermediate BC absorber. These previous studies described tar balls as amorphous particles 30–500 nm in diameter distinguished on filters as particles that remain spherical and do not wet the filter fibers. The optical properties of spherical BrC particles have been measured indirectly using electron energy-loss spectroscopy in a transmission electron microscope, demonstrating that these particles are strongly absorbing (refractive index of 1.67 + 0.27i at 550 nm) (Alexander, Crozier, and Anderson, Citation2008). Furthermore, tar balls were shown to survive a 200 °C heater (China et al. Citation2013) and are stable in an electron beam (Posfai et al. Citation2004), indicating that these organic components have low volatility. The relative abundance of tar balls in biomass burning aerosol is dependent on the aging of the particles and the distance from the source with some studies reporting tar balls comprising up to 90% (by number) of the particles analyzed in aged biomass smoke (Posfai et al. Citation2004).
Nonetheless, we do not say that tar balls are definitely the absorber with intermediate properties for three main reasons: (i) Tar balls are defined as spherical after sampling on an electron microscope grid. Our particles were selected as spherical while still aerosol (i.e. suspended in air going through the classifiers). There could be many liquid particles that are spherical when aerosol but partially flatten on an EM grid and hence are not tar balls. We cannot equate spherical aerosol particles with tar balls. Our SEM images do not have the resolution to distinguish tar balls. Some authors include chain aggregates of spheres in their definition of tar balls (e.g. Figure 3 in Hand et al. Citation2005). Such aggregates would not have been classified as spherical in our DMA-CPMA classification. (ii) There is disagreement about whether or not tar balls are present in fresh smoke (Posfai et al. Citation2004; Chakrabarty et al. Citation2010; Sedlacek et al. Citation2018). Our experiments were for fresh smoke held in a dark room. (iii) The definition of tar balls is vague—their chemical composition and degree of volatility vary across the literature. Tar balls may be either highly or weakly absorbing at 532–550 nm (Alexander, Crozier, and Anderson Citation2008; Chakrabarty et al. Citation2010; Li et al., Citation2019). Further work needs to be conducted on this topic to determine if the intermediate absorber (spherical particles) in fresh emissions is related to the previously reported tar balls.
5. Summary and implications
Biomass burning conditions range from smoldering to flaming. Since the flames are unsteady and uneven and the fires included non-flaming stages, some organic compounds, BC precursors, or partially-formed BC can presumably exit the fire without being fully processed. Thus, biomass burning seems a likely environment for a continuum of light-absorbing aerosol between BrC and BC. We have measured highly absorbing particles in biomass smoke that do not fit neatly into the definitions of either BrC or BC. Another group has a manuscript in preparation with entirely independent evidence for material in engine combustion aerosol that absorbs red and even near-infrared light but is not traditional BC (J. Corbin, Infrared-absorbing carbonaceous tar can dominate light absorption by marine-engine exhaust, private communication, 2018).
BrC includes a variety of materials with different degrees of volatility and chemical composition, depending on the formation processes, which consequently determines their absorption properties. The AAE of BrC could vary between 2 and 11 (Laskin, Laskin, and Nizkorodov Citation2015), possibly including intermediate absorbers on the absorption continuum of BC to BrC. Previous studies have pointed out the existence of organic material in biomass burning that absorbs light at 532–700 nm (e.g. Hoffer et al. Citation2017). Other studies report low volatility organics that survive a 250 °C TD (e.g. Saleh et al. Citation2014).
We have encountered a range of opinions on terminology, with some supporting our “intermediate” designation to emphasize a continuum between BrC and BC. However, others would simply expand the definition of BrC to include low-volatility material that absorbs red as well as blue light. Regardless of the terminology, it is important to consider some implications for the literature.
First, it is likely that there is some material that appears fairly black (i.e. AAE less than perhaps 3) in filter measurements but is not measured as rBC by the SP2. This could affect the comparisons between BC data from filters and the SP2.
Second, ambient measurements of MACBC often differ significantly from the modest range found for freshly emitted BC (Bond and Bergstrom, Citation2006; Cross et al. 2010; Forestieri et al. Citation2018). MACBC values retrieved from ambient measurements influenced by biomass burning vary from 3 to 50 m2 g−1 at 632 nm (Chan et al. Citation2011; Cheng et al. Citation2011, and references within), whereas global models use MACBC ranging from 2.3 to 18 m2 g−1 (Koch et al. 2009; Jacobson Citation2012). Two main explanations have been presented in the literature to explain the large range of MACBC in ambient measurements (Bond et al. 2013): (i) the light absorption represents a sum of BC and BrC, and (ii) the high MACBC values are a result of a BC core coated by another material. The first explanation applies primarily to blue wavelengths. High lensing absorption enhancements require particular conditions. Some enhancement of absorption is likely, but extreme enhancement, above ∼2, is unlikely except at wavelengths where the coatings themselves absorb (Bond and Bergstrom Citation2006; Adler et al. Citation2010). Here we suggest an alternative explanation for some of the high values measured in the past. We do not dismiss the traditional explanation of lensing, but rather suggest that some of the inconsistencies could also be explained by significant absorption by particles that do not incandesce at 1064 nm, in a similar way to that discussed above for the Rim Fire. In such a case, normalizing the red absorption to a BC mass measured by a SP2 instrument would produce a number that is difficult to interpret. That is, if there is low-volatility material that absorbs at red wavelengths but does not incandesce, the denominator in any MACSP2 would not include all of the absorbing mass.
Another important implication for the presence of this intermediate material may be the accuracy of the absorption enhancement retrieval (lensing). At longer wavelengths, the absorption enhancement has sometimes been defined simply as the ratio of observed absorption to that expected for uncoated BC, or as the ratio of absorption before and after a TD. The presence of absorbers with a continuum of volatility and absorption would complicate these definitions. Lack and Cappa (Citation2010) studied the effect of BrC coatings on absorption enhancement. However, the intermediate aerosol has a smaller AAE than they considered. A wide range of volatility and red absorption could explain why the literature is currently unclear about the actual absorption enhancement, with measurements ranging from 1 to 3 (Cappa et al. Citation2012; Liu et al. Citation2015).
To summarize, using a morphology-selection technique we separated and comprehensively characterized an additional low volatility spherical absorber at 661 nm. This absorber is composed of low volatility combustion products that absorb light at red wavelengths but is not the same as refractory BC. The presence of aerosol with properties intermediate between BrC and BC could explain the high MACSP2 values observed in the Rim Fire as well as other high MACBC values presented in the literature. To better understand absorbing aerosols formed during biomass burning, we must understand the range of processes that occur in pyrolysis, glowing combustion, and especially in unsteady fires with complex fuels. Further work is required to assess the importance of this intermediate product in ambient and laboratory studies as well as to investigate its chemical and optical evolution and its possible connection to previous measurements of different forms of BrC.
Supplemental data for this article is available on the publisher's website.
Download Zip (245.2 KB)Acknowledgments
The authors would like to thank Ann Reiser for the graphics and language editing. We would also like to thank Dr. James Roberts and Dr. Carsten Warneke for organizing the Missoula fire sciences laboratory experiment. The authors would also like to thank Cambustion Ltd, Cambridge UK for the use of the CPMA and Dr. Martin Irwin for guidance with the CPMA.
References
- Adler, G., A. A. Riziq, C. Erlick, and Y. Rudich. 2010. Effect of intrinsic organic carbon on the optical properties of fresh diesel soot. Proc. Natl. Acad. Sci. USA 107 (15):6699–6704. doi:10.1073/pnas.0903311106.
- Alexander, D. T. L., P. A. Crozier, and J. R. Anderson. 2008. Brown carbon spheres in East Asian outflow and their optical properties. Science 321 (5890):833–836. doi:10.1126/science.1155296.
- Andreae, M. O., and A. Gelencser. 2006. Black carbon or brown carbon? The nature of light-absorbing carbonaceous aerosols. Atmos. Chem. Phys. 6 (10):3131–3148. doi:10.5194/acp-6-3131-2006.
- Baumgardner, D., O. Popovicheva, J. Allan, V. Bernardoni, J. Cao, F. Cavalli, J. Cozic, E. Diapouli, K. Eleftheriadis, P. J. Genberg, et al. 2012. Soot reference materials for instrument calibration and intercomparisons: A workshop summary with recommendations. Atmos. Meas. Tech. 5 (8):1869–1887. doi:10.5194/amt-5-1869-2012.
- Bladh, H., N. E. Olofsson, T. Mouton, J. Simonsson, X. Mercier, A. Faccinetto, P. E. Bengtsson, and P. Desgroux. 2015. Probing the smallest soot particles in low-sooting premixed flames using laser-induced incandescence. Proc. Combust. Inst. 35 (2):1843–1850. doi:10.1016/j.proci.2014.06.001.
- Bond, T. C. 2001. Spectral dependence of visible light absorption by carbonaceous particles emitted from coal combustion. Geophys. Res. Lett. 28 (21):4075–4078.
- Bond, T. C., and R. W. Bergstrom. 2006. Light absorption by carbonaceous particles: An investigative review. Aerosol Sci. Technol. 40 (1):27–67. doi:10.1080/02786820500421521.
- Bond, T. C., S. J. Doherty, D. W. Fahey, P. M. Forster, T. Berntsen, B. J. DeAngelo, M. G. Flanner, S. Ghan, B. Karcher, D. Koch, et al. 2013. Bounding the role of black carbon in the climate system: A scientific assessment. J. Geophys. Res. Atmos. 118 (11):5380–5552. doi:10.1002/jgrd.50171.
- Cappa, C. D., T. B. Onasch, P. Massoli, D. R. Worsnop, T. S. Bates, E. S. Cross, P. Davidovits, J. Hakala, K. L. Hayden, B. T. Jobson, et al. 2012. Radiative absorption enhancements due to the mixing state of atmospheric black carbon. Science 337 (6098):1078–1081. doi:10.1126/science.1223447.
- Chakrabarty, R. K., H. Moosmuller, L. W. Chen, K. Lewis, W. P. Arnott, C. Mazzoleni, M. K. Dubey, C. E. Wold, W. M. Hao, and S. M. Kreidenweis. 2010. Brown carbon in tar balls from smoldering biomass combustion. Atmos. Chem. Phys. 10 (13):6363–6370. doi:10.5194/acp-10-6363-2010.
- Chan, T. W., J. R. Brook, G. J. Smallwood, and G. Lu. 2011. Time-resolved measurements of black carbon light absorption enhancement in urban and near-urban locations of Southern Ontario, Canada. Atmos. Chem. Phys. 11 (20):10407–10432. doi:10.5194/acp-11-10407-2011.
- Cheng, Y., K. B. He, M. Zheng, F. K. Duan, Z. Y. Du, Y. L. Ma, J. H. Tan, F. M. Yang, J. M. Liu, X. L. Zhang, et al. 2011. Mass absorption efficiency of elemental carbon and water-soluble organic carbon in Beijing, China. Atmos. Chem. Phys. 11 (22):11497–11510. doi:10.5194/acp-11-11497-2011.
- China, S., C. Mazzoleni, K. Gorkowski, A. C. Aiken, and M. K. Dubey. 2013. Morphology and mixing state of individual freshly emitted wildfire carbonaceous particles. Nat. Commun. 4:2122.
- Cross, E. S., T. B. Onasch, A. Ahern, W. Wrobel, J. G. Slowik, J. Olfert, D. A. Lack, P. Massoli, C. D. Cappa, J. P. Schwarz, et al. 2010. Soot particle studies—Instrument inter-comparison—project overview. Aerosol Sci. Technol. 44 (8):592–611. doi:10.1080/02786826.2010.482113.
- Desgroux, P., X. Mercier, and K. A. Thomson. 2013. Study of the formation of soot and its precursors in flames using optical diagnostics. Proc. Combustion Inst. 34:1713–1738.
- Forestieri, S. D., T. M. Helgestad, A. T. Lambe, L. Renbaum-Wolff, D. A. Lack, P. Massoli, E. S. Cross, M. K. Dubey, C. Mazzoleni, J. S. Olfert, et al. 2018. Measurement and modeling of the multiwavelength optical properties of uncoated flame-generated soot. Atmos. Chem. Phys. 18 (16):12141–12159. doi:10.5194/acp-18-12141-2018.
- Forrister, H., J. Liu, E. Scheuer, J. Dibb, L. Ziemba, K. L. Thornhill, B. Anderson, G. Diskin, A. E. Perring, J. P. Schwarz, et al. 2015. Evolution of brown carbon in wildfire plumes. Geophys. Res. Lett. 42 (11):4623–4630. doi:10.1002/2015GL063897.
- Hand, J. L., W. C. Malm, A. Laskin, D. Day, T. Lee, C. Wang, C. Carrico, J. Carrillo, J. P. Cowin, J. Collett Jr., and M. J. Iedema. 2005. Optical, physical, and chemical properties of tar balls observed during the Yosemite Aerosol Characterization Study. J. Geophys. Res. 110:D21210. doi:10.1029/2004JD005728.
- Hecobian, A., X. Zhang, M. Zheng, N. Frank, E. S. Edgerton, and R. J. Weber. 2010. Water-soluble organic aerosol material and the light-absorption characteristics of aqueous extracts measured over the southeastern United States. Atmos. Chem. Phys. 10 (13):5965–5977. doi:10.5194/acp-10-5965-2010.
- Hoffer, A., A. Toth, M. Posfai, C. E. Chung, and A. Gelencser. 2017. Brown carbon absorption in the red and near-infrared spectral region. Atmos. Meas. Tech. 10 (6):2353–2359. doi:10.5194/amt-10-2353-2017.
- Jacobson, M. Z. 2012. Investigating cloud absorption effects: Global absorption properties of black carbon, tar balls, and soil dust in clouds and aerosols. J. Geophys. Res. Atmos. 117:D06205.
- Kholghy, M. R., Y. Afarin, A. D. Sediako, J. Barba, M. Lapuerta, C. Chu, J. Weingarten, B. Borshanpour, V. Chernov, and M. J. Thomson. 2017. Comparison of multiple diagnostic techniques to study soot formation and morphology in a diffusion flame. Combust. Flame 176:567–583. doi:10.1016/j.combustflame.2016.11.012.
- Kirchstetter, T. W., and T. L. Thatcher. 2012. Contribution of organic carbon to wood smoke particulate matter absorption of solar radiation. Atmos. Chem. Phys. 12 (14):6067–6072. doi:10.5194/acp-12-6067-2012.
- Koch, D., M. Schulz, S. Kinne, C. McNaughton, J. R. Spackman, Y. Balkanski, S. Bauer, T. Berntsen, T. C. Bond, O. Boucher, et al. 2009. Evaluation of black carbon estimations in global aerosol models. Atmos. Chem. Phys. 9 (22):9001–9026. doi:10.5194/acp-9-9001-2009.
- Laborde, M., M. Schnaiter, C. Linke, H. Saathoff, K. H. Naumann, O. Mohler, S. Berlenz, U. Wagner, J. W. Taylor, D. Liu, et al. 2012. Single particle soot photometer intercomparison at the AIDA chamber. Atmos. Meas. Tech. 5 (12):3077–3097. doi:10.5194/amt-5-3077-2012.
- Lack, D., and C. D. Cappa. 2010. Impact of brown and clear carbon on light absorption enhancement, single scatter albedo and absorption wavelength dependence of black carbon. Atmos. Chem. Phys. 10 (9):4207–4220. doi:10.5194/acp-10-4207-2010.
- Lack, D. A., J. M. Langridge, R. Bahreini, C. D. Cappa, A. M. Middlebrook, and J. P. Schwarz. 2012. Brown carbon and internal mixing in biomass burning particles. Proc. Natl. Acad. Sci. USA 109 (37):14802–14807. doi:10.1073/pnas.1206575109.
- Lack, D. A., M. S. Richardson, D. Law, J. M. Langridge, C. D. Cappa, R. J. McLaughlin, and D. M. Murphy. 2012. Aircraft instrument for comprehensive characterization of aerosol optical properties, part 2: Black and brown carbon absorption and absorption enhancement measured with photo acoustic spectroscopy. Aerosol Sci. Technol. 46 (5):555–568. doi:10.1080/02786826.2011.645955.
- Lack, D. A., H. Moosmuller, G. R. McMeeking, R. K. Chakrabarty, and D. Baumgardner. 2014. Characterizing elemental, equivalent black, and refractory black carbon aerosol particles: A review of techniques, their limitations and uncertainties. Anal. Bioanal. Chem. 406 (1):99–122. doi:10.1007/s00216-013-7402-3.
- Laskin, A., J. Laskin, and S. A. Nizkorodov. 2015. Chemistry of atmospheric brown carbon. Chem. Rev. 115 (10):4335–4382. doi:10.1021/cr5006167.
- Li, C., Q. He, J. Schade, J. Passig, R. Zimmermann, D. Meidan, A. Laskin, and Y. Rudich. 2019. Dynamic changes in optical and chemical properties of tar ball aerosols by atmospheric photochemical aging. Atmos. Chem. Phys. 19 (1):139–163. 2019. doi:10.5194/acp-19-139-2019.
- Liao, J., C. A. Brock, D. M. Murphy, D. T. Sueper, A. Welti, and A. M. Middlebrook. 2017. Single-particle measurements of bouncing particles and in situ collection efficiency from an airborne aerosol mass spectrometer (AMS) with light-scattering detection. Atmos. Meas. Tech. 10 (10):3801–3820. doi:10.5194/amt-10-3801-2017.
- Lin, P., P. K. Aiona, Y. Li, M. Shiraiwa, J. Laskin, S. A. Nizkorodov, and A. Laskin. 2016. Molecular characterization of brown carbon in biomass burning aerosol particles. Environ. Sci. Technol. 50 (21):11815–11824. doi:10.1021/acs.est.6b03024.
- Liu, S., A. C. Aiken, K. Gorkowski, M. K. Dubey, C. D. Cappa, L. R. Williams, S. C. Herndon, P. Massoli, E. C. Fortner, P. S. Chhabra, et al. 2015. Enhanced light absorption by mixed source black and brown carbon particles in UK winter. Nat. Commun. 6:8435.
- Lu, Z. F., D. G. Streets, E. Winijkul, F. Yan, Y. J. Chen, T. C. Bond, Y. Feng, M. K. Dubey, S. Liu, J. P. Pinto, et al. 2015. Light absorption properties and radiative effects of primary organic aerosol emissions. Environ. Sci. Technol. 49 (8):4868–4877. doi:10.1021/acs.est.5b00211.
- Mason, B., N. L. Wagner, G. Adler, E. Andrews, C. A. Brock, T. D. Gordon, D. A. Lack, A. E. Perring, M. S. Richardson, J. P. Schwarz, et al. 2018. An inter-comparison of aerosol absorption measurements conducted during the SEAC4RS campaign. Aerosol Sci. Technol. 52 (9):1012–1027. doi:10.1080/02786826.2018.1500012.
- Michelsen, H. A. 2017. Probing soot formation, chemical and physical evolution, and oxidation: A review of in situ diagnostic techniques and needs. Proc. Combust. Inst. 36 (1):717–735. doi:10.1016/j.proci.2016.08.027.
- Millikan, R. C. 1961. Optical properties of soot. J. Opt. Soc. Am. 51 (6):698–699. doi:10.1364/JOSA.51.000698.
- Minutolo, P., G. Gambi, and A. D’Alessio. 1996. The optical band gap model in the interpretation of the UV-visible absorption spectra of rich premixed flames. In Twenty-Sixth Symposium (International) on Combustion, 951–957. Combustion Institute. doi:10.1016/S0082-0784(96)80307-9.
- Moteki, N., Y. Kondo, and S. Nakamura. 2010. Method to measure refractive indices of small nonspherical particles: Application to black carbon particles. J. Aerosol Sci. 41 (5):513–521. doi:10.1016/j.jaerosci.2010.02.013.
- Petzold, A., J. A. Ogren, M. Fiebig, P. Laj, S. M. Li, U. Baltensperger, T. Holzer-Popp, S. Kinne, G. Pappalardo, N. Sugimoto, et al. 2013. Recommendations for reporting “black carbon” measurements. Atmos. Chem. Phys. 13 (16):8365–8379. doi:10.5194/acp-13-8365-2013.
- Posfai, M., A. Gelencser, R. Simonics, K. Arato, J. Li, P. V. Hobbs, and P. R. Buseck. 2004. Atmospheric tar balls: Particles from biomass and biofuel burning. J. Geophys. Res.: Atmos. 109:D06213.
- Quay, B., T. W. Lee, T. Ni, and R. J. Santoro. 1994. Spatially resolved measurements of soot volume fraction using laser-induced incandescence. Combust. Flame 97 (3–4):384–392. doi:10.1016/0010-2180(94)90029-9.
- Radney, J. G., R. You, X. Ma, J. M. Conny, M. R. Zachariah, J. T. Hodges, and C. D. Zangmeister. 2014. Dependence of soot optical properties on particle morphology: Measurements and model comparisons. Environ. Sci. Technol. 48 (6):3169–3176. doi:10.1021/es4041804.
- Saleh, R., Z. Cheng, and K. Atwi. 2018. The brown–black continuum of light-absorbing combustion aerosols. Environ. Sci. Technol. Lett. 5 (8):508–513. doi:10.1021/acs.estlett.8b00305.
- Saleh, R., E. S. Robinson, D. S. Tkacik, A. T. Ahern, S. Liu, A. C. Aiken, R. C. Sullivan, A. A. Presto, M. K. Dubey, R. J. Yokelson, et al. 2014. Brownness of organics in aerosols from biomass burning linked to their black carbon content. Nat. Geosci. 7 (9):647–650. doi:10.1038/ngeo2220.
- Schwarz, J. P., J. R. Spackman, D. W. Fahey, R. S. Gao, U. Lohmann, P. Stier, L. A. Watts, D. S. Thomson, D. A. Lack, L. Pfister, et al. 2008. Coatings and their enhancement of black carbon light absorption in the tropical atmosphere. J. Geophys. Res.: Atmos. 113:D03203. doi:10.1029/2007JD009042.
- Schwarz, J. P., J. R. Spackman, R. S. Gao, A. E. Perring, E. Cross, T. B. Onasch, A. Ahern, W. Wrobel, P. Davidovits, J. Olfert, et al. 2010. The detection efficiency of the single particle soot photometer. Aerosol Sci. Technol. 44 (8):612–628. doi:10.1080/02786826.2010.481298.
- Sedlacek, A. J., III, P. R. Buseck, K. Adachi, T. B. Onasch, S. R. Springston, and L. Kleinman. 2018. Formation and evolution of tar balls from northwestern US wildfires. Atmos. Chem. Phys. 18:11289–11301. doi:10.5194/acp-18-11289-2018.
- Selimovic, V., R. J. Yokelson, C. Warneke, J. M. Roberts, J. de Gouw, J. Reardon, and D. W. T. Griffith. 2018. Aerosol optical properties and trace gas emissions by PAX and OP-FTIR for laboratory-simulated Western US wildfires during FIREX. Atmos. Chem. Phys. 18 (4):2929–2948. doi:10.5194/acp-18-2929-2018.
- Shaddix, C. R., J. E. Harrington, and K. C. Smyth. 1994. Quantitative measurements of enhanced soot production in a flickering methane/air diffusion flame. Combust. Flame 99 (3–4):723–732. doi:10.1016/0010-2180(94)90067-1.
- Stockwell, C. E., R. J. Yokelson, S. M. Kreidenweis, A. L. Robinson, P. J. DeMott, R. C. Sullivan, J. Reardon, K. C. Ryan, D. W. T. Griffith, and L. Stevens. 2014. Trace gas emissions from combustion of peat, crop residue, domestic biofuels, grasses, and other fuels: Configuration and Fourier transform infrared (FTIR) component of the fourth Fire Lab at Missoula Experiment (FLAME-4). Atmos. Chem. Phys. 14 (18):9727–9754. doi:10.5194/acp-14-9727-2014.
- Tang, M., J. M. Alexander, D. Kwon, A. D. Estillore, O. Laskina, M. A. Young, P. D. Kleiber, and V. H. Grassian. 2016. Optical and physicochemical properties of brown carbon aerosol: Light scattering, FTIR extinction spectroscopy, and hygroscopic growth. J. Phys. Chem. A 120 (24):4155–4166. doi:10.1021/acs.jpca.6b03425.
- Török, S., V. B. Malmborg, J. Simonsson, A. Eriksson, J. Martinsson, M. Mannazhi, J. Pagels, and P.-E. Bengtsson. 2018. Investigation of the absorption Ångström exponent and its relation to physicochemical properties for mini-CAST soot. Aerosol Sci. Technol. 52 (7):757–767. doi:10.1080/02786826.2018.1457767.
- Vander Wal, R. L., K. A. Jensen, and M. Y. Choi. 1997. Simultaneous laser-induced emission of soot and polycyclic aromatic hydrocarbons within a gas-jet diffusion flame. Combust. Flame 109 (3):399–414. doi:10.1016/S0010-2180(96)00189-7.