
 ?Mathematical formulae have been encoded as MathML and are displayed in this HTML version using MathJax in order to improve their display. Uncheck the box to turn MathJax off. This feature requires Javascript. Click on a formula to zoom.
Abstract
A growing number of carbon nanotubes and nanofibers (CNT/F) exposure and epidemiologic studies have utilized 25- and 37-mm open-faced cassettes (OFCs) to assess the inhalable aerosol fraction. It has been previously established that the 37-mm OFC undersamples particles >20 µm in diameter, but the size-selective characteristics of the 25-mm OFC have not yet been fully evaluated. This article describes an experimental study conducted to determine if the 25- and 37-mm OFCs performed with relative equivalence to a reference inhalable aerosol sampler when challenged with CNT/F particles. Side-by-side paired samples were collected within a small Venturi chamber using a 25-mm styrene OFC, 37-mm styrene OFC, 25-mm aluminum OFC, and button inhalable aerosol sampler. Three types of CNT/F materials and an Arizona road dust were used as challenge aerosols for the various sampler configurations. Repeated experiments were conducted for each sampler configuration and material. The OFC samplers operated at flow rates of 2 and 5 L/min. Results showed that the 25-mm OFC performed comparably to the button sampler when challenged with CNT/F aerosols, which was demonstrated in five of the six experimental scenarios with an average error of 21%. Overall, the results of this study indicate that the sampling efficiency of the 25- and 37-mm OFCs adequately followed the ISO/ACGIH/CEN inhalable sampling convention when challenged with CNT/F aerosols. Past exposure and epidemiologic studies that used these OFC samplers can directly compare their results to studies that have used other validated inhalable aerosol samplers.
Introduction
Workplace exposures to carbon nanotubes and nanofibers (CNT/F) can occur during primary production as well as in downstream manufacturing within the advanced composites, electronics, and coatings industries (Dahm et al. Citation2018). Within these industries, the most significant exposure sources to CNT/F include handling the dry-powdered form of CNT/F, handling daily quantities of material in excess of 1 kg, and the use of inadequate engineering controls (Dahm, Bertke, and Schubauer-Berigan Citation2019). Although the number of workers involved in the manufacturing and use of CNT/F is relatively small, it is growing steadily (Schubauer-Berigan, Dahm, and Yencken Citation2011; Babik et al. Citation2018). Health hazards caused by occupational exposures to CNT/F have not been confirmed in humans, but accumulating evidence from animal toxicity studies have suggested that exposures may cause pulmonary inflammation, fibrosis, malignant transformations, as well as immunological, neurological, and cardiovascular effects (Kobayashi, Izumi, and Morimoto Citation2017).
Currently, there are no consensus measurement methods to assess occupational exposures to CNT/F, but multi-metric approaches have been suggested. These approaches include collecting data on number, surface-area, mass concentration, particle size distribution, and the use of other analysis methods such as electron microscopy and elemental carbon (EC) analysis (Ramachandran et al. Citation2011; Brouwer et al. Citation2012; Eastlake et al. Citation2016). Additionally, several occupational exposure limits (OELs) have been developed for CNT/F by international agencies and research groups for the exposure metrics of mass, ranging from 1 to 80 µg/m3, and number concentration at 0.01 fibers/cm3 using microscopy-based methods (Ellenbecker et al. Citation2018). However, few OELs have provided adequate information regarding sampling details that includes the aerosol size fraction of interest, which ultimately dictates sampler selection.
Subsequently, a growing number of CNT/F exposure assessment and cross-sectional epidemiologic studies have used the 25-mm and/or 37-mm open-faced cassette (OFC) as a “total” or inhalable personal and area aerosol sampler (Maynard et al. Citation2004; Han et al. Citation2008; Lee et al. Citation2010; Birch et al. Citation2011; Ogura et al. Citation2011; Dahm et al. Citation2012, Citation2015, Citation2018; Lee et al. Citation2013; Hedmer et al. Citation2014; Lee et al. Citation2015; Fatkhutdinova et al. Citation2016a). However, it has been previously established that the 37-mm OFC generally under-samples particles >20 µm in diameter and should not be considered a “total” dust sampler (Kenny et al. Citation1997; Bartley Citation1998; Kenny et al. Citation1999; Demange et al. Citation2002). Additionally, the aerosol particle size-selective characteristics of the 25-mm OFC have not yet been fully evaluated, but is expected to be similar to that of the 37-mm OFC (Bartley Citation1998; Liden and Surakka Citation2009).
The 25- and 37-mm OFC samplers used in these CNT/F studies were primarily chosen because CNT/F aerosols were expected to consist of agglomerates below 20 µm in equivalent diameter, which has since been validated (Hedmer et al. Citation2014; Dahm et al. Citation2015, Citation2018; Kuijpers et al. Citation2016). Furthermore, the OFC samplers were selected due to their ability to operate at elevated flow rates (≥5 liters per minute [Lpm]) compared to many commercial inhalable samplers. This enabled a better limit of detection (LOD) for the various elemental and gravimetric analyses used in these exposure studies (NIOSH Citation2013). However, the 25-mm OFC has been preferentially used, as opposed to the 37-mm OFC, due to its ability to further improve the LOD by decreasing the surface area of the filter (NIOSH Citation2013; Dahm et al. Citation2015).
In addition, studies have shown that material deposited on the inside surfaces of closed-face cassette (CFC) samplers can often constitute a significant fraction of the aerosol that enters the sampler (Ashley and Harper Citation2013). This would be expected to occur when using OFC samplers as well. There are different mechanisms that can lead to particles being deposited on internal surfaces, including direct impaction, gravitational settling, interception during transport, particle bounce from the filter, and electrostatic attraction (Baron and Deye Citation1990). Of greater concern for the sampling of CNT/F aerosols when using OFC samplers are wall losses from electrostatic attraction. This is due to electrostatic forces having a greater impact on the deposition of particles smaller than 10 µm (Wang et al. Citation2001; L'Orange et al. Citation2016).
In general, sampler accuracy must be documented for defensible workplace exposure assessments and for making unbiased dose–response analyses for epidemiological research (Bartley Citation2001). Therefore, if the overall sampling efficiency of the OFCs significantly differs from the inhalable aerosol fraction when sampling CNT/F, past exposure assessments and cross-sectional epidemiologic studies evaluating CNT/F may have misclassified exposures, making comparisons with other studies difficult. Thus, experimental studies were conducted within a small chamber aerosolizing three different types of CNT/F with the primary objective to determine if 25- and 37-mm OFCs performed with relative equivalence to a reference inhalable aerosol sampler in side-by-side comparisons when challenged to CNT/F aerosols. Secondary objectives of this study were to determine if the assumed equivalence between the 25- and 37-mm OFCs are accurate and determine the effect of electrostatic attraction on OFCs when sampling CNT/F.
Methods
Sampler selection
The three-piece 37-mm styrene OFC (SKC Inc., Eighty Four, PA, USA) has historically been one of the most widely used industrial hygiene “total” dust samplers in the U.S. The open-faced configuration contains a 37-mm inlet orifice, and the sampler has been traditionally operated at a flow rate of 2 Lpm. The 37-mm OFC was chosen for this investigation because it has been extensively studied and used as an inhalable sampler in previous CNT/F exposure assessment efforts.
The three-piece 25-mm styrene OFC (SKC Inc.) was the primary sampler of interest in this study. The sampling efficiency of the 25-mm OFC has not been thoroughly studied, but has generally been assumed to exhibit a similar sampling efficiency as the 37-mm OFC. This sampler has been used in cross-sectional epidemiologic studies by several international investigators to assess exposures to CNT/F materials at the assumed inhalable aerosol size-fraction (Lee et al. Citation2015; Fatkhutdinova et al. Citation2016b; Shvedova et al. Citation2016; Schubauer-Berigan et al. Citation2018; Beard et al. Citation2018).
A 25-mm aluminum OFC was machined to the exact size dimensions and specifications as the 25-mm styrene OFC and used in this study to assess electrostatic effects that may alter the sampling efficiency of a traditional 25-mm styrene OFC.
The Button Inhalable Aerosol Sampler (SKC Inc.) was used in this study as the reference sampler for the inhalable aerosol size-fraction. The sampler consists of a spherical shell inlet with numerous regularly spaced holes, covering a porosity of 21% of the total surface and function as orifices (Harper and Muller Citation2002). The uniform distribution of the holes on the curved inlet results in an even distribution of particles on the 25-mm filter surface (Aizenberg et al. Citation2000). Several laboratory and field studies have shown that the performance of the sampler has good concurrence with the ACGIH/CEN EN 481/ISO 7708 (American Conference of Governmental Industrial Hygienists, Comité Européen de Normalisation, International Organization for Standardization) inhalable sampling convention (CEN Citation1993; ISO Citation1995; Hauck et al. Citation1997; ACGIH Citation1999; Aizenberg et al. Citation2000; Aizenberg et al. Citation2001). This sampler was selected because the placement of the filter directly behind the inlet reduces wall losses and the sampler is made of aluminum, which reduces its susceptibility to electrostatic effects (Aizenberg et al. Citation2000). All samplers utilized 25-mm or 37-mm PVC filters with pore sizes of 5 µm (SKC Inc.). The styrene OFC samplers used cellulose back-up pads while the 25-mm aluminum OFC and Button Sampler used a metal mesh back-up pad.
Material selection
Two different types of multi-walled carbon nanotubes (MWCNT) and one type of carbon nanofiber (CNF) of varying lengths and diameters, along with a coarse Arizona Road Dust (ARD) used as a positive control, were selected to be challenge aerosols for the various sampler configurations in this study. The CNT/F materials were chosen based on an observed high volume of use within the U.S. and due to their unique particle diameters and lengths. Bulk samples for each of the CNT/F materials were analyzed using a high-resolution field emission scanning electron microscope with scanning transmission electron microscopy capabilities (FESEM/STEM, S-5500, Hitachi High Technologies America, Schaumburg, IL). The analysis compared the company reported material diameters and lengths by sizing the first 200 fibers viewed following the protocols outlined in Bishop et al. (Citation2017).
MWCNT 1 (MW1): MW1 had a diameter of 6–9 nm along with a length of 5 µm as reported by the manufacturer. Bulk analysis by electron microscopy found a geometric mean (GM) diameter of 13 nm (geometric standard deviation [GSD], 1.36) with a GM length of 0.67 µm (GSD, 1.81).
MWCNT 2 (MW2): MW2 had a manufacturer-reported diameter of 70–80 nm; the company did not report the particle length. Bulk samples analyzed by electron microscopy were found to have a GM diameter of 24 nm (GSD, 1.82) and GM length of 1.58 µm (GSD, 3.00).
CNF 1: The CNF material used in this study had a diameter of 100 nm and reported length of 50–200 µm as reported by the manufacturer. Bulk samples analyzed by electron microscopy were found to have a GM diameter of 102 nm (GSD, 1.44) and GM length of 3.64 µm (GSD, 2.37).
ARD: The coarse ARD (Powder Technologies Inc., Arden Hills, MN, USA) used in this study met ISO 12103-1 filtration standards, and was chosen because at least 60% of its composition, by mass, was comprised of particles with aerodynamic diameters above 20 µm. The ARD aerosol was used as a positive control as it has been found that OFCs generally under-sample particles >20 μm in aerodynamic diameter, as stated previously.
Powder and filter weighing
The powder and filter weighing protocols used in this study were adopted from Evans et al. (Citation2013). In brief, two days prior to any aerosolization experiments, a small batch of the desired material (∼100 mg) and PVC filters were conditioned overnight in a humidity-controlled antechamber set at 50% RH (±3) constructed of static dissipative acrylic prior to weighing. Five milligram aliquots of each powdered material were then placed in aluminum weighing boats and weighed using a microbalance (Mettler AT20, Columbus, OH) that was also situated within a constant humidity controlled weighing enclosure. After the 5 mg aliquots were weighed, they were placed into petri dishes and again stored overnight in the antechamber prior to aerosolization. Additionally, all 25- and 37-mm PVC filters were pre-and post-weighed using the same microbalance. After weighing, the filters were stored in petri dishes within the humidity-controlled antechamber until they were loaded into the specified sampler. The LOD for the gravimetric mass analysis for both 25- and 37-mm PVC filters was found to be 0.01 mg per sample.
Aerosolization method
The samplers were placed in a small Venturi Dustiness Tester (VDT) where three different CNT/F aerosols were generated along with the coarse Arizona Road Dust. The VDT was selected due to its ability to utilize small quantities of powder (5 mg) under confined conditions (Boundy, Leith, and Polton Citation2006; Evans et al. Citation2013). This small aerosol chamber is ideal for dealing with hazardous powders, as it uses small quantities of material to generate a reproducible aerosol within an enclosed set-up and has been validated experimentally to provide reproducible results (Boundy, Leith, and Polton Citation2006; Evans et al. Citation2013; Evans et al. Citation2014; Dubey, Ghia, and Turkevich Citation2017). The VDT aerosolization method involves more aggressive airflows than those typically encountered in large-scale workplace activities, but is expected to resemble energetic dust dispersion activities such as the use of compressed air to clean contaminated protective clothing or work surfaces (Evans et al. Citation2013).
The VDT employs a 5.7-L chamber made of static dissipative Plexiglas, in this instance, into which the CNT/F aerosols were generated (Figure S1). The CNT/F materials (5 ± 0.1 mg aliquot) were injected into the chamber through an inlet nozzle (d = 0.44 cm) that consists of a stainless-steel tube bent at 90° which pierces the midsection of the front wall of the chamber. The operation of the VDT consists of two phases, the injection phase and the sampling phase. During the injection phase, air is introduced into the chamber through three outflow ports, which include an extraction port and two sampler ports. The combined airflow through the extraction and two sampling ports totals 60 Lpm at injection, which is independent of sampler configuration and lasts the first 1.5 s after activation of the VDT. During the injection phase the powders are swept into the chamber with an inlet velocity of ∼66 m/s, which reproducibly aerosolizes the materials. After the initial 1.5 s of the injection phase, the extraction port is closed while the two sampler ports remain open and continue to collect sample for the remaining 240 s of the sampling phase. The VDT is connected to vacuum pumps through a regulator and gauge that pull air through the extraction and two sampler ports. The flow rates for the samplers using the sampling ports were calibrated before each experiment using a Bios 520 Defender Calibrator (MesaLabs, Butler, NJ, USA) while the flow rate for the extraction port was calibrated using a mass flowmeter (model 4040, TSI, Shoreview, MN, USA).
To collect a sufficient mass on the PVC collection filters, two successive dispersions were collected for each CNT/F and ARD materials. Therefore, each sample consisted of 10 mg of material (two separate 5 mg samples) being aerosolized, with a total VDT operation time 480 s. After each sample collection, the PVC filters were removed from their respective samplers and placed in petri dishes, which were then stored in the humidity-controlled antechamber overnight and postweighed, as described above. The chamber, injection nozzle, and samplers were cleaned between each successive sample collection with an ultra-low penetration air filtered vacuum and the use of a dry, electrostatic wipe. A more thorough cleaning with isopropyl alcohol wipes was performed to the chamber prior to introducing a new CNT/F or ARD material.
Experimental design
The VDT only allows the use of two samplers in the chamber per experimental run, so the following three sampler configurations were used to answer each study objective.
Configuration 1 consisted of the 25-mm styrene OFC and the button sampler which were paired together to determine the concurrence of the 25-mm OFC to a reference inhalable aerosol sampler when challenged with CNT/F aerosols.
Configuration 2 consisted of the 25-mm and the 37-mm styrene OFCs that were paired to determine if the OFC samplers offer comparable results.
Configuration 3 consisted of a 25-mm aluminum OFC and the button sampler to determine whether electrostatic interactions between the particle and the samplers affected the overall sampling results.
All samplers were connected to the VDT with tygon tubing and were hung, so each sampling orifice was at identical height (Figure S2). Additionally, for Configuration 3, both the 25-mm aluminum OFC and button sampler were electrostatically grounded to reduce any electrostatic effects, while the samplers in Configurations 1 and 2 remained ungrounded.
The conventional flow rate for aerosol collection using OFC samplers is 2 Lpm, but many of the studies that assessed exposures to CNT/F materials deployed OFCs operating at an elevated flow rate of 5 Lpm, or higher. An increased sample volume was necessary to reduce the limit of detection for the analytical method of EC mass (Dahm et al. Citation2012). Therefore, each set of sampler configurations were tested at different flow rates of 2 and 5 Lpm. However, the button sampler was tested only at the manufacturer-specified flow rate of 4 Lpm for each experimental configuration. For example, airflows through the extraction and sampling ports for Configuration 1 at the flow rate of 2 Lpm would be 2 Lpm for the 25-mm OFC, 4 Lpm for the Button Sampler, and 54 Lpm for the injection flow rate for a total airflow of 60 Lpm (Figure S1). Although the sampler flow rates changed for each experimental scenario, a consistent injection airflow of 60 Lpm was maintained. Each experiment was repeated 15 times for each of the three sampler configurations, flow rates, and for each of the CNT/F and ARD materials. A set of media blanks were also collected and analyzed for each experimental scenario and all samples were media blank corrected.
Size-distribution measurements
Aerodynamic diameter size-distribution measurements were conducted within the VDT. These measurements were collected using an electrical low-pressure impactor (ELPI; Dekati, Tampere, Finland) and an aerodynamic particle sizer (APS, 3021 TSI Inc.). These measurements provided overlapping particle size distributions (by number) from 27 nm to 20 μm (ELPI, 27 nm to 10 μm and APS from 500 nm to 20 μm).
Three separate dispersions of 5 mg for each of the four materials were aerosolized within the VDT for the size-distribution measurements. These experiments used a sampler configuration described in Evans et al. (Citation2010, Citation2013) with all instruments sampling through a single sampling port connected to the VDT chamber through a three-way valve that was also connected to an HEPA filter. Immediately following the material dispersion in the VDT, the three-way valve was switched from sampling through the HEPA filter to sampling the aerosol generated in the VDT. All instruments were set to log data every second and data for the first 15 s of each dispersion were collected and were repeated in triplicate for each material using the same experimental conditions as described above. During these size distribution experiments, samples were also collected using 25-mm styrene OFC samplers with mixed cellulose ester filters (0.8 μm pore size; SKC, Inc.) and analyzed by transmission electron microscopy (JEOL USA, Inc., Peabody, MA, USA) to examine particle morphology.
Data analysis
Means and standard deviations were calculated for the gravimetric mass of the 15 paired samples per configuration. As the sampler configurations were not collected as independent samples, but as paired tests, the averaged percent error between all 15-paired samples was reported along with the corresponding 95% confidence interval. The averaged percent error was calculated using EquationEquation (1)(1)
(1) where the reference samplers were considered the button samplers in Configurations 1 and 3 and the 25-mm OFC in Configuration 2. Negative and positive values represent the experimental sampler under-sampling or over-sampling the aerosol compared to the reference sampler, respectively.
(1)
(1)
Nondetectable concentrations were replaced using the LOD/√2 method, which is recommended when relatively few data points are below the LOD (Hornung and Reed Citation1990). All statistical analyses were performed within Microsoft Excel.
Results
A total of 720 samples were collected between the three sampler configurations and two flow rates. Of those samples, 36 were found to be below the LOD with 34 of those samples below the LOD occurring during the aerosolization of the MW2 material. Representative images from the three CNT/F materials collected within the VDT are displayed in and the averaged results obtained from each set of 15 experiments using the three sampler configurations at the flow rate of 2 Lpm are presented in . The results from Configuration 1, which compared the ungrounded 25-mm styrene OFC and button sampler, found no difference in the percent errors, based upon the 95% confidence intervals containing the null value of 0, between the samplers when challenged with MW2 and CNF1 aerosols with average percent errors of 54.7% and −10.9%, respectively. Configuration 2, which compared the ungrounded 25- and 37-mm OFCs, displayed no difference in percent errors between the samplers when challenged with ARD, MW1, MW2, and CNF1 materials with percent errors ranging from −23.9% to 13.4%. The results from Configuration 3, which compared the grounded 25-mm aluminum OFC and grounded button sampler, found no difference in the percent errors between the samplers for the experiments conducted using ARD and MW1 materials with percent errors of −4.4% and 5.8%, respectively.
Figure 1. TEM images from VDT dispersions of (a,b) MW1, (c,d) MW2, and (e,f) CNF1.
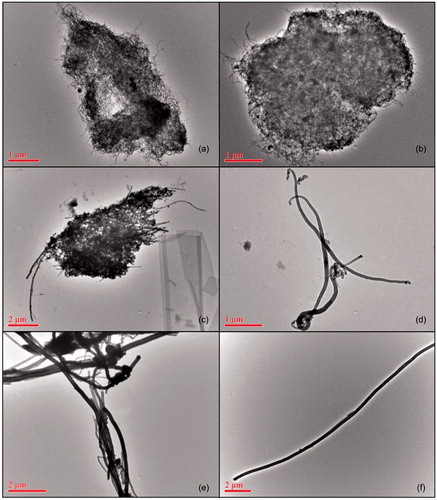
Table 1. Side-by-side sampler configuration comparisons of gravimetric mass collected from material tests at a flow rate of 2 Lpm.
The experimental results obtained from each sampler configuration at the flow rate of 5 Lpm are presented in . Sampler configuration 1 displayed no difference in the percent errors between the samplers from the experiments using MW1, MW2, and CNF1 with percent errors of −2.8%, 25.0%, and 12.2%, respectively. The tests carried out between the 25- and 37-mm OFCs (Configuration 2) demonstrated no difference between the samplers when challenged with the materials of ARD, MW1, and MW2 with percent errors of 5.2%, 14.0%, and −8.1%, respectively. The results from Configuration 3 revealed no difference in percent error between the samplers for ARD, MW1, and MW2 materials with errors of 12.1%, 13.6%, and 28.5%. The variance between the paired samples percent errors at both 2 and 5 Lpm are displayed in .
Figure 2. Box and whisker plot (minimum, first quartile, median, third quartile, maximum, and outliers) of the percent errors from the 15 paired samples at 2 and 5 Lpm for each of the four materials at all three configurations. X denotes the reported mean values.
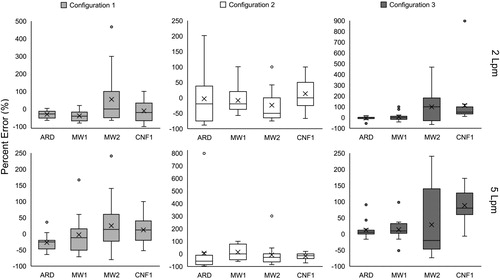
Table 2. Side-by-side sampler configuration comparisons of gravimetric mass collected from material tests at a flow rate of 5 Lpm.
The conditions for samplers in Configurations 1 and 3 were nearly identical, with the exception of the 25-mm OFC being made of aluminum instead of styrene and both samplers being electrostatically grounded in Configuration 3. Thus, reasonable comparisons can be made between these configurations. The percent errors between the experiments performed at 2 Lpm for the 25-mm OFC used in Configuration 1 and the grounded 25-mm aluminum OFC used in Configuration 3 ranged from −70.4% to 34.1% with an average of the absolute values of each percent error of 48.7%. The percent errors for this comparison at 5 Lpm ranged from −56.6% to 3.0% (average of the absolute values = 38.7%; Tables S1 and S2). The 25-mm styrene OFC under-sampled compared to the grounded 25-mm aluminum OFC in six of the eight experimental scenario at both flow rates based on the percent error. Meanwhile, the differences between the percent errors obtained with the ungrounded and grounded button samplers in Configurations 1 and 3 ranged from −30.1% to 99.2% (average of the absolute values = 41.2%) at 2 Lpm and −37.4% to 5.9% (average of the absolute values = 21.6%) at 5 Lpm. The ungrounded button sampler under-sampled compared to the grounded button sampler in six of the eight experimental scenarios at both flow rates based on the percent error.
Size distributions collected from the ELPI and APS when each CNT/F material was dispersed within the VDT are shown in . The APS displays log-normal distributions for each material while the ELPI measurements revealed bi- or tri-modal distributions, typically with at least one mode below 500 nm, which is beyond the measurement range of the APS. Count median (CMD) and mass median aerodynamic diameters (MMAD), as reported by the APS, are displayed in while CMD values for the ELPI were derived by creating cumulative distribution curves. The MMAD values were not derived for the ELPI due to the non-log-normal distributions displayed within the data set. Based upon the CMD data from the APS, the material with the largest particle aerodynamic diameter was MW1 (1.30 µm) followed by ARD (1.29 µm), MW2 (0.79 µm), and CNF1 (0.71 µm). The MMAD displayed a similar trend, although CNF1 had a larger MMAD compared to MW2. The data from the ELPI revealed that the ARD (1.35 µm) had the largest CMD while MW2 and CNF1 both had CMDs of 0.60 µm and MW1 had the smallest CMD at 0.03 µm.
Figure 3. Aerodynamic particle size distribution by number provided by the ELPI and APS for the different test materials: (a) ARD; (b) MW1; (c) MW2; (d) CNF1. The measurements were repeated in triplicate, with the averages being plotted.
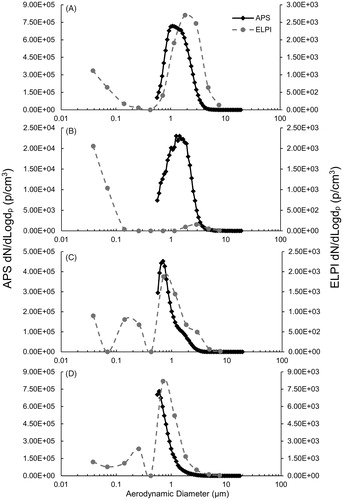
Table 3. Particle aerodynamic diameters of tested materials measured with the APS and ELPI.
Discussion
Historically, the “total” or inhalable aerosol fraction has been sampled in workplaces using relatively simple techniques such as the 25- and 37-mm OFC samplers, and since many studies used the same sampling techniques, the inaccuracies within sampling were the same or similar (Willeke and Baron Citation1990). However, several recent CNT/F exposure assessments and cross-sectional epidemiologic studies have used OFC samplers to estimate the inhalable aerosol size fraction while others have used alternative inhalable samplers. Therefore, it is important to understand how these OFC samplers perform when challenged with CNT/F aerosols compared to known samplers that follow the ISO/ACGIH/CEN inhalable sampling convention. The information gained by understanding the performance and sampling efficiency of the 25- and 37-mm OFCs when sampling CNT/F aerosols will allow for reasonable comparisons between exposure and cross-sectional epidemiologic studies that have used other inhalable samplers.
The assessment of the sampling efficiency of the 25-mm styrene OFC compared to the button sampler in Configuration 1 found that the 25-mm OFC performed comparably to the reference inhalable aerosol sampler when challenged with CNT/F aerosols, which was demonstrated in five of the six experimental scenarios using CNT/F at both flow rates. In the five experiments that demonstrated no difference in percent error between the samplers, the errors ranged from −10.9% to 54.7% with an average of the absolute values of 21%. The 25-mm OFC under-sampled the coarse ARD aerosols compared to the button sampler at both flow rates, but this was anticipated as OFCs are known to under sample particles >20 μm.
Additionally, the experiments comparing the 25- and 37-mm styrene OFCs found that they performed similarly when challenged with the various CNT/F aerosols. This was demonstrated for all four of the materials dispersed at 2 Lpm and three of the four materials at 5 Lpm. In the experiments that demonstrated no difference in the samplers, the percent error ranged from −23.9% to 14% with an average of the absolute values of 10.8%. Thus, it can be inferred that the 37-mm OFC would likely perform comparably to the reference inhalable aerosol sampler as well.
In Configuration 3, an aluminum 25-mm OFC was used alongside a button sampler, with each sampler grounded to reduce electrostatic losses. In this configuration, the 25-mm aluminum OFC was found to perform comparably to the button sampler in five of the eight experimental scenarios. In each instance where the percent errors between the samplers differed, the 25-mm aluminum OFC over-sampled the aerosol compared to the button sampler between 88.5% and 112.8%. In the cross-configuration comparison between the OFC samplers in Configurations 1 and 3, the 25-mm styrene OFC under-sampled compared to the grounded 25-mm aluminum OFC by an average of −53.6% and −50.6% for six of the eight experimental scenarios at the flow rates of 2 and 5 Lpm, respectively. Meanwhile, the ungrounded button sampler under-sampled compared to the grounded sampler in six of the eight scenarios by an average percent error of −21.8% and −26.8% at the flow rates of 2 and 5 Lpm, respectively. This indicates that electrostatic attraction may have affected both the ungrounded 25-mm styrene OFC and button sampler when challenged with CNT/F and ARD aerosols. However, it had a greater effect on the ungrounded 25-mm styrene OFC, likely due to an increased deposition of particles on internal surfaces of the OFC. However, it should be noted that as the VDT uses a more aggressive airflow to aerosolize the materials, increased particle-to-particle interactions might have amplified surface charges compared to typical workplace CNT/F aerosols and improved the potential for wall losses during sampling.
The material characteristics of the three CNT/F materials used as challenge aerosols in these experiments ranged from 10 to 100 nm in diameter and from <1 to 4 µm in length. It has been noted that the diameter and length characteristics of these materials may affect their ability to agglomerate, and in turn, alter a worker’s exposure potential (Murray et al. Citation2012; Knudsen et al. Citation2019; Dahm, Bertke, and Schubauer-Berigan Citation2019). It was anticipated from microscopy samples collected by Hedmer et al. (Citation2014), Kuijpers et al. (Citation2016), and Dahm et al. (Citation2018) that CNT/F materials would create a polydisperse aerosol ranging from the ultrafine size range to several micrometers in diameter for agglomerates. The size distribution measurements performed with the ELPI were found to be the most valuable, as smaller modes were captured below the 500 nm measurement capability of the APS. The aerosol with the smallest diameter (MW1) appeared to have a small mode around 3 µm but had significantly more particles below 100 nm, while MW2 and CNF1 each had modes around 1 µm with smaller modes around 200–250 nm. It should be noted that it is possible that modes <500 nm may be influenced by measurement artifacts; however, similar modes and diameters have been found for other CNT/F aerosols (Evans et al. Citation2010; Evans et al. Citation2013; Ku and Birch Citation2019).
Anecdotally, the larger diameter materials (MW2 & CNF1) did not appear to disperse well within the VDT, as large agglomerates could be seen entering the chamber and immediately settling. This affected the overall collection of these aerosols, especially for MW2, as nearly all of the samples collected below the LOD occurred during the collection of MW2 aerosols, which also partially explains the large variance observed in the confidence intervals for the percent errors of this material. The representative images in display larger agglomerated materials for MW1 comparable to MW2 and CNF1. However, few small agglomerates or single fibers were found <100 nm from the TEM images of MW1 indicating that potential wall losses may affect particles of smaller size, as expected. As these small agglomerates and single fibers would contribute minimally to the overall mass collected, they would have little effect for mass based OELs, but may have a greater effect for any microscopy-based number count OELs.
Overall, the results of this study indicate that data collected in previous investigations, which used the 25- and 37-mm OFC samplers to estimate the inhalable size fraction for CNT/F aerosols, likely followed the ISO/ACGIH/CEN inhalable convention with relative equivalency at both a lower (2 Lpm) and higher (5 Lpm) flow rate. This is important, as it has been recently reported from human studies that health effects and markers of early effect are better correlated with the inhalable aerosol size fraction of CNT/F compared to the respirable fraction (Beard et al. Citation2018; Schubauer-Berigan et al. Citation2018). However, several of the experimental configurations that were found to perform comparably to each other displayed large amounts of variance within their respective confidence intervals. This can be partially explained by the LOD issues observed during the sampling of the MW2 material as well as the fact that the CNT/F materials used in this study generated nonspherical polydisperse test aerosols, which are not ideal conditions for testing samplers (Vincent Citation2006), but represent realistic workplace exposure scenarios.
Although the OFC samplers and button samplers did perform with relative equivalence when challenged with the various CNT/F aerosols in this study, the button sampler did exhibit less variance between samples and demonstrated itself to be less affected by electrostatic forces. In addition, as the button sampler uses a 25-mm filter and operates at a relatively high flow rate of 4 Lpm, it is ideally suited to lower the LOD for CNT/F analysis methods, such as NMAM 5040 for elemental carbon (NIOSH Citation2013, Citation2016). Therefore, future exposure studies for CNT/F should preferably utilize any type of size selective sampler that reduces the sample-to-sample variance, limits any potential electrostatic effects, and provides an optimal LOD for analysis by utilizing a 25-mm filter and operating at a flow rate ≥4 Lpm.
Conclusion
The results of this study suggest that the 25- and 37-mm OFCs collect the inhalable aerosol size fraction when sampling CNT/F aerosols and performed within a range of 21% compared to a reference inhalable sampler. Past exposure and epidemiologic studies that used these OFC samplers to estimate the inhalable size fraction can directly compare their exposure results to studies that have used other validated inhalable aerosol samplers. Future exposure studies for CNT/F should preferably use a validated size selective inhalable sampler that utilizes a 25-mm filter and operates at a flow rate ≥4 Lpm to optimize the LOD for analysis methods such as NMAM 5040.
Disclaimer
The findings and conclusions in this report are those of the author(s) and do not necessarily represent the official position of the National Institute for Occupational Safety and Health (NIOSH), Centers for Disease Control and Prevention (CDC). Mention of any company name or product does not constitute endorsement by NIOSH/CDC.
Supplemental Material
Download MS Word (3.1 MB)Acknowledgment
The authors would like to thank Aaron Erdely for supplying the CNT/F materials and overseeing the TEM analysis of the bulk materials as well as M. Christina Kander and Greg Dye for assisting with data collection and sampling preparation.
Disclosure statement
No potential conflict of interest was reported by the authors.
Additional information
Funding
References
- Aizenberg, V., K. Choe, S. A. Grinshpun, K. Willeke, and P. A. Baron. 2001. Evaluation of personal aerosol samplers challenged with large particles. J. Aerosol Sci. 32 (6):779–793. doi:10.1016/S0021-8502(00)00119-1.
- Aizenberg, V., S. A. Grinshpun, K. Willeke, J. Smith, and P. A. Baron. 2000. Performance characteristics of the button personal inhalable aerosol sampler. Am. Ind. Hyg. Assoc. J. 61:398–404. doi:10.1080/15298660008984550.
- American Conference of Governmental Industrial Hygienists (ACGIH) 1999. Threshold limit values for chemical substances and physical agents and biological exposure indices. Cincinnati, OH: ACGIH, p. 85.
- Ashley, K., and M. Harper. 2013. Analytical performance issues closed-face filter cassette (CFC) sampling—Guidance on procedures for inclusion of material adhering to internal sampler surfaces. J. Occup. Environ. Hyg. 10 (3):D29–D33.
- Babik, K. R., M. M. Dahm, K. H. Dunn, K. L. Dunn, and M. K. Schubauer-Berigan. 2018. Characterizing workforces exposed to current and emerging non-carbonaceous nanomaterials in the U.S. J. Occup. Envrion. Hyg. 15 (1):44–56. doi:10.1080/15459624.2017.1376252.
- Baron, P. A., and G. J. Deye. 1990. Electrostatic effects in asbestos sampling I: experimental measurements. Am. Ind. Hyg. Assoc. J. 51 (2):51–62. doi:10.1080/15298669091369330.
- Bartley, D. L. 1998. Inhalable aerosol samplers. Appl. Occup. Environ. Hyg. 13:274–278. doi:10.1080/1047322X.1998.10390082.
- Bartley, D. L. 2001. Definition and assessment of sampling and analytical accuracy. Ann. Occup. Hyg. 45 (5):357–364.
- Beard, J. D., A. Erdely, M. M. Dahm, M. A. de Perio, M. E. Birch, D. E. Evans, J. E. Fernback, T. Eye, V. Kodali, R. R. Mercer, et al. 2018. Carbon nanotube and nanofiber exposure and blood and sputum biomarkers of early effect among U.S. workers. Environ. Int. 116:214–228. doi:10.1016/j.envint.2018.04.004.
- Birch, M. E., B. K. Ku, D. E. Evans, and T. A. Ruda-Eberenz. 2011. Exposure and emissions monitoring during carbon nanofiber production – part I: elemental carbon and iron-soot aerosols. Ann. Occup. Hyg. 55:1016–1036. doi:10.1093/annhyg/mer073.
- Bishop, L., L. Cena, M. Orandle, N. Yanamala, M. M. Dahm, M. E. Birch, D. E. Evans, V. K. Kodali, T. Eye, L. Battelli, et al. 2017. In vivo toxicity assessment of occupational components of the carbon nanotube life cycle to provide context to potential health effects. ACS Nano 11 (9):8849–8863. doi:10.1021/acsnano.7b03038.
- Boundy, M., D. Leith, and T. Polton. 2006. Method to evaluate the dustiness of pharmaceutical powders. Ann. Occup. Hyg. 50 (5):453–458. doi:10.1093/annhyg/mel004.
- Brouwer, D., M. Berges, M. A. Virji, W. Fransman, D. Bello, L. Hodson, S. Gabriel, and E. Tielemans. 2012. Harmonization of measurement strategies for exposure to manufactured nanoobjects; report of a workshop. Ann. Occup. Hyg. 56:1–9. doi:10.1093/annhyg/mer099.
- Comité Européen de Normalisation (CEN) 1993. Workplace atmospheres: size fraction definitions for measurements of airborne particles in the workplace (CEN standard EN 481). Brussels, Belgium.
- Dahm, M. M., M. K. Schubauer-Berigan, D. E. Evans, M. E. Birch, S. Bertke, J. D. Beard, A. Erdely, J. E. Fernback, R. R. Mercer, and S. A. Grinshpun. 2018. Exposure assessments for a cross-sectional epidemiologic study of US carbon nanotube and nanofiber workers. Int. J. Hyg. Environ. Health 221 (3):429–440. doi:10.1016/j.ijheh.2018.01.006.
- Dahm, M. M., S. Bertke, and M. K. Schubauer-Berigan. 2019. Predicting occupational exposures to carbon nanotubes and nanofibers based on workplace determinants modeling. Ann. Work Expo. Health 63 (2):158–172. doi:10.1093/annweh/wxy102.
- Dahm, M. M., D. E. Evans, M. K. Schubauer-Berigan, M. E. Birch, and J. E. Fernback. 2012. Occupational exposure assessment in carbon nanotube and nanofiber primary and secondary manufacturers. Ann. Occup. Hyg. 56:542–556. doi:10.1093/annhyg/mer110.
- Dahm, M. M., M. K. Schubauer-Berigan, D. E. Evans, M. E. Birch, J. E. Fernback, and J. A. Deddens. 2015. Carbon nanotube and nanofiber exposure assessments: an analysis of 14 site visits. Ann. Occup. Hyg. 59 (6):705–723. doi:10.1093/annhyg/mev020.
- Demange, M., P. Görner, J. M. Elcabache, and R. Wrobel. 2002. Field comparison of 37-mm closed-face cassettes and IOM samplers. Appl. Occup. Environ. Hyg. 17 (3):200–208. doi:10.1080/104732202753438289.
- Dubey, P., U. Ghia, and L. A. Turkevich. 2017. Computational fluid dynamics analysis of the venturi dustiness tester. Powder Technol. 312:310–320. doi:10.1016/j.powtec.2017.02.030.
- Eastlake, A. C., C. Beaucham, K. F. Martinez, M. M. Dahm, C. Sparks, L. L. Hodson, and C. L. Geraci. 2016. Refinement of the nanoparticle emission assessment technique into the nanomaterial exposure assessment technique (NEAT 2.0). J. Occup. Envrion. Hyg. 13 (9):708–717. doi:10.1080/15459624.2016.1167278.
- Ellenbecker, M., S. J. Tsai, M. Jacobs, M. Riediker, T. Peters, S. Liou, A. Avila, and S. FossHansen. 2018. The difficulties in establishing an occupational exposure limit for carbon nanotubes. J. Nanopart. Res. 20:131. https://doi.org/10.1007/s11051-018-4221-7
- Evans, D. E., L. A. Turkevich, C. T. Roettgers, and G. J. Deye. 2014. Comment on comparison of powder dustiness methods. Ann. Occup. Hyg. 58:524–528. doi:10.1093/annhyg/meu039.
- Evans, D. E., L. A. Turkevich, C. T. Roettgers, G. J. Deye, and P. A. Baron. 2013. Dustiness of fine and nanoscale powders. Ann. Occup. Hyg. 57 (2):261–277. doi:10.1093/annhyg/mes060.
- Evans, D. E., B. K. Ku, M. E. Birch, and K. H. Dunn. 2010. Aerosol monitoring during carbon nanofiber production: mobile direct-reading sampling. Ann. Occup. Hyg. 54:514–531. doi:10.1093/annhyg/meq015.
- Fatkhutdinova, L. M., T. O. Khaliullin, R. R. Zalyalov, A. G. Tkachev, M. E. Birch, and A. A. Shvedova. 2016a. Assessment of airborne multiwalled carbon nanotubes in a manufacturing environment. Nanotechnol. Russia 11 (1–2):110–116. doi:10.1134/S1995078016010055.
- Fatkhutdinova, L. M., T. O. Khaliullin, O. L. Vasil’yeva, R. R. Zalyalov, I. G. Mustafin, E. R. Kisin, M. E. Birch, N. Yanamala, and A. A. Shvedova. 2016b. Fibrosis biomarkers in workers exposed to MWCNTs. Toxicol. Appl. Pharmacol. 15:125–131. doi:10.1016/j.taap.2016.02.016.
- Han, J. H., E. J. Lee, J. H. Lee, K. P. So, Y. H. Lee, G. N. Bae, S. B. Lee, J. H. Ji, M. H. Cho, and I. J. Yu. 2008. Monitoring multiwalled carbon nanotube exposure in carbon nanotube research facility. Inhal. Toxicol. 20 (8):741–749. doi:10.1080/08958370801942238.
- Harper, M., and B. S. Muller. 2002. An evaluation of total and inhalable samplers for the collection of wood dust in three wood products industries. J. Environ. Monit. 4 (5):648–656.
- Hauck, B. C., S. A. Grinshpun, A. Reponen, T. Reponen, K. Willeke, and R. L. Bornschein. 1997. Field testing of new aerosol sampling method with a porous curved surface as inlet. Am. Ind. Hyg. Assoc. J. 58 (10):713–719. doi:10.1080/15428119791012351.
- Hedmer, M., C. Isaxon, P. T. Nilsson, L. Ludvigsson, M. E. Messing, J. Genberg, V. Skaug, M. Bohgard, H. Tinnerberg, and J. H. Pagels. 2014. Exposure and emission measurements during production, purification, and functionalization of arc-discharge-produced multiwalled carbon nanotubes. Ann. Occup. Hyg. 58:355–379.
- Hornung, R. W., and L. D. Reed. 1990. Estimation of average concentration in the presence of non-detectable values. Appl. Occup. Environ. Hyg. 5 (1):46–51. doi:10.1080/1047322X.1990.10389587.
- International Organization for Standardization (ISO) 1995. Air quality-particle size fraction definitions for health-related sampling (ISO standard 7708). Geneva, Switzerland.
- Kenny, L. C., R. J. Aitken, P. E. J. Baldwin, G. C. Beaumont, and A. D. Maynard. 1999. The sampling efficiency of personal inhalable aerosol samplers in low air movement environments. J. Aerosol Sci. 30 (5):627–638. doi:10.1016/S0021-8502(98)00752-6.
- Kenny, L. C., R. Aitken, C. Chalmers, J. F. Fabries, E. Gonzalez-Fernandez, H. Kromhout, G. Liden, D. Mark, G. Riediger, and V. Prodi. 1997. A collaborative European study of personal inhalable aerosol sampler performance. Ann. Occup. Hyg. 41 (2):135–153. doi:10.1016/S0003-4878(96)00034-8.
- Knudsen, K. B., T. Berthing, P. Jackson, S. S. Poulsen, A. Mortensen, N. R. Jacobsen, V. Skaug, J. Szarek, K. S. Hougaard, and H. Wolff. 2019. Physicochemical predictors of multi-walled carbon nanotube-induced pulmonary histopathology and toxicity one year after pulmonary deposition of 11 different multi-walled carbon nanotubes in mice. Basic Clin. Pharmacol. Toxicol. 124 (2):211–227. doi:10.1111/bcpt.13119
- Kobayashi, N., H. Izumi, and Y. Morimoto. 2017. Review of toxicity studies of carbon nanotubes. J. Occup. Health 59 (5):394–407. doi:10.1539/joh.17-0089-RA.
- Ku, B. K., and M. E. Birch. 2019. Aerosolization and characterization of carbon nanotube and nanofiber materials: relationship between aerosol properties and bulk density. J. Aerosol Sci. 127:38–48. doi:10.1016/j.jaerosci.2018.10.004.
- Kuijpers, E., C. Bekker, W. Fransman, D. Brouwer, P. Tromp, J. Vlaanderen, L. Godderis, P. Hoet, Q. Lan, D. Silverman, et al. 2016. Occupational exposure to multi-walled carbon nanotubes during commercial production synthesis and handling. Ann. Occup. Hyg. 60 (3):305–317. doi:10.1093/annhyg/mev082.
- Lee, J. S., Y. C. Choi, J. H. Shin, J. H. Lee, Y. Lee, S. Y. Park, J. E. Baek, J. D. Park, K. Ahn, and I. J. Yu. 2015. Health surveillance study of workers who manufacture multi-walled carbon nanotubes. Nanotoxicology 9 (6):802–811. doi:10.3109/17435390.2014.978404.
- Lee, J. H., E. K. Sohn, J. S. Ahn, K. Ahn, K. S. Kim, J. H. Lee, T. M. Lee, and I. J. Yu. 2013. Exposure assessment of workers in printed electronics workplace. Inhal. Toxicol. 25 (8):426–434. doi:10.3109/08958378.2013.800617.
- Lee, J. H., S.-B. Lee, G. N. Bae, K. S. Jeon, J. U. Yoon, J. H. Ji, J. H. Sung, B. G. Lee, J. H. Lee, J. S. Yang, et al. 2010. Exposure assessment of carbon nanotube manufacturing workplaces. Inhal. Toxicol. 22 (5):369–381. doi:10.3109/08958370903367359.
- Liden, G., and J. Surakka. 2009. A headset-mounted mini sampler for measuring exposure to welding aerosol in the breathing zone. Ann. Occup. Hyg. 53 (2):99–116. doi:10.1093/annhyg/mep001.
- L'Orange, C., K. Anderson, D. Sleeth, T. R. Anthony, and J. Volckens. 2016. A simple and disposable sampler for inhalable aerosol. Ann. Occup. Hyg. 60 (2):150–160. doi:10.1093/annhyg/mev065.
- Maynard, A. D., P. A. Baron, M. Foley, A. A. Shvedova, E. R. Kisin, and V. Castranova. 2004. Exposure to carbon nanotube material: aerosol release during the handling of unrefined single-walled carbon nanotube material. J. Toxicol. Environ. Health 67 (1):87–107. doi:10.1080/15287390490253688.
- Murray, A. R., E. R. Kisin, A. V. Tkach, N. Yanamala, R. Mercer, S. H. Young, B. Fadeel, V. E. Kagan, and A. A. Shvedova. 2012. Factoring-in agglomeration of carbon nanotubes and nanofibers for better prediction of their toxicity versus asbestos. Part. Fibre Toxicol. 9 (1):10. doi:10.1186/1743-8977-9-10.
- NIOSH 2013. Current intelligence bulletin 65: occupational exposure to carbon nanotubes and nanofibers. Cincinnati, OH: US Department of Health and Human Services, Centers for Disease Control, National Institute for Occupational safety and Health. DHHS (NIOSH). Publication Number 2013–145.
- NIOSH 2016. Manual of analytical methods. Method 5040 diesel particulate matter (as elemental carbon). In NIOSH method of analytical methods, ed. K. Ashley, P. F. O’Connor, 5th ed., Issue 2, 94–113. Cincinnati, OH: Department of Health and Human Services, Public Health Service, Centers for Disease Control and Prevention, National Institute for Occupational Safety and Health. DHHS (NIOSH).
- Ogura, I., H. Sakurai, K. Mizuno, and M. Gamo. 2011. Release potential of single-wall carbon nanotubes produced by super-growth method during manufacturing and handling. J. Nanopart. Res. 13 (3):1265–1280. doi:10.1007/s11051-010-0119-8.
- Ramachandran, G., M. Ostraat, D. E. Evans, M. M. Methner, P. O'Shaughnessy, J. D'Arcy, C. L. Geraci, E. Stevenson, A. Maynard, and K. Rickabaugh. 2011. A strategy for assessing workplace exposures to nanomaterials. J. Occup. Envrion. Hyg. 8 (11):673–685. doi:10.1080/15459624.2011.623223.
- Schubauer-Berigan, M. K., M. M. Dahm, A. Erdely, J. D. Beard, M. E. Birch, D. E. Evans, J. E. Fernback, R. R. Mercer, S. J. Bertke, T. Eye, et al. 2018. Association of pulmonary, cardiovascular, and hematologic metrics with carbon nanotube and nanofiber exposure among U.S. workers: a cross-sectional study. Part. Fibre Toxicol. 15:22.
- Schubauer-Berigan, M. K., M. M. Dahm, and M. S. Yencken. 2011. Engineered carbonaceous nanomaterials manufacturers in the United States: workforce size, characteristics, and feasibility of epidemiologic studies. J. Occup. Envrion. Med. 53:S62–S67. doi:10.1097/JOM.0b013e31821b1e2c.
- Shvedova, A. A., N. Yanamala, E. R. Kisin, T. O. Khailullin, M. E. Birch, and L. M. Fatkhutdinova. 2016. Integrated analysis of dysregulated ncRNA and mRNA expression profiles in humans exposed to carbon nanotubes. PLoS ONE 11 (3):e0150628. doi:10.1371/journal.pone.0150628.
- Vincent, J. H. 2006. Testing personal inhalable aerosol samplers: a suggested improved protocol based on new scientific knowledge. J. Environ. Monit. 8 (1):53–62. doi:10.1039/B509222A.
- Wang, Z. L., R. P. Gao, P. Poncharal, W. A. de Heer, Z. R. Dai, and Z. W. Pan. 2001. Mechanical and electrostatic properties of carbon nanotubes and nanowires. Mater. Sci. Eng. C. 16 (1–2):3–10. doi:10.1016/S0928-4931(01)00293-4.
- Willeke, K., and P. A. Baron. 1990. Sampling and interpretation errors in aerosol monitoring. Am. Ind. Hyg. Assoc. J. 51 (3):160–168. doi:10.1080/15298669091369484.