
Abstract
Nanoscale dimers have application in studies of aerosol physicochemical properties such as aerosol viscosity. These particle dimers can be synthesized using the dual tandem differential mobility analyzer (DTDMA) technique, wherein oppositely charged particle streams coagulate to form dimers that can be isolated using electrostatic filtration. Although some characterization of the technique has been published, a detailed thesis on the modes and theory of operation has remained outside the scope of prior work. Here, we present new experimental data characterizing the output DTDMA size distribution and the physical processes underlying its apparent modes. Key experimental limitations for both general applications and for viscosity measurements are identified and quantified in six distinct types of DTDMA experiments. The primary consideration is the production of an adequate number of dimers, which typically requires high mobility-selected number concentration in the range 25,000–100,000 cm−3. The requisite concentration threshold depends upon the rate of spontaneous monomer decharging, which arises predominately from interactions of the aerosol with ionizing radiation within the coagulation chamber and is instrument location dependent. Lead shielding of the coagulation chamber reduced the first-order decharging constant from ∼2.0 × 10⁻⁵ s−1 to ∼0.8 × 10⁻⁵ s−1 in our laboratory. Dimer production at monomer diameters less than 40 nm is hindered by low bipolar charging efficiency. Results from the characterization experiments shed light on design considerations for general applications and for characterization of viscous aerosol phase transitions.
Copyright © 2019 American Association for Aerosol Research
EDITOR:
1. Introduction
Dimerized particles can be used to probe particle phase state (Petters et al. Citation2019; Marsh et al. Citation2018; Rothfuss and Petters Citation2016; Zhang et al. Citation2015; Pajunoja et al. Citation2014; Power et al. Citation2013), assess aggregation kinetics (Maisels, Kruis, and Fissan Citation2002), measure surface tension (Bzdek et al. Citation2016b), investigate how physical properties and particle mechanics vary with morphology (Tandon et al. Citation2019; Bell et al. Citation2017; Bzdek et al. Citation2016a), initiate condensed phase reactions (Jacobs et al. Citation2017), and in synthesis of nanomaterials (Sigmund et al. Citation2014; Kennedy et al. Citation2003). In all such work, it is necessary to synthesize and isolate dimerized particles in a controlled manner. One approach for bulk nanoscale aerosol is the dual tandem differential mobility analyzer (DTDMA) method (Rothfuss and Petters Citation2016; Maisels et al. Citation2000). However, comprehensive characterization of DTDMA performance and limitations is currently not available.
The left panels of present a schematic of dimer particle synthesis with a DTDMA. The right panels in show sequential views of particle transmission through the DTDMA calculated with the Julia DMA Language (JDL) (Petters Citation2018). Coagulation is modeled based on Brownian coagulation theory including enhancement due to charge effects (Zebel Citation1958). Assumed differential mobility analyzer (DMA) and aerosol properties are listed in the supplementary information (SI) (Section S1). Two DMAs of opposite polarity classify particles by mobility (). These streams are assumed to be bidisperse, as some transmitted particles will be doubly charged and thus have a larger physical diameter for the same electrical mobility than singly charged particles of the nominal monomer diameter (Dmono). The particle streams merge and enter a coagulation chamber (). The merged stream then flows through an electrostatic filter, which removes all charged particles. Coagulated particles of opposite charge are charge-neutral and pass through. Monomer particles that spontaneously lose their charge also transmit. This neutral aerosol is charge equilibrated to a Boltzmann distribution using a bipolar ion source (generally referred to as a neutralizer, but in this case used to impart charge). The resulting mobility size distribution is measured using a third DMA operated in scanning mobility particle sizer (SMPS) mode (Wang and Flagan Citation1990).
Figure 1. Left: schematic steps used for dimer synthesis. The neutralizer imparts an equilibrium charge distribution. Right: dashed black line corresponds to a theoretical model of the size distribution (a) at the entrance of the coagulation chamber, (b) after exiting the electrostatic filter, and (c) the measured apparent size distribution with the particle counter after DMA3. Colored lines indicate various contributions to the signal described in the text. The number #1–#4 in panel (c) indicate four apparent modes in the total size distribution.
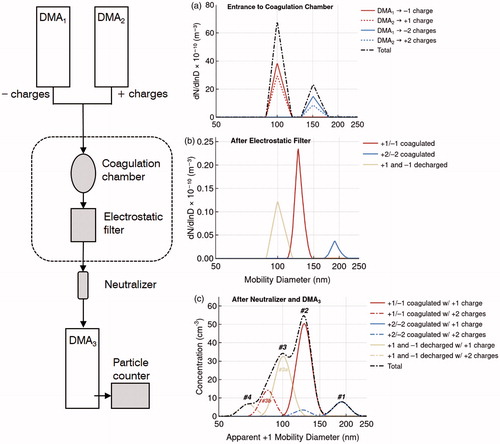
The resultant DTDMA size distribution, indicated by the black line in , contains four apparent modes. Note that the diameter axis is the apparent +1 diameter as defined in Petters (Citation2018). In this specific example, the contribution of the decharged particles to the total signal dominates Peak #3, and the +1/–1 dimer population dominates Peak #2. As Peak #2 is the primary dimer signal, its modal diameter (Dp) or magnitude is typically the quantity of analytical interest in DTDMA applications. In practice, both decharged particles (Peak #3a) and +2-charged dimer particles (Peak #3b) contribute to Peak #3, with the latter becoming more prominent as upstream number concentration (Nup) increases.
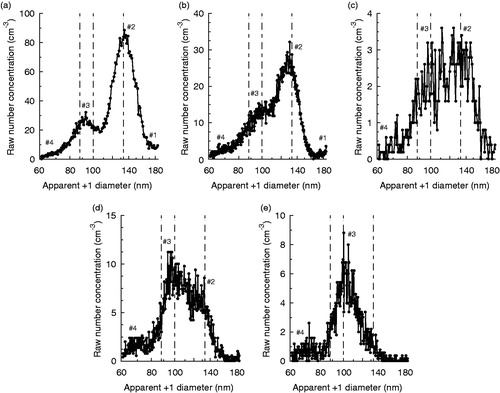
Considerable variation has been observed in the relative magnitudes of these modes. shows example data (experimental setup described later) for different mobility-selected number concentrations (N). At high concentrations (N ≈ 240,000 cm−3; ), Peak #2 is well resolved. For lower-but-still-high concentrations (N ≈ 150,000 cm−3; ), Peak #3 may resemble a shoulder more than a distinct peak. At smaller concentrations, Peak #2 and Peak #3 may be of similar magnitude and difficult to resolve (N ≈ 50,000 cm−3; ), Peak #3 may dominate (N ≈ 50,000 cm−3; ), or Peak #2 may be absent despite presence of Peak #3 (N ≈ 25,000 cm−3; ). In , Peak #3 is located near the monomer diameter, not the expected +2 dimer diameter as is the case in .
Figure 2. Example DTDMA electrical mobility size distributions showing different arrangements of peaks observed for Dmono = 100 nm. Apparent modes are labeled per the conventions in . Vertical lines are at 88 nm, 100 nm, and 133 nm, estimated locations for +2-charged dimers, +1-charged decharged monomers, and +1-charged dimers, respectively. Note that due to instrumental limitations, the selected mobility diameter scan range is such that the peak corresponding to dimers formed from monomers that were doubly charged during size selection is not resolved, so dimer in this context refers specifically to +1/−1 dimers. The signal for +2/−2 dimers (Peak #1) is typically small relative to that of +1/−1 dimers (e.g., Figure S1).
Published applications of DTDMA-style methods have been under favorable experimental conditions and did not require in-depth characterization of DTDMA particle streams and associated SMPS spectra (Petters et al. Citation2019; Tandon et al. Citation2019; Marsh et al. Citation2018; Rothfuss and Petters Citation2017; Maisels, Kruis, and Fissan Citation2002). The objective of this work is an improved understanding of the various factors influencing the DTDMA output size distribution, using modeling and some new experimental data. Such insights are necessary for optimization of future DTDMA experiments under less favorable conditions. Specifically, the signal arising due to spontaneous decharging of monomers is investigated using experiments. Lower bounds in monomer number concentration for practical application of this method are quantified. Finally, experimental parameters of specific interest to Dimer Coalescence, Isolation, and Coagulation (DCIC), a DTDMA variant used in study of particle phase (Rothfuss and Petters Citation2016) are also considered.
2. Methods
Aerosol precursors utilized in this work and their associated particle generation mechanisms are summarized in . Particles were generated via an oxidation flow reactor (OFR) with ozone chemistry only (Petters et al. Citation2019; henceforth OFR #1), an OFR with both OH and ozone chemistry (Reece, Sinha, and Grieshop Citation2017; henceforth OFR #2), an evaporation/condensation source (Tandon et al. Citation2019), or atomization of aqueous solution (Rothfuss and Petters Citation2016). Particle generation mechanisms were selected based upon convenience for generation of high Nup and not for specific chemical composition. Secondary organic aerosol (SOA) derived from α-pinene (via OFR #1) was used when the studied system is not otherwise mentioned.
Table 1. Summary of experimental aerosol systems and preparation methods.
2.1. Characterization experiments
The DTDMA system has been detailed extensively in prior work (Petters et al. Citation2019; Tandon et al. Citation2019; Marsh et al. Citation2018; Rothfuss and Petters Citation2016, Citation2017). Modifications for this work are discussed in the SI (Section S3). These include support for varying coagulator residence time (tcoag) (Figure S2) and the use of lead shielding (Figures S3 and S4) to reduce the influence of ionizing radiation on decharging. Experimental parameters not under direct study were normally selected as to optimize Peak #2 signal in the DTDMA system for our specific combination of DMAs.
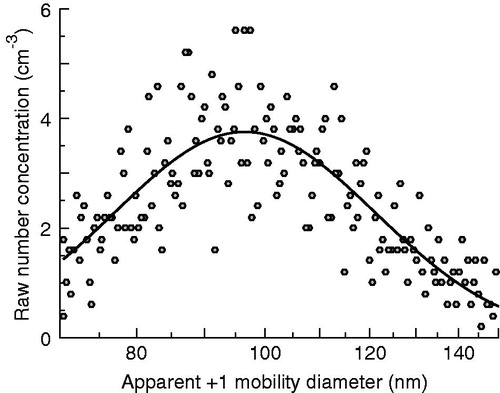
Experimental data is provided in the SI (Tables S1–S9). Many of the experiments involved quantifying the magnitude of an SMPS peak. In these experiments, the mean of the peak height of the raw response function (raw number concentration vs. apparent +1 mobility diameter as shown in ), each calculated as the height of a fitted lognormal mode corresponding to Peak #2 in , is reported. Unless specified otherwise, two-mode lognormal fits were performed, with the second mode corresponding to Peak #3, as data points associated with either Peak #1 or #4 were typically not prominent enough to skew fitting.
2.1.1. Decharge-TDMA (DeTDMA)
The system can produce monomers in a standard TDMA (Rader and McMurry Citation1986) mode by removing the voltage potential from one of the mobility-selecting DMAs. This will result in a single, like-charged monomer stream entering the chamber assembly, with the other DMA output acting strictly as a clean dilution flow. The TDMA configuration can be used with the electrostatic precipitator turned off, resulting in transmission of all monomers to the SMPS, typically for purpose of size verification. However, when the electrostatic precipitator is on, all charged particles are removed. This includes any like-charged particles that coagulate due to Brownian motion as well as charged monomers. Because the electrostatic precipitator removes charged particles with 100% efficiency (Rothfuss and Petters Citation2016), this specific configuration (henceforth decharge-TDMA or DeTDMA) will produce only monomers that have undergone a spontaneous loss of charge. In this work, measurement of these monomers was used to study the spontaneous decharging process. Peak heights were calculated via a one-mode lognormal fit to each collected spectrum. An example SMPS spectrum containing only a decharged peak is shown in . Note that because only one of the two mobility-selecting DMAs is transmitting particles, this peak has magnitude approximately half what would be expected for Peak #3a in a concomitant DTDMA spectrum.
Figure 3. Example DeTDMA spectrum for myrcene SOA (Dmono = 100 nm) as transmitted by the negative polarity mobility-selecting DMA at a 2:1 sheath-to-sample flow ratio. The solid curve is a fit of the data points to a one-mode lognormal equation. The decharged monomer contribution to a full DTDMA SMPS spectrum under these conditions will be approximately twice this magnitude.
2.1.2. Radiation sensitivity experiment
The sensitivity of monomer decharging to ionizing radiation was studied by recording DeTDMA scans for an experimental setup where a weak radiation source was positioned below a single 0.3 L coagulation chamber, as well as for the otherwise same system immediately prior to the placement of the source and immediately after its removal. A cesium-137 beta source (Spectrum Techniques, Oak Ridge, TN) with initial activity of 1.8 × 10⁵ Be (5 µC) and half-life of 30.2 years was utilized. Based upon its age of 14.8 years at the time of the experiment, an effective activity of 1.3 × 10⁵ Be was expected, assuming first-order decay kinetics. A photograph showing how the source was positioned relative to the coagulation chamber is presented in the SI as Figure S5.
2.1.3. Shielding experiment
The role of lead shielding was probed by measuring DeTDMA peak heights across a series of different possible brick configurations, including no shielding whatsoever, shielding only below the chamber, and shielding with various numbers of layers of bricks above the chamber.
2.1.4. Concentration experiments
Several experiments were performed to investigate the dependence of Peak #2 and #3 magnitude on number concentration. Peak #2 and #3 heights were calculated at eight concentrations between 50,000 cm−3 and 250,000 cm−3 using a shielded coagulator assembly and at five concentrations between 50,000 cm−3 and 250,000 cm−3 for an unshielded assembly. In the former trials, the effective coagulation time (teff) was 38 s and in the latter 66 s.
2.1.5. Residence time experiments
For experiments where residence time effects were explicitly probed, it was observed that measured N could vary depending upon the flow rate through the chamber assembly. This was an unexpected behavior given that the upstream DMA configurations were held constant. We believe this was because the mobility-selected streams were not necessarily well mixed prior to diversion to the monitoring CPC at low sample flows. In these experiments, one of the 0.3 L chambers was utilized as a mixing volume positioned immediately before the flow branched to the monitoring CPC and overflow. Note this provided an additional 6 s of possible coagulation time outside of the primary chamber assembly (i.e., teff = tcoag + 12), while reducing maximum tcoag to 120 s. Experiments studied the influence of teff on both Peak #2 in the DTDMA spectrum and on the peak in a DeTDMA spectrum (under both shielded and unshielded setups). In all such experiments, the mean height of the peak of interest was calculated at ∼6 teff between 24 s and 132 s.
2.1.6. Flow ratio experiments
Two experiments exploring the influence of sheath-to-sample flow ratio in the mobilty-selecting DMAs (henceforth flow ratio) on resolution of Peak #2 were performed. In the first experiment, N was allowed to vary with the flow ratio (i.e., Nup was held constant; henceforth floating N), while in the second experiment (henceforth “constant” N), N was maintained at approximately 100,000 cm−3 for all flow ratios. In both experiments, 8–11 DTDMA SMPS scans were collected at 4–5 flow ratios between 2:1 and 5:1. The influence of flow ratio on the resolution of these spectra was quantitatively assessed by calculating the standard deviation in the fitted modal diameters of Peak #2.
2.1.7. Probe monomers
In a probe monomer DCIC experiment, one monomer stream consists of a highly viscous species generated at high number concentration (the probe), while the other consists of a less viscous species (possibly) generated at much lower number concentration. An observed shift in apparent dimer mobility diameter occurs when the less viscous monomer is sufficiently relaxed that it flows over the probe particle. In previous work (Tandon et al. Citation2019; Rothfuss and Petters Citation2017), it has been observed that this transition occurs under similar environmental conditions as coalescence of homogeneous particles of the analyte. Two sets of DCIC experiments were performed to investigate minimum analyte number concentration for a resolvable mobility diameter shift in the presence of a high number concentration probe. In both sets of experiments, α-pinene SOA was utilized as the analyte monomer. In the first set of experiments, α-pinene SOA (N = 290,000 ± 10,000 cm−3) was also utilized as the probe, while in the second set PolyWax 850 (N = 170,000 ± 20,000 cm−3) was used.
2.1.8. DCIC size limitations
DCIC depends upon successful resolution of the uncoalesced (Duc) and coalesced (Dc) dimer mobility diameters. The delta between the two diameters typically shrinks with Dmono, suggesting that at some minimum value of Dmono the two morphologies become unresolvable. This minimum value was probed by using measured shifts between Duc and Dc. The experimental data were used to validate several related variations of a model calculating that same shift. In this model, Duc was derived from electrical mobilities for aspherical particles as calculated by the adjusted sphere (Dahneke Citation1973) parameterization of Gopalakrishnan, McMurry, and Hogan (Citation2015) and the nominal Dc was taken to equal the sphere equivalent diameter. This model was then used to investigate Dmono < 50 nm, where experimental data were unavailable. Predicted shifts were discussed in the context of typical fitting precision. This analysis primarily utilized data from published work (Petters et al. Citation2019; Tandon et al. Citation2019; Marsh et al. Citation2018; Rothfuss and Petters Citation2016, Citation2017). However, a series of new DCIC experiments using PolyWax 850, β-carophyllene SOA, limonene SOA, terpinolene SOA, ammonium sulfate, or sucrose were performed for this work using monomers of apparent diameters between 50 and 100 nm. Experiments at smaller Dmono were attempted, but proved unsuccessful due to insufficient signal in the SMPS.
2.2. Modeling
Modeling of DTDMA SMPS spectra was based upon the DTDMA response functions of the JDL, modified to use size-dependent coagulation coefficient values from Hinds (Citation1999). As the DTDMA functions are not rigorously validated in the source work (Petters Citation2018), the suitability of the JDL for this work was assessed. Measured DTDMA spectra for β-caryophyllene SOA were overlaid with model-predicted spectra for two distinct scans where parameters of the upstream size distribution were available from separate SMPS scans (Figure S6). In both simulations a decharging constant of 2 × 10⁻⁵ s−1 was assumed as this was consistent with observed results for these experiments. In the scan of Figure S6a, a dominant Peak #2 was present, characteristic of high mobility selected number concentration (N ≈ 120,000 cm−3), while in Figure S6b, Peak #2 and Peak #3 were of similar magnitudes, indicative of more marginal number concentration (N ≈ 30,000 cm−3). In both figures, the predicted magnitude of Peak #2 was within 20% of observed.
Figure S6 provides an initial validation of the model, assuming that a reasonable decharging constant can be inferred for the experimental setup and location. However, it is also necessary to verify that the JDL reasonably reproduces observed concentration- and time-dependent behavior of the DTDMA system. As such, model predictions were also compared to the results of the concentration- and time-dependence experiments mentioned in Section 2.1, using a shielded coagulator assembly. For these experiments, the number concentration, modal diameter (Dup) and geometric standard deviation (σup) of the upstream source distribution were unknown. In both cases Dup = 100 nm, and σup = 1.6 were assumed. When modeling concentration dependence, Nup was varied in order to produce different values of N. Nup was fixed as 2.1 × 106 cm−3 when modeling coagulation time dependence as this resulted in calculated N of ∼100,000 cm−3 transmitting through DMAs 1 and 2, mirroring actual experimental conditions.
Concentration dependence is probed in Figure S7a. The observed Peak #2 magnitudes increase quadratically with chamber concentration and there is a similar trend between experimental results and model prediction, although model predictions are larger, particularly at N > 200,000 cm−3. Time dependence is probed in Figure S7b. For teff less than 60 s, the relationship is linear, as predicted by theory, and is of similar slope as the model predictions. However, beyond 60 s, the observed dependence upon residence time is much weaker than the model would suggest. At these residence times, flow through the coagulation chamber was <0.6 L min−1 for the two-chamber setup utilized in this experiment. Alternatively, at the 38 s teff of Figure S7a, where good agreement was observed between model predictions and experimental results at different monomer number concentrations, flow was 1.4 L min−1. We do not believe wall losses within the coagulator assembly or diffusional losses within the DMAs significantly influence Peak #2 signal (SI Section S6). Therefore, we hypothesize that at low flow rates the two size-selected streams were not fully mixed due to a combination of the Coandă effect immediately downstream of the nominal stream mixing point and minimal turbulent mixing at these flow rates. Under these conditions, the pre-mixing volume (which was used in the setup of this experiment) was adequate to ensure that neither mobility-selected stream was preferentially redirected to the CPC monitoring N (thus eliminating the apparent dependence of that quantity upon chamber residence time), but not sufficient to ensure full mixing for coagulation purposes. Nonetheless, it cannot be ruled out that the JDL poorly predicts coagulation rates at long (> ∼60 s) coagulation times. Note that the JDL is essentially an Eulerian (point) framework. If transport through the coagulation chamber is better modeled using a Lagrangian (parcel) framework, a reduction in coagulation rate with time would be expected as monomer concentration decreases within the parcel. However, observed rates of decharging and coagulation are low enough that monomer concentration remains essentially constant within the parcel. Thus, it is unlikely that such a reduction in rate would be detectable in our setup. Regardless, the results of this section suggest that the JDL represents the time- and concentration-dependent behavior of DTDMA at coagulation times (teff < 60 s) utilized in our prior research, and is suitable for this work.
3. Results and discussion
3.1. Monomer decharging
Variations in DeTDMA peak magnitude due to the presence of a radiation source are shown in Figure S8. Application of the radiation source increased peak height by more than a factor of 100 relative to the background case. Note the activity of the source was only ∼1/1000th of that of a typical radiation source used in bipolar neutralizers, and that the source was placed on the outside of the steel chamber (Figure S5). DeTDMA peak height for various configurations of lead shielding for N = 110,000 ± 7,000 cm−3 are shown in . Lower peak heights were observed when shielding was present, even in the case where shielding was only below and to the sides of the coagulation chamber with no shielding above. The lowest peak heights were observed when at least one layer of shielding was present above the chamber; however multiple layers of lead shielding above the chamber did not provide significant additional benefit.
Figure 4. (a) Mean DeTDMA peak heights for 100 nm monomer α-pinene SOA where the coagulation chamber was protected by various amounts of lead brick shielding. In the partial shielding case, bricks were positioned below and to the side of the chamber, whereas in the full shielding cases 1 or more layers of bricks were positioned above the chamber in addition to those below and to the side. (b) Mean DeTDMA peak heights versus effective coagulation chamber residence time for 100 nm monomer α-pinene SOA under both shielded and unshielded coagulation chamber setups, along with associated linear regression lines and model-inferred trend lines. Open markers correspond to experimental data points that deviate from trend – a deviation attributed to flow irregularities at low sample flow/high coagulation time – and have been omitted from analysis.
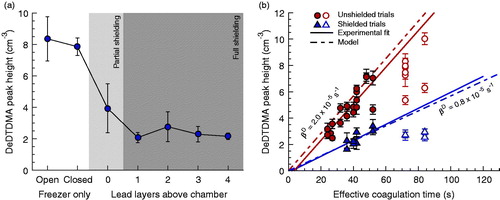
The influence of coagulation chamber residence time on decharging when N = 113,000 ± 8,000 cm−3 is shown in . DeTDMA peak heights are consistently lower for all trials where shielding was present than when the chamber assembly was left unshielded. Furthermore, the change in peak height with residence time, while still positively correlated, is of lesser slope than in the unshielded trials. Similar to the coagulated signal, the linear relationship breaks down at teff > 60 s, although the deviation appears to be less than in Figure S7b. Using the model, βD values of 2.0 × 10⁻⁵ s−1 and 0.8 × 10⁻⁵ s−1 were estimated for the unshielded and shielded experiments, respectively. The JDL assumes decharging has a linear dependence upon coagulation time, thus only data points in consistent with a linear trend were utilized in deriving these values. Note these coefficient values will be invalid at teff > ∼60 s if the deviations from theory observed in are not artifacts related to mixing limitations as we have assumed. suggests an approximately three-fold reduction in the decharging rate, larger than observed here. This implies decharging may vary with ambient environmental conditions in addition to experimental setup and location.
The above results demonstrate monomer decharging occurs within the DTDMA system to a detectable extent. The very high sensitivity to the radiation source in Figure S8 suggests recombination with ions produced via interactions between gas molecules and ambient ionizing radiation (of either atmospheric, ground, or building material source) is a major mechanism for this process. We believe these radiative interactions primarily occur within the chamber assembly, or at least downstream of the size-selecting DMAs. Ions will be present in the upstream sample flow (Hinds Citation1999), but will have much larger electrical mobilities (100–1000×) (Hirsikko et al. Citation2011) than particles of typical monomer diameters and it is expected these are filtered by the DMAs. The effects of lead shielding observed in are also consistent with most the gas-phase ion formation occurring within the coagulation chamber itself, as active shielding would have no impact on the recombination rates of ions already present in the particle stream. Furthermore, the trend lines in approximately extrapolate to 0 in the limit of teff = 0, as would be expected if decharging occurs predominately in parallel with coagulation. Possible decharging mechanisms other than interactions with ionizing radiation are briefly discussed in the SI (Section S5). These are not thought to be significant to the experiments presented in this work.
3.2. Interplay of mobility-selected concentration, residence time, and decharging
To optimize DTDMA output, Peak #2 should be most prominent. In the JDL model (Petters Citation2018), Peaks #2, #3a, and #3b scale linearly with teff. Accordingly, the ratios of these peak heights will remain constant with increased coagulation time. Similarly, the ratio of Peak #2 to Peak #3b will not change, assuming it arises entirely due to differences in equilibrium +1 and +2 charging efficiency in the final SMPS. However, the ratio of Peak #2 to Peak #3a will depend upon mobility-selected number concentration and environment-specific βD. Plots of experimental Peak #2/Peak #3 ratios and model-calculated Peak #2/Peak #3a ratios versus N for dimers constructed from 100 nm α-pinene monomers are shown in . The model ratios depict three different βD values: the shielded (0.8 × 10⁻⁵ s−1) and unshielded (2.0 × 10⁻⁵ s−1) values inferred from the data points of and a value one order of magnitude less than that of the unshielded constant. Note that even a one order of magnitude reduction in decharging rate from that of the unshielded case greatly increases the prominence of Peak #2 vs Peak #3a, even at concentrations <20,000 cm−3.
Figure 5. (a) Ratio of modeled DTDMA Peak #2 and Peak #3a as a function of N under various assumptions of βD for Dmono = 100 nm, assumed Dup = Dmono, assumed σup = 1.6, and a flow ratio of 3:1 (solid lines), along with measured experimental apparent Peak #2/Peak #3 ratios for α-pinene SOA. Dashed horizontal line corresponds to the expected Peak #2/Peak #3b ratio of 4.37 in the absence of decharging per the bipolar charging parameterization of Wiedensohler (Citation1988). (b) Ratios of modeled Peak #2 and Peak #3a magnitudes under two different assumptions of βD, along with the ratio of Peak #1 and Peak #2, all as functions of Dup, for Dmono = 100 nm and a flow ratio of 3:1. In both panels the shaded area corresponds to a Peak #2/Peak #3a ratio of less than 1.5, an estimate of the minimum necessary for resolution of Peak #2. In panel (b), the assumed upstream size distribution has lognormal parameters Nup = 2 × 106 cm−3 and σup = 1.6.
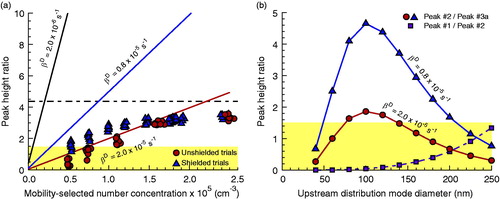
Beyond N = ∼50,000 cm−3 in the shielded case and ∼150,000 cm−3 in the unshielded case, significant deviation is observed between model predictions and observed experimental data. At lower concentrations, the fitted Peak #3 is dominated by the decharged contribution, and thus largely follows the linear trend line in the modeled ratio between Peak #2 and Peak #3a. At higher concentrations, however, the +2-charged dimers begin to dominate, and the trend becomes closer to constant. The theoretical Peak #2/Peak #3b ratio is not reached, however, (at least at these number concentrations) as decharged monomers remain a significant contribution to the fitted apparent Peak #3 height and make it appear larger than it would due to +2-charged dimers alone.
The strong dependence of the peak ratio upon number concentration apparent in has important implications for mobility-selection and upstream particle generation. The highest mobility-selected number concentration will occur when the selected monomer diameter is at or near the mode diameter of the upstream distribution. This is made apparent in . If decharging is high, Peak #2 may only be prominent versus Peak #3 over several tens of nanometers around the mode diameter of the upstream distribution. A broader range of diameters can be accessed with shielding. It is thus recommended that the mobility-selecting DMAs operate at the source mode diameter to the maximum practical extent. However, one benefit of bulk aerosol methodologies over single particle methods (which typically utilize micron-diameter droplets) is the potential for probing size-dependent behavior that only manifests on the nanoscale, such as has been reported for SOA composition (Tu and Johnston Citation2017) and hypothesized for SOA viscosity (Cheng et al. Citation2015). In such experiments, designing methodologies for tuning the upstream distribution may be as important or more important than the DTDMA implementation itself.
suggests a Peak #2 of suitable magnitude for curve fitting or other analytical purposes can be generated by increasing teff, provided N is sufficiently large for the cogulation rate to exceed the decharging rate (i.e., Peak #2/Peak #3a > ∼1.5). However, our results suggest there are engineering considerations at teff > ∼60 s. As Figure S7b depicts, the low flow rates required for arbitrarily long residence times may be associated with significant reductions in coagulation rate relative to predicted behavior. If incomplete mixing explains these deviations, it may be necessary to use static mixing pieces (Thakur et al. Citation2003), potentially at penalty of increased particle wall loss. In all setups, the residual flow required for the SMPS will put a volume-dependent upper limit on residence time. Accordingly, progressively larger residence times will require progressivley larger coagulation volumes, which may introduce their own flow and mixing issues not considered in this work.
As such, it is worth loosely quantifying necessary N for the coagulation setup used in this work, which is similar to the setup used in prior works, at intermediate residence times (i.e., ≤60 s), as such bounds are likely to be characteristic of those observed in future applications of the DTDMA method. suggests a threshold between 50,000 and 75,000 cm−3 for the shielded setups utilized in this work, with a threshold closer to 100,000 cm−3 in the absence of lead shielding.
These thresholds will vary from location to location, even for similar shielding setups, as inherent shielding power depends to some extent on the building itself (United Nations Scientific Committee on the Effects of Atomic Radiation Citation1993). For example, in a series of concurrent DCIC experiments using OFR #2, which is located in a different building in a different area of the NC State University campus, necessary number concentrations of 90,000 cm−3 were typical, or approximately 50% larger than the requisite value in the home laboratory, even with analagous lead shielding. The laboratory with OFR #2 is housed next to an experimental nuclear reactor (NC State University Department of Nuclear Engineering Citation2019) and a plasma physics lab. It was also on the ground floor of a single-story building wing, whereas the home laboratory is on the fourth floor of a six-story building. While the limited number of sites where the DTDMA method has been deployed to date makes it difficult to draw general conclusions about how laboratory location influences decharging, this single site comparison would (in the absence of more rigorous quantitative study) favor experimental locations well removed from laboratory sources of ionizing radiation and on a middle floor, where it is presumably somewhat insulated by the building structure from both ground and atmospheric sources.
One of the motivations for this work was a lack of success in achieving adequate dimer signal with environmental chamber SOA, due to insufficient number concentration. Increased coagulator residence time is unlikely to resolve these issues unless monomer decharging is virtually eliminated. At size-selected chamber-level upstream concentrations <20,000 cm−3 the decharging rate likely exceeds the coagulation rate. In fact, suggests that even at 50,000 cm−3 the decharging rate will be larger if shielding is poor. Experiments performed for this work (SI Figure S9 and Section S7) suggest that in DCIC applications it may be possible to reduce the minimum number concentration threshold to ∼25,000 cm−3 using probe monomers (Rothfuss and Petters Citation2017), provided a suitable probe can be generated in number concentrations of ∼250,000 cm−3.
The influence of varying flow ratio on Peak #2 signal is shown for experimental data in Figure S10a and using modeling for less ideal number concentrations in Figure S10b. Together, the results depicted in Figures S10a and b suggest the increased magnitude of the dimer signal from the high monomer number concentrations when the mobility-selecting DMAs are operated at a lower flow ratio is of greater benefit than the higher peak resolution associated with a higher flow ratio, particularly at flow ratios ≥2.5. More detailed discussion of these figures is provided in the SI (Section S8). By extension, these results suggest that other methods for improving peak resolution, such as use of higher resolution DMAs (e.g., Fernández de la Mora and Kozlowski Citation2013) will also have limited benefit.
For studies of morphological dependence of properties, it may be necessary only to demonstrate that dimers were synthesized. If one monomer has a significantly larger diameter than the other, the apparent mobility diameter will be similar to the larger monomer diameter. This occurs because the shape of the dimer will approach that of the larger monomer as the size discrepancy between the monomers increases. For example, for a larger monomer diameter of 100 nm, the expected Dc (as derived from the volume-equivalent sphere) is 104 nm for a smaller monomer of 50 nm, and 100 nm for a smaller monomer of 20 nm, versus 126 nm when the second monomer is also 100 nm in diameter. emphasizes that in some cases the decharged signal may be mistaken for an absent dimer signal. Thus, it is necessary to demonstrate that the Peak #2 signal is larger than the Peak #3 signal, as the two may overlap even when the dimer is uncoalesced and highly shaped. Normally, such characterization would be performed by comparing the peak height on the full SMPS spectra to the sum of the peak heights for the DeTDMA spectra produced by each of the size-selecting DMAs.
3.3. Other DTDMA spectral components
At monomer diameters larger than the source mode, the magnitude of Peak #1 is negligible relative to Peak #2. Accordingly, it cannot be used as a substitute for Peak #2 when the latter peak is unresolvable due to interference with a Peak #3 of similar magnitude. For systems where the source mode diameter is much larger than the size-selected diameter, Peak #1 will become more prominent. In the case of a size-selected diameter of 100 nm, Peak #1 will be larger in the resultant DTDMA spectrum () for an upstream mode of 250 nm. This is likely to only be of use in rare cases as a replacement for Peak #2, as such broad deviations between size-selected and upstream modal diameters are not expected to be typical, and when such conditions are present it is expected that Peak #2 will be small enough magnitude that even a larger Peak #1 is not useful. However, suggests it may be possible to use the two peaks to analyze two distinct monomer diameters simultaneously in scale dependence studies, particularly if upstream number concentration is large and upstream modal diameter is moderately larger than the mobility-selected diameter.
It is also worth briefly considering coagulation events between doubly and singly charged particles. When a + 2/−1 or a + 1/−2 dimer forms, there are two possible pathways relevant to the final SMPS spectrum: it is neutralized via a second coagulation event with another singly charged particle to form a trimer, or it is neutralized via spontaneous decharging analogous to that observed in singly charged monomers. At typical experimental diameters singly charged monomers dominate over doubly charged ones (Wiedensohler Citation1988). While the greater magnitude in opposite charge will provide some enhancement (Petters Citation2018; Zebel Citation1958), this argues it is unlikely that the combined number of +2/−1 and −2/+1 dimers formed is higher on an order-of-magnitude basis than the number of +1/−1 dimers formed, and the number of the latter produced in the coagulation chamber is approximately an upper bound on the production of the former. At relatively high monomer number concentrations (i.e., N > ∼100,000 cm−3), the number of +1/−1 dimers produced is on the order of 101–102 cm−3. Assuming coagulation rates on the order of 10−9 cm3 s−1, a typical value for monomer sizes utilized with DTDMA to date (Hinds Citation1999) and a decharging rate on the order of 10−5 s−1 (this work), a basic scale analysis argues this is not sufficient to produce detectable quantities of particles (∼10° cm−3 or greater) via either of the possible pathways described above at N ∼ 105 cm−3 and teff ∼ 101 s. At longer coagulation times, detectable quantities of trimers may be produced, but this will only be of concern when Peak #2 is already weak at shorter teff. A possible exception to the above is very small monomers (≤10 nm), where charge enhancement may increase the effective coagulation rate a full order of magnitude (Notebook S11 in the Supplement to Petters Citation2018; Zebel Citation1958), allowing production of detectable quantities trimers for teff values characteristic of prior research.
3.4. Considerations at small monomer diameter
The DTDMA method has been utilized to produce dimers from monomers as small as 50 nm (Tandon, Rothfuss, and Petters Citation2019). However, at smaller diameters adequate dimer signal has been difficult to achieve. This behavior was probed using the JDL, and the reduction in Peak #2 signal with Dmono is apparent in . This shows predicted Peak #2 height at different monomer diameters assuming an upstream distribution of Nup = 2 × 10⁶, 1.5 × 10⁶, or 1.2 × 106 cm−3, σup = 1.6, and Dup = Dmono. At Dmono typical of much previous work (80–100 nm), this would produce a strong, readily discernible Peak #2. However, at Dmono = 40 nm the signal is approximately 1/3 that for 100 nm monomers and at Dmono = 20 nm, the signal is almost lost. At lower upstream concentrations, peak height drops below 5 cm−3 at about 40 nm. Our SMPS system utilizes a CPC in single particle counting mode with an integration time of 1 s. Accordingly, a spurious count translates to a noise signal of 0.2 cm−3. Assuming a 10:1 signal-to-noise ratio is acceptable, this would argue that at minimum Peak #2 must have a recorded height of 2 cm−3. In practice, somewhat stronger signals (5–10 cm−3) have typically been required, particularly in the presence of decharging, so this can be considered as a lower bound. Even under this idealized case, this bound may only be achievable down to about Dmono = 30 nm at upstream concentrations less than 2 × 106 cm−3, per . In reality, the upstream distribution may have a mode diameter significantly larger than observed here. For example, α-pinene SOA from OFR #1 has a modal diameter over 100 nm (Petters et al. Citation2019). In these cases, fewer singly charged particles will be mobility-selected and achieving adequate signal may be exceptionally difficult at diameters much smaller than the 40–50 nm range where successful experiments have been performed previously.
Figure 6. (a) Model calculated height of the primary dimer peak at different monomer diameters assuming teff = 60 s, a flow ratio of 3:1, and an upstream lognormal distribution with Nup = 2 × 106 cm−3, 1.5 × 106 cm−3, or 1.2 × 106 cm−3; σup = 1.6; Dup = Dmono. Shaded area corresponds to peak heights less than 5 cm−3, a coarse estimate of minimum peak height for reliable peak fitting in prior work in the presence of moderate decharging. (b) Model calculated required Nup for a mobility-selected number concentration of 100,000 cm−3 at different mobility-selected diameters assuming an upstream lognormal distribution with σup = 1.6 and Dup = Dmono. In both panels, curves are fits of the plotted data to power equations of the form y = axb + c and are provided as guides to the eye only.
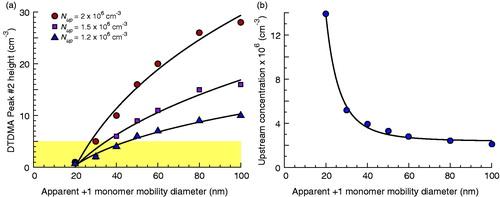
It is next worth considering where and how these losses are occurring. depicts the necessary Nup for a N of 100,000 cm−3 at a given Dmono, again assuming the monomer diameter is equal to the modal diameter of the source distribution. Beyond 60 nm, the requisite concentration has only weak sensitivity to monomer diameter and approaches 2 × 106 cm−3. At smaller diameters however, this sensitivity increases. At 40 nm, the requisite concentration is 2× that at 100 nm, and at 20 nm it is almost 7× larger than at 100 nm. As previously noted, we do not believe diffusional losses significantly influence Peak #2 signal. Thus, this modeling would suggest the reduced DTDMA signal at smaller monomer diameters is predominately due to decreased equilibrium charging efficiency upstream of mobility selection (Fuchs Citation1964). In our setup, bipolar diffusion chargers were utilized in the DMA inlets. However, the issue may be avoided using unipolar chargers (Hontañón and Kruis Citation2008; Qi, Chen, and Greenberg Citation2008; Marquard, Meyer, and Kasper Citation2007; Wiedensohler et al. Citation1994; Adachi, Romay, and Pui Citation1992; Pui, Fruin, and McMurry Citation1988), which achieve much high charging efficiencies for sub-40 nm particles.
In DCIC experiments it is necessary to resolve different mobility diameters associated with different degrees of coalescence. In prior work (Rothfuss and Petters Citation2016) we have approximated Duc as Dc scaled by the dynamic shape factor (χ) (1.1 for doublets of spheres per Scheuch and Heyder Citation1990). At 20 nm particles are approaching free molecular mechanics. Calculations by DeCarlo et al. (Citation2004) suggest a modest increase in shape factors between the continuum regime and free molecular regime for χ < ∼1.3, however, values for chains of spheres (the morphology most relevant to DCIC) were nearly identical between the two regimes.
Modeled predictions for the difference between Duc and Dc as a function of Dmono are shown in Fig. S11a. These model predictions are overlaid with actual observed shifts between fitted Duc and Dc, from literature (Petters et al. Citation2019; Marsh et al. Citation2018; Rothfuss and Petters Citation2016, Citation2017) and new data from this work (Table S9). The data show a significant spread in the difference between Duc and Dc for the same Dmono. Over monomer diameters between 0 and 100 nm, all models are approximately linear and predict diameter shift magnitudes as such: rod geometry model > (Duc = 1.1 Dc model) ≈ doublet of spheres geometry model > prolate spheroid geometry model. Experimental data points typically fall between the doublet of spheres geometry and prolate spheroid geometry-based predictions, except for 100 nm monomers, where a broader range of shifts have been observed. All data points fit within the expected uncertainty of the model assuming a doublet of spheres geometry. These models suggest an expected shift of 4 nm or less with 40 nm monomers, and of 2 nm or less with 20 nm monomers. The relative electrical mobility shift defined as the ratio of the electrical mobility of the uncoalesced dimer to the electrical mobility of the coalesced dimer is approximately independent of particle size (Figure S11b). This implies that the associated shape factor can be resolved at all diameters, provided that sufficient number concentration can be produced through unipolar chargers.
4. Conclusions
This work presents a set of experimental characterizations probing the limits of the dual tandem DMA method (DTDMA) method. Dimer production via the DTDMA method can be reasonably represented by a simple model (Petters Citation2018). Thresholds for successful application of the DTDMA method were derived from experimental data and modeling of the instrument. Some of the thresholds quoted below here may be improved upon with updated instrumentation, but the general capabilities and limitations will apply in all settings.
It is shown that monomers that have undergone spontaneous loss of charge, and thus are transmitted through the electrostatic filter, are a significant contribution to SMPS spectra of DTDMA system output and can interfere with resolution of the dimer SMPS peak (+1/−1 coagulated). This decharging arises predominately due to recombination with ions formed via interactions between gas molecules and ionizing radiation within the coagulation chamber assembly. Decharging rates vary with experimental setup and laboratory-specific environmental factors. Use of lead shielding around the coagulation chamber reduced the decharging rate by approximately 60% in our home laboratory.
The resolution of the +1/−1 coagulated peak depends strongly upon mobility-selected number concentration and decharging rate. Monodisperse number concentrations of 50,000 cm−3 to 100,000 cm−3 are typically required for a resolvable dimer signal in a DTDMA spectrum, depending upon the decharge rate. For the specific application of measuring viscous phase transitions, this may reduce to ∼25,000 cm−3 using the probe monomer approach of Rothfuss and Petters (Citation2017) for probe number concentrations > ∼200,000 cm−3. Reduction or elimination of decharging should be an objective for design of future DTDMA-derivative systems.
Several avenues for optimization of the dimer signal were explored. Increasing the time for coagulation will increase dimer production, but does not compensate for signal interference due to decharging as both particle populations scale linearly with time. Increasing the sheath-to-sample flow ratio will simultaneously increase peak resolution and decrease particle number concentration. The higher number concentration associated with smaller sheath-to-sample flow ratios is typically of greater utility than the improved resolution. The DTDMA method has been successfully used with monomer diameters as small as 50 nm. Reduced charging efficiency with bipolar diffusion chargers makes production of adequate number of dimers difficult for monomer diameters ≤ ∼40 nm. Unipolar charging mechanisms may be required at small diameter.
Application of the DTDMA method to study viscous phase transition requires precise characterization of the modal diameter of the +1/−1 dimer signal. At typical fitting precision, the modal diameters of the coalesced and uncoalesced state must be >2–3 nm apart in mobility diameter in order to distinctly resolve the transition of dimer morphologies. Extrapolation of observed diameter shifts to smaller diameters using a two-parameter, adjusted sphere-based model suggests this will be challenging for monomer diameters less than 20 nm.
Supplemental Material
Download PDF (1.8 MB)Acknowledgements
We thank Darrel Baumgardner for use of the radial DMA and Aditya Sinha for assistance with the operation of OFR #2. We thank NC State University, Office of Environmental Health and Safety, Radiation Safety Division for providing the lead bricks and Cs-137 radiation source.
Additional information
Funding
Related Research Data
References
- Adachi, M., F. J. Romay, and D. Y. H. Pui. 1992. High-efficiency unipolar aerosol charger using a radioactive alpha source. J. Aerosol Sci. 23 (2):123–37. doi: 10.1016/0021-8502(92)90049-2.
- Bell, D. M., D. Imre, S. T. Martin, and A. Zelenyuk. 2017. The properties and behavior of α-pinene secondary organic aerosol particles exposed to ammonia under dry conditions. Phys. Chem. Chem. Phys. 19 (9):6497–507.
- Bzdek, B. R., L. Collard, J. E. Sprittles, A. J. Hudson, and J. P. Reid. 2016a. Dynamic measurements and simulations of airborne picolitre-droplet coalescence in holographic optical tweezers. J. Chem. Phys. 145 (5):054502. doi: 10.1063/1.4959901.
- Bzdek, B. R., R. M. Power, S. H. Simpson, J. P. Reid, and C. P. Royall. 2016b. Precise, contactless measurements of the surface tension of picolitre aerosol droplets. Chem. Sci. 7 (1):274–85. doi: 10.1039/C5SC03184B.
- Cheng, Y., H. Su, T. Koop, E. Mikhailov, and U. Pöschl. 2015. Size dependence of phase transitions in aerosol nanoparticles. Nat. Commun. 6:5923. doi: 10.1038/ncomms6923.
- Dahneke, B. E. 1973. Slip correction factors for nonspherical bodies-III the form of the general law. J. Aerosol Sci. 4 (2):163–70. doi: 10.1016/0021-8502(73)90067-0.
- DeCarlo, P. F., J. G. Slowik, D. R. Worsnop, P. Davidovits, and J. L. Jimenez. 2004. Particle morphology and density characterization by combined mobility and aerodynamic diameter measurements. Part 1: Theory. Aerosol Sci. Technol. 38 (12):1185–205. doi: 10.1080/02786826.2004.10399461.
- Fernández de la Mora, J., and J. Kozlowski. 2013. Hand-held differential mobility analyzers of high resolution for 1-30 nm particles: Design and fabrication considerations. J. Aerosol Sci. 57:45–53. doi: 10.1016/j.jaerosci.2012.10.009.
- Fuchs, N. A. 1964. The mechanics of aerosols. Oxford: Pergamon Press.
- Gopalakrishnan, R., P. H. McMurry, and C. J. Hogan. 2015. The bipolar diffusion charging of nanoparticles: A review and development of approaches for non-spherical particles. Aerosol Sci. Technol. 49 (12):1181–94. doi: 10.1080/02786826.2015.1109053.
- Hinds, W. C. 1999. Aerosol technology: Properties, behavior, and measurement of airborne particles. 2nd ed. New York: John Wiley & Sons, Inc.
- Hirsikko, A., T. Nieminen, S. Gagné, K. Lehtipalo, H. E. Manninen, M. Ehn, U. Hõrrak, V.-M. Kerminen, L. Laakso, P. H. McMurry, et al. 2011. Atmospheric ions and nucleation: A review of observations. Atmos. Chem. Phys. 11 (2):767–98. doi: 10.5194/acp-11-767-2011.
- Hontañón, E., and F. E. Kruis. 2008. Single charging of nanoparticles by UV photoionization at high flow rates. Aerosol Sci. Technol. 42 (4):310–23. doi: 10.1080/02786820802054244.
- Jacobs, M. I., J. F. Davies, L. Lee, R. D. Davis, F. Houle, and K. R. Wilson. 2017. Exploring chemistry in microcompartments using guided droplet collisions in a branched quadrupole trap coupled to a single droplet, paper spray mass spectrometer. Anal. Chem. 89 (22):12511–9. doi: 10.1021/acs.analchem.7b03704.
- Kennedy, M. K., F. E. Kruis, H. Fissan, B. R. Mehta, S. Stappert, and G. Dumpich. 2003. Tailored nanoparticle films from monosized tin oxide nanocrystals: Particle synthesis, film formation, and size-dependent gas-sensing properties. J. Appl. Phys. 93 (1):551–60. doi: 10.1063/1.1525855.
- Maisels, A., F. E. Kruis, and H. Fissan. 2002. Determination of coagulation coefficients and aggregation kinetics for charged aerosols. J. Colloid Interface Sci. 255 (2):332–40. doi: 10.1006/jcis.2002.8657.
- Maisels, A., F. E. Kruis, H. Fissan, B. Rellinghaus, and H. Zähres. 2000. Synthesis of tailored composite nanoparticles in the gas phase. Appl. Phys. Lett. 77 (26):4431–3. doi: 10.1063/1.1335843.
- Marquard, A., J. Meyer, and G. Kasper. 2007. Unipolar field and diffusion charging in the transition regime—part II: Charging experiments. Aerosol Sci. Technol. 41 (6):611–23. doi: 10.1080/02786820701272061.
- Marsh, A., S. S. Petters, N. E. Rothfuss, G. Rovelli, Y. C. Song, J. P. Reid, and M. D. Petters. 2018. Amorphous phase state diagrams and viscosity of ternary aqueous organic/organic and inorganic/organic mixtures. Phys. Chem. Chem. Phys. 20 (22):15086–97. doi: 10.1039/C8CP00760H.
- NC State University Department of Nuclear Engineering. 2019. PULSTAR reactor. Accessed January 20, 2019. https://www.ne.ncsu.edu/nrp/about/pulstar-reactor/.
- Pajunoja, A., J. Malila, L. Hao, J. Joutsensaari, K. E. J. Lehtinen, and A. Virtanen. 2014. Estimating the viscosity range of SOA particles based on their coalescence time. Aerosol Sci. Technol. 48 (2):1–4. doi: 10.1080/02786826.2013.870325.
- Petters, M. D. 2018. A language to simplify computation of differential mobility analyzer response functions. Aerosol Sci. Technol. 52 (12):1437–51. doi: 10.1080/02786826.2018.1530724.
- Petters, S. S., S. M. Kreidenweis, A. P. Grieshop, P. J. Ziemann, and M. D. Petters. 2019. Temperature- and humidity-dependent phase state of secondary organic aerosols. Geophys. Res. Lett. 46 (2):1005–13. doi: 10.1029/2018GL080563.
- Power, R. M., S. H. Simpson, J. P. Reid, and A. J. Hudson. 2013. The transition from liquid to solid-like behaviour in ultrahigh viscosity aerosol particles. Chem. Sci. 4 (6):2597–604. doi: 10.1039/c3sc50682g.
- Pui, D. Y. H., S. Fruin, and P. H. McMurry. 1988. Unipolar diffusion charging of ultrafine aerosols. Aerosol Sci. Technol. 8 (2):173–87. doi: 10.1080/02786828808959180.
- Qi, C., D.-R. Chen, and P. Greenberg. 2008. Performance study of a unipolar aerosol mini-charger for a personal nanoparticle sizer. J. Aerosol Sci. 39 (5):450–9.
- Rader, D. J., and P. H. McMurry. 1986. Application of the tandem differential mobility analyzer to studies of droplet growth or evaporation. J. Aerosol Sci. 17 (5):771–87. doi: 10.1016/0021-8502(86)90031-5.
- Reece, S. M., A. Sinha, and A. P. Grieshop. 2017. Primary and photochemically aged aerosol emissions from biomass cookstoves: Chemical and physical characterization. Environ. Sci. Technol. 51 (16):9379–90. doi: 10.1021/acs.est.7b01881.
- Rothfuss, N. E., and M. D. Petters. 2017. Characterization of the temperature and humidity-dependent phase diagram of amorphous nanoscale organic aerosols. Phys. Chem. Chem. Phys. 19 (9):6532–45. doi: 10.1039/C6CP08593H.
- Rothfuss, N. E., and M. D. Petters. 2016. Coalescence-based assessment of aerosol phase state using dimers prepared through a dual-differential mobility analyzer technique. Aerosol Sci. Technol. 50 (12):1294–305. doi: 10.1080/02786826.2016.1221050.
- Scheuch, G., and J. Heyder. 1990. Dynamic shape factor of nonspherical aerosol particles in the diffusion regime. Aerosol Sci. Technol. 12 (2):270–77. doi: 10.1080/02786829008959345.
- Sigmund, S., M. Yu, J. Meyer, and G. Kasper. 2014. An aerosol-based process for electrostatic coating of particle surfaces with nanoparticles. Aerosol Sci. Technol. 48 (2):142–9. doi: 10.1080/02786826.2013.863422.
- Tandon, A., N. E. Rothfuss, and M. D. Petters. 2019. The effect of hydrophobic glassy material on the cloud condensation nuclei activity of internally mixed particles with dififerent particle morphologies. Atmos. Chem. Phys. 19 (5):3325–39.
- Thakur, R. K., C. Vial, K. D. P. Nigam, E. B. Nauman, and G. Djelveh. 2003. Static mixers in process industries—A review. Chem. Eng. Res. Des. 81 (7):787–826. doi: 10.1205/026387603322302968.
- Tu, P., and M. V. Johnston. 2017. Particle size dependence of biogenic secondary organic aerosol molecular composition. Atmos. Chem. Phys. 17 (12):7593–603. doi: 10.5194/acp-17-7593-2017.
- United Nations Scientific Committee on the Effects of Atomic Radiation. 1993. Sources and effects of ionizing radiation: Report to the general assembly with scientific annexes. New York: United Nations. https://www.unscear.org/docs/publications/1993/UNSCEAR_1993_Report.pdf
- Wang, S. C., and R. C. Flagan. 1990. Scanning electrical mobility spectrometer. Aerosol Sci. Technol. 13 (2):230–40. doi: 10.1080/02786829008959441.
- Wiedensohler, A. 1988. An approximation of the bipolar charge distribution for particles in the submicron range. J. Aerosol Sci. 19 (3):387–9. doi: 10.1016/0021-8502(88)90278-9.
- Wiedensohler, A., P. Büscher, H. C. Hansson, B. G. Martinsson, F. Stratmann, G. Ferron, and B. Busch. 1994. A novel unipolar charger for ultrafine aerosol particles with minimal particle losses. J. Aerosol Sci. 25 (4):639–49.
- Zebel, G. 1958. Zur theorie des verhaltens elektrisch geladener aerosole. Kolloid-Zeitschrift 157 (1):37–50. doi: 10.1007/BF01734032.
- Zhang, Y., M. S. Sanchez, C. Douet, Y. Wang, A. P. Bateman, Z. Gong, M. Kuwata, L. Renbaum-Wolff, B. B. Sato, P. F. Liu, et al. 2015. Changing shapes and implied viscosities of suspended submicron particles. Atmos. Chem. Phys. 15 (14):7819–29. doi: 10.5194/acp-15-7819-2015.