
 ?Mathematical formulae have been encoded as MathML and are displayed in this HTML version using MathJax in order to improve their display. Uncheck the box to turn MathJax off. This feature requires Javascript. Click on a formula to zoom.
Abstract
The particle mass measurement instrument of the aerosol particle mass analyzer (APM) tends to underestimate the particle mass of sub-50 nm nanoparticles, limiting the APM mass measurement to larger particles. In the present work, a mass correction method was developed based on a calibration reference to correct the APM mass underestimation according to a measured mass-based dimensionless parameter The correction was tested using laboratory generated silver nanoparticles and ambient nanoparticles. It was found that the measured effective density variations of silver nanoparticles due to different extent of APM mass underestimation at different operating conditions were reduced by the correction method with a significant improvement of R-squared from 0.40 to 0.87. In addition, about 20% increase in the effective density from 0.91 to 1.09 g/cm3 was observed for 30 nm ambient wet nanoparticles using the correction method. The difference between the raw and corrected effective densities is due to the mass underestimation by the APM itself, which should be corrected in the data analysis program of the APM.
Copyright © 2019 American Association for Aerosol Research
EDITOR:
1. Introduction
The tandem differential mobility analyzer (DMA) and aerosol particle mass analyzer (APM) provides a mobility size specific with good time resolution (a few minutes), and direct particle mass measurement for submicron particles, from which the effective density can be obtained for further characterizations (Ehara, Hagwood, and Coakley Citation1996; McMurry et al. Citation2002; DeCarlo et al. Citation2004; Tajima et al. Citation2011; Citation2013; Hsiao et al. Citation2018; Liao, Tseng, and Tsai Citation2018). With proper data reduction and integration, the size, mass, and effective density of the particles can be fully resolved by a single DMA-APM measurement (Rawat et al. Citation2016; Buckley et al. Citation2017). Similar particle mass classifying instruments such as the Couette centrifugal particle mass analyzer (CPMA) and nano-particle mass classifier (Nano-PMC) could be utilized in the similar manner (Olfert and Collings Citation2005; Broßell et al. Citation2015).
The accuracy of the DMA-APM system depends on both the DMA and the APM. It was reported that the APM would underestimate the particle mass for particles smaller than 50 nm, which limits the application of the mass measurement to larger particles (Tajima et al. Citation2011; Citation2013; Lin et al. Citation2014). The extent of mass underestimation issue was found to depend on both particle diffusion and the strength of the classification force in our previous work (Liao, Tseng, and Tsai Citation2018). The extent was quantified by a dimensionless parameter as:
(1)
(1)
where
is the relaxation time of the particles (s),
is the particle mass (kg), B is the particle mobility (m·N−1·s−1),
is the rotational speed of the APM (rad·s−1), r2 and r1 are the outer and inner radius of the APM classifying region (m), respectively, and D is the diffusion coefficient of the particles (m2·s−1). Higher
indicates less mass underestimation while lower
suggests more dominant particle diffusion on the particle mass classification and resulting in more serious mass underestimation. For the calibration of the APM with spherical test particles, the
can be approximated by the predicted particle mass (
) as:
(2)
(2)
where
(3)
(3)
is calculated with the effective density (
) and electrical mobility diameter (
), which are the same as the particle density (
) and particle diameter (dp), respectively, for spherical particles.
is the relaxation time of the particles calculated based on
and the particle mobility (
), and
is the particle diffusion coefficient (m2·s−1) calculated as
where k is Boltzmann’s constant (
kg·m2·s−2K−1) and T is the absolute temperature of the aerosol flow (K) (Hinds Citation1999). The APM underestimation was quantified by comparing the measured mass (
) to the predicted mass at different
It is worth to note that the quantitative evaluation of the APM mass underestimation is developed for the calibration, but it cannot be applied to routine mass measurement when
is unknown and cannot be approximated by
because both particle mass and density are unknown. Even after the mass measurement, the measured mass could be significantly lower than the particle mass due to the APM mass underestimation, and using the measured mass to estimate
denoted as
may lead to an error in the evaluation. The error has to be checked to find out whether
can be applied to routine mass measurement scenarios, such as ambient nanoparticles with unknown mass or density.
In the present work, the dataset of size standard nanoparticles reported in Liao, Tseng, and Tsai (Citation2018) were re-analyzed to construct a calibration reference, and a mass correction method for routine mass measurement was developed based on the reference. The correction method was tested with the mass measurement of sub-50 nm laboratory generated nanoparticles and ambient nanoparticles.
2. Method
2.1. Calibration reference
The mass measurement data of sub-50 nm size standard particles (29 and 48 nm PSL, JSR Life Science Corp.; 24 and 30 nm NanoSilica, MSP Corp.) reported in our previous work (Liao, Tseng, and Tsai Citation2018) were re-analyzed to build up a calibration curve to quantify the APM accuracy. These size standard particles were assumed to be perfect spherical in the calculation of the particle mass which may contribute to some errors in the analysis of the APM measured mass. The size standard particles larger than 50 nm were not used in the present work since the APM mass underestimation is insignificant for this size range. The details of the particle generation, measurement, and analysis are provided in Liao, Tseng, and Tsai (Citation2018). Although, the residue effect on the size standard nanoparticles due to the impurity in the atomization liquid has been discussed in our previous work, the effect was not taken into account in the data regression. Besides, to include more data points, the data of PSL and Nanosilica were combined into one regression curve in the present work.
The impurity in the atomization liquid leaves a residue layer on the size standard particles as the atomized droplet dried out which changes both the size and mass of the particles, leading to an uncertainty in To take into account the residue effect, the predicted mass of the particles was calculated with the particle density with considering the residue as:
(4)
(4)
(5)
(5)
where
is the particle density of the size standard particle with the residue on the particle, which was estimated by the nominal density of the size standard particles (
) provided by the manufacturers of the size standards and the density of the residue (
) which was assumed to be 1.67 g/cm3 as discussed in Liao, Tseng, and Tsai (Citation2018). Vref is the volume of the size standard particle calculated based on the traceable reference diameter (
). The volume of the residue on the size standard particle (
) was estimated as:
(6)
(6)
VR depends on the diameter of the droplet (ddroplet), the traceable reference diameter of the standard particle contained in the droplet, and the volume fraction of the impurity in the droplet liquid. The volume fraction of the impurity was estimated by the mean diameter of the residue particles (dR, ranging from 12.2 to 17.8 nm) which were determined as the droplets containing no standard particle were dried out. To simplify the estimation, two assumptions were made. First, both the atomized droplets with and without containing size standard particles were assumed to be the same as the number mean droplet diameter reported by the manufacturer of the atomizer (300 nm, Model 3076, TSI Inc.). Second, only water was removed as the droplets were being dried out. The predicted mass with considering the residue effect was used as the reference to quantify the APM accuracy. The mode particle mass measured by the APM is calculated as:
(7)
(7)
where q is the charge on the particle, VAPM is the voltage of the APM, and rc is the average of r1 and r2. All the geometry of the APM used in the present work was based on the APM model-3601 (r1 = 0.024 m, r2 = 0.025 m, Kanomax Inc.). The ratios of
to
at different
were fitted as a calibration curve to quantify the extent of the APM mass underestimation.
2.2. Correcting mass underestimation
For routine mass measurement, is no longer available because both the particle mass and density are unknown. To circumvent this difficulty,
was used instead of
to evaluate the APM mass underestimation.
is calculated based on the measured mass as:
(8)
(8)
Due to the APM mass underestimation, could be significantly lower than the particle mass, leading to an error in
The error should not be ignored and has to be quantified to ensure the validity of the correction method for routine mass measurement. In the present work, the error was evaluated according to the performance of the APM-3601 (
7000 and 14,000 rpm) at the air temperature of 25 °C. The spherical particles with the diameter of 10 to 50 nm and density of 0.5 and 1.0 g/cm3 were used in the evaluation. The measured mass based classification performance parameter
was calculated as:
(9)
(9)
L is the length of the APM classifying region (0.1 m for the APM model-3601),
is the average aerosol flow speed in the classifying region. The classification performance parameter can be used to estimate and control the transmission efficiency and mass classifying resolution of the APM as discussed in the literatures (Ehara, Hagwood, and Coakley Citation1996; Tajima et al. Citation2011; Citation2013; Liao, Tseng, and Tsai Citation2018). The slip correction factor of the particles (
) was calculated based on the empirical equation provided in Jung et al. (Citation2012) as:
(10)
(10)
where
is the mean free path of the gas molecule of the aerosol flow. With these considerations, a mass correction method was proposed for routine mass measurement.
2.3. Mass measurement of nanoparticles
The correction method was tested with laboratory generated silver nanoparticles and ambient nanoparticles. The measured mass was obtained with and without the correction and used to calculate the effective density as:
(11)
(11)
For silver nanoparticles, two different particle morphologies were tested, which were the spherical sintered silver nanoparticles ( 12–33 nm, aspect ratio: 1.1–1.2) and agglomerated non-sintered silver nanoparticles (17–70 nm, 1.1–2.1). The silver nanoparticles were generated with the evaporation-condensation method and measured by a DMA-APM system as reported in our previous work (Setup B, Liao, Tseng, and Tsai Citation2018). The mode mobility size of the sintered silver nanoparticles (dmob,NS) was determined by the second EC deployed downstream the second furnace while the size of the non-sintered silver nanoparticles (dmob,S) was determined by the second EC deployed downstream the first EC.
For ambient nanoparticles, a field measurement was conducted at the roof of the institute of environmental engineering (a five floor building) in Guangfu Campus of National Chiao Tung University, an urban region in East district of Hsinchu City, Taiwan, in January 2018. A DMA-APM system (DMA Model-3081, TSI Inc.; APM Model-3601, Kanomax Inc.) was used to measure the size and mass of ambient nanoparticles, and a water scanning mobility particle sizer (WSMPS, Hanyang University, South Korea) was used to monitor the size distribution of the ambient particles with size ranging from 10 to 300 nm. The average temperature in the system is 1.3 °C lower than the average ambient temperature of 18.9 °C, and the average relative humidity in the system is 8.5% lower than average ambient relative humidity of 81.7%. For the size and mass measurement, the ambient aerosols were first size-selected (dmob1, wet size, 30, 100, and 160 nm) by an electrostatic classifier (EC, Model-3080, TSI Inc.), and then the mono-disperse particles were introduced to a humidity control system prior to the size (dmob2) and mass (mAPM) measurement. The humidity control system included a silica gel dryer which was used to reduce the relative humidity to below 15% to remove the water from the particles (dry condition, McMurry et al. Citation2002) while the dryer can also be bypassed to keep the particles at wet condition (humid ambient condition). The size and mass of the aerosols were measured at the dry and wet conditions, respectively, to study the effect of the water content on aerosol size and effective density. Both the size and mass measurement were conducted manually for stable and clear response spectra. The details of the experimental setup are provided in S1 of the supplementary information (SI).
3. Results and discussion
3.1. Correction method
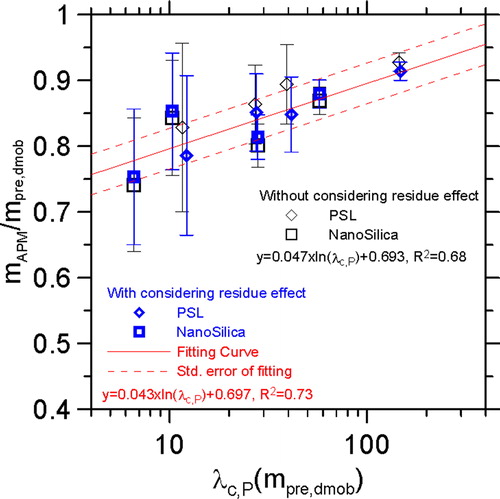
The ratio of the measured particle mass to the predicted particle mass of the PSL and NanoSilica nanoparticles are shown in . When the residue effect on the predicted mass was taken into account, the mass ratio of the PSL was decreased by 0.01–0.05 while that of the NanoSilica was increased by 0.1. The different residue effects on the PSL and NanoSilica are due to that the density of the residue is higher than PSL but lower than that of NanoSilica. In addition, the R-squared of the data regression is increased from 0.68 to 0.73 as the residue effect is taken into consideration. A fitting curve is obtained as:
(12)
(12)
where y
is the ratio of the measured mass to the predicted particle mass. The standard error of the fitting is ± 0.031 in the mass ratio (dash lines in ). EquationEquation (12)
(12)
(12) is then applied to correct the APM mass underestimation as:
(13)
(13)
where
and
are the raw and corrected measured particle mass. The correction method should be applicable for
ranging between 4 and 400, which is the test range of the size standard particles analyzed in the present work.
Figure 1. Ratio of the measured mass to the predicted mass of the size standard nanoparticles.
Care must be taken that EquationEquation (13)(13)
(13) can only be used for the calibration of the APM for nanoparticles with known mass or can be approximated by
For nanoparticles with unknown particle mass and density,
is no longer available because
is unknown, and instead
has to be used in EquationEquation (13)
(13)
(13) for the correction method. However, due to the APM mass underestimation,
could be significantly lower than the true particle mass, leading to an error in the correction. The error is evaluated by comparing the mass correction based on
with that based on
denoted as
and
respectively.
is calculated according to the assumed particle size (dp: 10 to 50 nm) and the assumed particle density (1 and 0.5 g/cm3) to obtain
while
is the corresponding “measured mass” estimated based on EquationEquation (12)
(12)
(12) and is re-written as:
(14)
(14)
As the results shown in , is always smaller than y[
] due to the APM mass underestimation. Besides, a smaller error was observed at higher rotational speed while larger error was observed for lower particle density. However, all the errors in
are less than—4%, which is far smaller than the error in the mass underestimation which could be over—20% in the particle mass as shown in . It was also found that the errors were independent of the aerosol flow rate. The results suggest that it would be fine to correct the APM mass underestimation with the measured mass, and
in EquationEquation (13)
(13)
(13) can be replaced by
without leading to a noticeable error in the correction.
Figure 2. (a) Difference between y[] and y[
] due to the APM mass underestimation, and (b) recommended operating condition for the mass correction method.
![Figure 2. (a) Difference between y[λc,P(mAPM)] and y[λc,P(mp)] due to the APM mass underestimation, and (b) recommended operating condition for the mass correction method.](/cms/asset/1cf188de-0681-470c-b6c1-ce0ed3ad1dbb/uast_a_1626345_f0002_b.jpg)
Besides, a suggested range of the APM operating condition is set for the mass correction method as shown in the shaded region in . Operating the APM at no less than 0.01 is recommended otherwise the error in y[
] could be larger than that estimated in the present work. In addition, an upper limit of λc(mAPM) is set to avoid the unnecessary correction which happens when λc,P(mP) is over 400. According to EquationEquation (13)
(13)
(13) , mAPM,correct would almost be equal to mAPM when λc,P(mP) is near 400. In other words, the correction at λc,P(mp) over 400 is not necessary since at such situation the APM mass underestimation is insignificant (e.g., less than 5% in the particle mass as the experimental data shown in ). shows an example of the upper limit of λc(mAPM) for 50 nm, which is 1.49 at the flow rate of 0.3 L/min, and is 0.30 at the flow rate of 1.5 L/min. Comparing with λc,P(mAPM) which is independent of the flow rate (EquationEquation (8)
(8)
(8) ), a higher flow rate leads to a lower λc(mAPM), which causes the upper limit decrease with the increasing flow rate. For various particle diameters, the upper limit of λc(mAPM) increases with decreasing particle size. For instance, the upper limit of λc(mAPM) is 3.74 and 32.02 for 30 and 10 nm particle, respectively. Moreover, the upper limit of λc(mAPM) also depends on temperature but is almost insensitive to pressure. For example, it is reduced by 11–13% as temperature is reduced from 25 °C to 0 °C as the dashed line shown in while it does not change when pressure is reduced from 1 atm to 0.5 atm. It is recommended to correct for the APM measured mass when the operation condition is at λc(mAPM) below the upper limit. If λc(mAPM) is larger than the upper limit, there is no need to apply the mass correction.
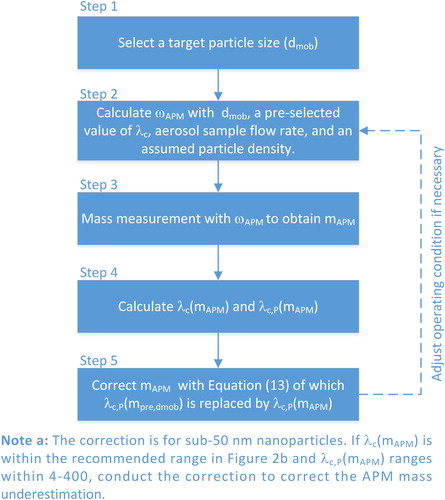
introduces the flowchart of routine mass measurement with the mass correction. First, a targeted particle size is selected, and a rotational speed is calculated for the mass measurement based on an assumed particle density, the aerosol sample flow rate, and a pre-selected value of As the rotational speed is obtained, the mass measurement is conducted to obtain
which is used to calculate
and
If both
and
are within the recommended ranges, the mass correction method can be applied to correct the APM mass underestimation with EquationEquation (13)
(13)
(13) in which
is replaced by
as the measured mass-based correction. If
and
are not as proper as expected, such as the parameters are too low or the APM response spectra is not clear due to low inlet particle concentration or low transmission efficiency, adjusting the rotational speed or aerosol flow rate to improve the quality of the mass measurement may be needed (redo Step 2–Step 5). It is worth to note that the mass correction can also be applied to previous mass measurement data for data analysis if the APM operating condition is available.
Figure 3. Flowchart of the APM mass measurement with the mass correction method.
3.2. Laboratory-generated silver nanoparticles
The effective densities of the sintered and non-sintered silver nanoparticles are shown in , respectively. The effective density was fitted as a function of the mobility diameter to track the size dependency and data variability. It was found that the R-squared of the fitting was improved significantly by the mass correction method from 0.40 to 0.87 for the sintered silver nanoparticles. The low R-squared of the raw data (without the correction) is due to different APM operating conditions which lead to different extent of the mass underestimation. For instance, the particle mass of 18 nm sintered silver nanoparticles measured with λc,P(mAPM) of 4.12 at 0.306 liter/min (4739 rpm, 0.65 volt, and λc(mAPM) of 0.11) is 0.0172 ± 0.0012 fg, which is 16% lower than that measured with λc,P(mAPM) of 24.29 at the same flow rate (0.0204 ± 0.0005 fg, 10,557 rpm, 3.82 volt, and λc(mAPM) of 0.62) and 12% lower than that measured with λc,P(mAPM) of 23.45 but at a higher flow rate of 1.36 L/min (0.0199 ± 0.0006 fg, 10,511 rpm, 3.69 volt, and λc(mAPM) of 0.13). In contrast, when the mass correction method is applied to the measured mass, the difference between the mass with λc,P(mAPM) of 4.12 and the mass with λc,P(mAPM) of 24.29 is reduced to 7.3%, and the difference between the mass with λc,P(mAPM) of 4.12 and the mass with λc,P(mAPM) of 23.45 is reduced to 3.4%, respectively. Similar improvement is also observed for the non-sintered silver nanoparticles (R-squared improved from 0.67 to 0.77).
Figure 4. Effective density of (a) sintered silver nanoparticles and (b) non-sintered silver nanoparticles.
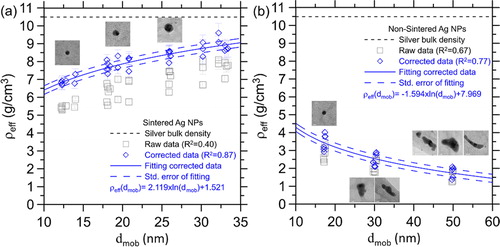
Besides, even if the mass correction is taken into account, the effective density of the sintered silver nanoparticles is still lower than the bulk silver density (10.49 g/cm3) with a size dependency (decreasing from 9.6 g/cm3 at 33 nm to 6.7 g/cm3 at 12 nm). The low effective density should not be due to the APM mass underestimation, but rather demonstrates the inherent characteristics of the nanoparticles (Hering and Stolzenburg Citation1995; Fernández de la Mora et al. Citation2003; Nanda Citation2012; Tadjiki et al. Citation2017). For the non-sintered silver nanoparticles, the effective density calculated with the corrected measured mass is reduced from 4.0 to 1.4 g/cm3 with increasing particle size from 17 to 50 nm. The low effective density and its size dependency of the non-sintered silver nanoparticles are reasonable due to the agglomerated morphology as revealed by the electron microscope images shown in . Moreover, for 17 nm non-sintered silver nanoparticles, although, they are less agglomerated and more close to spheres comparing to larger non-sintered silver nanoparticles, their effective density (4 g/cm3) is still significantly lower than that of the sintered silver nanoparticles (6.7 g/cm3), indicating different internal structures (e.g., porosity) between the sintered and non-sintered silver nanoparticles.
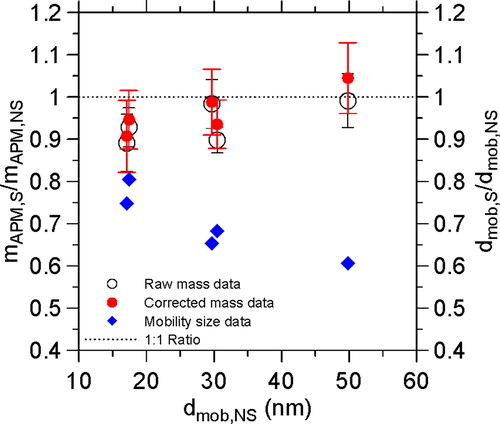
To check the influences of the particle size and morphology of sub-50 nm nanoparticles on the APM mass measurement, the measured particle masses of the silver nanoparticles with (mAPM,) and without (mAPM,) sintering are compared as the results shown in . It is seen that for the case without correction, mAPM,S/mAPM,NS ratios are 0.89, 0.93, 0.98, 0.90, and 0.99 at the dmob,S/dmob,NS of 0.75, 0.80, 0.65, 0.68, and 0.61, respectively. For the case with correction, mAPM,S/mAPM,NS ratios are changed only slightly. It indicates that the particle size and morphology don’t seem to influence the APM mass measurement even at the sub-50 nm size range (12–50 nm).
Figure 5. Ratio of the particle mass and size of the sintered silver nanoparticles to that of the non-sintering silver nanoparticles.
3.3. Ambient nanoparticles
The effective densities of the 30 nm ambient nanoparticles at the wet and dry conditions were measured with the DMA-APM system and the results are shown in . Five rounds of the measurement were conducted on three different days, which were denoted as round a (January 6, during 10:15–12:00 for wet condition measurement, 12:00–15:00 for the dry condition measurement), b (Janurary 6, 15:00–17:00 for wet, 17:00–19:00 for dry), c (January 20, 09:40–10:30 for wet, 10:30–11:00 for dry), d (January 21, 09:00–09:30 for wet, 09:30–10:00 for dry), and e (January 21, 16:30–17:20 for wet, 17:20–17:42 for dry) as labeled besides the symbols. The average wet and dry effective densities were 0.91 ± 0.11 g/cm3 and 1.07 ± 0.28 g/cm3, respectively, which were increased to 1.09 ± 0.13 g/cm3 and 1.29 ± 0.34 g/cm3 as the mass correction method was applied. Both the dry and wet effective densities estimated with the mass correction were 20% higher than that without the correction, and the difference is due to the APM mass underestimation. Besides, the effective densities were compared to a composition-based effective density of ultrafine particles (Dp < 0.1 nm, 1.45 g/cm3) reported in Chen et al. (Citation2010), which collected the ultrafine particles at a roadside nearby to our sampling site within 1.5 km. The dry effective densities obtained in the present work fluctuated about 1.45 g/cm3 while all the wet effective densities were below 1.45 g/cm3. The trend is reasonable because the effective density becomes more close to the density of water as the particles contain more water. In contrast, both the dry effective density and the composition-based effective density were estimated without or with small water content in the particles, which were mainly dominated by the materials with densities higher than 1.0 g/cm3 (e.g., Organic matters: 1.0–1.2 g/cm3, ionic species: 2.0 g/cm3, elemental carbon: around 1.5 g/cm3) though the effective densities also depend on the particle morphology.
Figure 6. (a) Wet and (b) dry effective densities of 30 nm ambient nanoparticles.
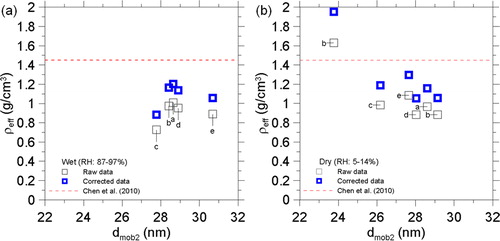
Besides, bimodal dry size distribution (peaks: 23.8 and 29.1 nm in dmob2) was observed in round b measurement, leading to two distinct dry effective densities (1.06 and 1.95 g/cm3) while only a wet effective density (1.17 g/cm3) was observed. Bimodal wet and dry mass distributions were also observed in larger ambient nanoparticles (160 nm in dmob1, not shown), leading to multiple effective densities. The results show the influence of the aerosol water content on the size, mass, and effective density of the ambient particles. The influence of relative humidity on ambient aerosols has been widely studied with the hygroscopic tandem DMA (H-TDMA) by drying ambient particles prior to the measurement first, and then size-selecting and conditioning the particles at low and high relative humidity conditions, respectively, to observe the particle size change between different conditions for the estimation of the water uptake (Swietlicki et al. Citation2008). However, the water uptake is not necessarily proportional to the equivalent mobility size due to unknown particle morphology and its response to the water uptake (Mikhailov et al. Citation2009; Hsiao et al. Citation2016; Vlasenko et al. Citation2017). In contrast, the water uptake is a kind of mass transfer and should be fully quantified by the change in the particle mass. To examine the uncertainty in the size based estimation, the size-based and mass-based water losses of ambient particles were compared, which are defined as:
(15)
(15)
(16)
(16)
where
and
are the wet and dry mobility diameters of the particles,
is the density of water (1 g/cm3), and
and
are the measured wet and dry mass, respectively, in which the mass correction method has been incorporated. It was assumed that only water was removed by the dryer. The results of the comparison are shown in , and it was found that the agreement between the size and mass based measurement was highly dependent on the time interval between the wet and dry measurement, which were conducted in sequence instead of simultaneously. Considerable difference between the size and mass based estimations (up to 148%) was observed at the time interval of 40–45 min, and the difference was reduced (–47 to +19%) as the time interval was reduced to below 30 min. The time interval is due to the time required for conditioning the sample flow (from wet to dry or vice versa) which mainly depends on the sample flow rate and the performance of the dryer. A longer time interval may lead to more uncertainty in the measurement which may be due to the time dependency of ambient particles as the size distribution tracked by the WSMPS (See S2 of the SI ). For a time interval below 30 min, the size-based water loss is usually lower than the mass based water loss, which is reasonable since the mass transfer of water may not be fully quantified by the particle size change due to the uncertainty in the particle morphology. In addition, the mass growth factor (
) is calculated with
and
as:
(17)
(17)
Figure 7. (a) Ratio of the size-based water loss to the mass-based water loss, and (b) mass growth factor of ambient particles.
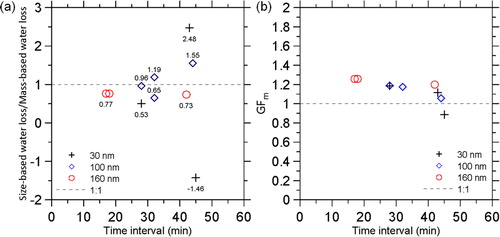
It was found that of the 30, 100, and 160 nm ambient particles (dmob1, wet size) ranged from 1.06 to 1.26 except a data point with
of 0.89 was observed. Theoretically,
should be equal (Nearly hydrophobic, NH) or greater than 1 (Hygroscopic).
below 1 means that particles gain more water at lower relative humidity, which is not physically correct, and thus
of 0.89 should be an error maybe due to the uncertainty in the measurement for a longer time interval. The results show a significant time interval dependency on the estimation. Therefore, it is suggested to minimize the time interval to reduce the uncertainty such as conducting wet and dry measurement simultaneously.
Vlasenko et al. (Citation2017) reported that the of 160 nm ambient particles (dry size) measured with a HTDMA-CPMA system in a sub-urban forest environment was about 2.2 at 93% RH, which is much higher than
of 1.06–1.26 observed in the present work (corresponding to dry size of 26–156 nm). According to our best knowledge, most of the ambient particle mass measurement studies focus on the dry particle condition only (RH below 10–30%) in order to eliminate the uncertainty from water for precise estimation on the chemical composition (McMurry et al. Citation2002; Geller, Biswas, and Sioutas Citation2006; Levy et al. Citation2013; Citation2014; Rissler et al. Citation2014; Yin et al. Citation2015; Xie et al. Citation2017) while only one study takes the aerosol water uptake into consideration (Vlasenko et al. Citation2017). Care must be taken that the formation and transformation of ambient aerosols are progressing in ambient condition (e.g., temperature and relative humidity) which is not necessary to be the dry condition, and the characteristics of the ambient aerosols in ambient condition should not be ignored particularly for high humidity regions.
4. Conclusion
A mass correction method was developed to correct the APM mass underestimation for routine mass measurement. The correction method was tested with the mass measurement of laboratory generated silver nanoparticles and ambient nanoparticles, respectively. For the silver nanoparticles, the data variation of the effective density due to different extent of the mass underestimation at different APM operating conditions was reduced by the present correction method significantly, suggesting that the data quality was improved. Besides, the APM mass measurement was not sensitive to the particle morphology even at the sub-50 nm size range, which is an important feature to track the mass transfer of nanoparticles without suffering the uncertainty in the particle morphology, such as the water uptake on ambient nanoparticles. For ambient nanoparticles, bimodal size and mass distributions were observed, leading to multiple effective densities. About 20% increase in the effective density was observed for 30 nm ambient nanoparticles as the mass correction method was applied. The difference between the raw and corrected effective densities should be taken into account in the data analysis of APM measurement.
Supplemental Material
Download MS Word (889.4 KB)Acknowledgment
Special thanks to the support of the WSMPS from Hanyang University (South Korea) and the valuable discussion with Prof. Ta-Chih Hsiao (National Central University, Taoyuan, Taiwan).
Disclosure statement
No potential conflict of interest was reported by the authors.
Additional information
Funding
Related Research Data
References
- Broßell, D., M. Valenti, S. Bezantakos, A. Schmidt-Ott, and G. Biskos. 2015. The nano-particle mass classifier (nano-PMC): Development, characterization, and application for determining the mass, apparent density, and shape of particles with masses down to the zeptogram range. Aerosol. Sci. Technol. 49 (7):495–507.
- Buckley, D. T., S. Kimoto, M.-H. Lee, N. Fukushima, and C. J. Hogan. 2017. Technical note: A corrected two dimensional data inversion routine for tandem Mobility-Mass measurements. J. Aerosol Sci. 114:157–168. doi: 10.1016/j.jaerosci.2017.09.012.
- Chen, S. C., C. J. Tsai, C. C. K. Chou, G. D. Roam, S. S. Cheng, and Y. N. Wang. 2010. Ultrafine particles at three different sampling locations in Taiwan. Atmos. Environ. 44 (4):533–540. doi: 10.1016/j.atmosenv.2009.10.044.
- DeCarlo, P. F., J. G. Slowik, D. R. Worsnop, P. Davidovits, and J. L. Jimenez. 2004. Particle morphology and density characterization by combined mobility and aerodynamic diameter measurements. Part 1: Theory. Aerosol Sci. Technol. 38 (12):1185–1205. doi: 10.1080/02786826.2004.10399461.
- Ehara, K., C. Hagwood, and K. J. Coakley. 1996. Novel method to classify aerosol particles according to their mass-to-Charge Ratio-Aerosol particle mass analyzer. J. Aerosol Sci. 27 (2):217–234. doi: 10.1016/0021-8502(95)00562-5.
- Fernández de la Mora de Juan, L., K. Liedtke, and A. Schmidt-Ott. 2003. Mass and size determination of nanometer particles by means of mobility analysis and focused impaction. J. Aerosol Sci. 34:79–98.
- Geller, M., S. Biswas, and C. Sioutas. 2006. Determination of particle effective density in urban environments with a differential mobility analyzer and aerosol particle mass analyzer. Aerosol. Sci. Technol. 40:709–723. doi: 10.1080/02786820600803925.
- Hering, S. V., andM. R. Stolzenburg. 1995. On line determination of particle size and density in the nanometer size range. Aerosol Sci. Technol. 23:155–173.
- Hinds, W. C. 1999. Aerosol technology: Properties, behavior, and measurement of airborne particles. 2nd ed. New York: Wiley.
- Hsiao, T. C., L. H. Young, Y. C. Tai, and P. K. Chang. 2018. Effects of temperature, pressure, and carrier gases on the performance of an aerosol particle mass analyzer. Atmos. Meas. Tech. 11 (8):4617–4626. doi: 10.5194/amt-11-4617-2018.
- Hsiao, T. C., L. H. Young, Y. C. Tai, and K. C. Chen. 2016. Aqueous film formation on irregularly shaped inorganic nanoparticles before deliquescence, as revealed by a hygroscopic differential mobility Analyzer-Aerosol particle mass system. Aerosol Sci. Technol. 50 (6):568–577. doi: 10.1080/02786826.2016.1168512.
- Jung, H., G. W. Mulholland, D. Y. H. Pui, and J. H. Kim. 2012. Re-evaluation of the slip correction parameter of certified PSL spheres using a nanometer differential mobility analyzer (NDMA). J. Aerosol Sci. 51:24–34. doi: 10.1016/j.jaerosci.2012.04.005.
- Levy, M. E., R. Zhang, A. F. Khalizov, J. Zheng, D. R. Collins, C. R. Glen, et al. 2013. Measurements of submicron aerosol in Houston, Texas during the 2009 sharp field campaign. J. Geophys. Res. Atmos. 118:10518–10534.
- Levy, M. E., R. Zhang, J. Zheng, H. Tan, Y. Wang, L. T. Molina, et al. 2014. Measurements of submicron aerosols at the California-Mexico border during the Cal-Mex 2010 field campaign. (2014). Atmos. Environ. 88:308–319. doi: 10.1016/j.atmosenv.2013.08.062.
- Liao, B. X., N. C. Tseng, and C. J. Tsai. 2018. The accuracy of the aerosol particle mass analyzer for nanoparticle classification. Aerosol Sci. Technol. 52 (1):19–29. doi: 10.1080/02786826.2017.1370532.
- Lin, G. Y., B. X. Liao, N. J. Tzeng, C. W. Chen, S. N. Uang, S. C. Chen, et al. 2014. The effect of nanoparticle Convection-Diffusion loss on the transfer function of an aerosol particle mass analyzer. Aerosol Sci. Technol. 48 (6):583–592. doi: 10.1080/02786826.2014.902027.
- McMurry, P. H., X. Wang, K. Park, and K. Ehara. 2002. The relationship between mass and mobility for atmospheric particles: A new technique for measuring particle density. Aerosol Sci. Technol. 36 (2):227–238. doi: 10.1080/027868202753504083.
- Mikhailov, E., S. Vlasenko, S. T. Martin, T. Koop, and U. Pöschl. 2009. Amorphous and crystalline aerosol particles interacting with water vapor: Conceptual framework and experimental evidence for restructuring, phase transitions and kinetic limitations. Atmos. Chem. Phys. 9 (24):9491–9522. doi: 10.5194/acp-9-9491-2009.
- Nanda, K. K. 2012. Size-dependent density of nanoparticles and nanostructured materials. Phys. Lett. 376:3301–3302.
- Olfert, J. S., and N. Collings. 2005. New method for particle mass classification-the couette centrifugal particle mass analyzer. J. Aerosol Sci. 36 (11):1338–1352. doi: 10.1016/j.jaerosci.2005.03.006.
- Rawat, V. K., D. T. Buckley, S. Kimoto, M.-H. Lee, N. Fukushima, and C. J. Hogan. 2016. Two dimenstional size-mass distribution functin inversion from differential mobility analyzer-aerosol particle mass analyzer (DMA-APM) measurements. J. Aerosol Sci. 92:70–82. doi: 10.1016/j.jaerosci.2015.11.001.
- Rissler, J., E. Z. Nordin, A. C. Eriksson, P. T. Nilsson, M. Frosch, M. K. Sporre, et al. 2014. Effective density and mixing state of aerosol particles in a near-Traffic urban environment. Environ. Sci. Technol. 48 (11):6300–6308. doi: 10.1021/es5000353.
- Swietlicki, E., H.-C. Hansson, K. Hämeri, B. Svennigsson, A. Massling, G. Mcfiggans, et al. 2008. Hygroscopic properties of submicrometer atmospheric aerosol particles measured with H-TDMA instruments in various Environments—A review. Tellus 60B:432–469.
- Tadjiki, S.,M. D. Montano,S. Assemi,A. Barber,J. Ranville, andR. Beckett. 2017. Measurement of the density of engineered silver nanoparticles using centrifgual FFF-TEM and single particle ICP-MS. Anal. Chem. 89:6056–6064.
- Tajima, N., N. Fukushima, K. Ehara, and H. Sakurai. 2011. Mass range and optimized operation of the aerosol particle mass analyzer. Aerosol. Sci. Technol. 45 (2):196–214. doi: 10.1080/02786826.2010.530625.
- Tajima, N., H. Sakurai, N. Fukushima, and K. Ehara. 2013. Design considerations and performance evaluation of a compact aerosol particle mass analyzer. Aerosol. Sci. Technol. 47 (10):1152–1162. doi: 10.1080/02786826.2013.827323.
- Vlasenko, S. S., H. Su, U. Pöschl, M. O. Andreae, and E. F. Mikhailov. 2017. Tandem configuration of differential mobility and centrifugal particle mass analyzers for investigating aerosol hygroscopic properties. Atmos. Meas. Tech. 10 (3):1269–1280. doi: 10.5194/amt-10-1269-2017.
- Xie, Y., X. Ye, Z. Ma, Y. Tao, R. Wang, C. Zhang, et al. 2017. Insight into winter haze formation mechanisms based on aerosol hygroscopicity and effective density measurements. Atmos. Chem. Phys. 17 (11):7277–7290. doi: 10.5194/acp-17-7277-2017.
- Yin, Z., X. Ye, S. Jiang, Y. Tao, Y. Shi, X. Yang, and J. Chen. 2015. Size-resolved effective density of urban aerosols in shanghai. Atmos. Environ. 100:133–140. doi: 10.1016/j.atmosenv.2014.10.055.