
Abstract
The custom-built Portable Fine Particle Concentrator (PFPC) is evaluated for the measurement of ice nucleating particles (INPs) in the atmosphere. The concentrations of INPs in remote regions of the atmosphere are very low, often close to instrumental detection limits. The PFPC is a dual slit-nozzle virtual impactor where particles are concentrated from an input flow of 250 LPM (litres per minute) into an output flow of 10 LPM. The enrichment factors (EFs) for ambient particles with diameters between 0.4 and 2.5 µm were found to be 21 ± 5 at sea level and 18 ± 2 at a field station 3580 meters above sea level for the PFPC operated in horizontal configuration. Similar enhancement factors (16 ± 5) in the concentrations of INPs measured by the Horizontal Ice Nucleation Chamber at the high-altitude station were observed when the air mass was characterized by high numbers of particles larger than 0.5 µm. When the number size distribution was dominated by particles smaller than 0.5 µm, the INP EF was considerably lower. Corroborating short-term measurements were provided by additional INP-measuring instruments, the Fast Ice Nucleus CHamber and the Frankfurt Ice Deposition Freezing Experiment. Results from two aerosol mass spectrometers also indicate significant particle enhancement using the PFPC. These results indicate that the PFPC can be usefully deployed to improve the detection efficiency of ambient INP measurements.
Copyright © 2019 American Association for Aerosol Research
Introduction
The Earth’s atmosphere hosts many different aerosol particle types, varying greatly in size, composition and number depending on their sources and atmospheric processing conditions. A small subset of these particles has characteristics which enable them to facilitate ice formation under atmospheric conditions and such particles are referred to as ice nucleating particles (INPs) (Vali et al. Citation2015). Ice-forming processes are highly relevant for cloud formation (Kanji et al. Citation2017; Pruppacher and Klett Citation1997) and are directly linked to the effects that clouds have on the Earth’s climate by influencing radiative forcing (Korolev et al. Citation2017; Boucher et al. Citation2013) and precipitation formation (Mülmenstädt et al. Citation2015). Mineral dust and combustion particles as well as biological particles (e.g., bacteria, pollen, and fungal spores, phytoplankton exudates) have been found to contribute to ice formation in the atmosphere by heterogeneous ice nucleation (Kanji et al. Citation2017; Hoose and Möhler Citation2012).
To implement meaningful representations of ice nucleation processes in climate models, more information about INP abundance and pathways of ice formation is required (Boucher et al. Citation2013), especially in regions with low INP concentration such as the Arctic (e.g., Prenni et al. Citation2009; Rogers, DeMott, and Kreidenweis Citation2001). INP measurements are often constrained by the limit of detection (LOD) of available instrumentation (Cziczo et al. Citation2017). For example, Continuous Flow Diffusion Chambers (CFDCs), an online method which is widely used to study INPs, have difficulties detecting INP concentrations of <1 L−1, a typical INP concentration in the free troposphere and remote regions of the atmosphere (Cziczo et al. Citation2017; Lacher et al. Citation2017; Boose et al. Citation2016a; DeMott et al. 2016). Furthermore, systematic bias in available data sets may be present, given that data below an instrument LOD are often neglected (Boose et al. Citation2016b).
Whether a measurement is above the LOD of an instrument is determined by the instrument-specific signal-to-noise ratio. Longer sampling times may improve the measurements by increasing the precision of the measurement or by increasing the signal-to-noise ratio. The latter is possible due to a decrease in noise (which is Poisson distributed) with longer sampling times thus lowering the LOD. For online INP instrumentation, an extended sampling time increases the sampled volume and thus the signal, though sacrifices the temporal resolution of the measurement, leading to a loss of information on short-term variability of INP concentrations. Offline freezing measurement techniques such as cold stages or drop freezing arrays (Cziczo et al. Citation2017; Budke and Koop Citation2015; Bigg Citation1953) generally have lower LODs than online methods and are highly sensitive in determining INPs activating at warmer temperatures. However, offline methods often require extended collection times and sample storage prior to measurement. This constrains the ability of filter sampling methods to measure short-term changes in INP concentrations that occur with variable environmental conditions.
Both online and offline methods can benefit from particle enrichment upstream of the measurements. The advantage for offline methods is that a shorter sampling time is needed, resulting in a higher time resolution; the signal-to-noise of online INP instruments can be enhanced without the need to increase the sampling time. Enrichment can be achieved through virtual impaction particle concentrators which enrich the number of ambient particles from a high volume flow into a low volume flow (Loo and Cork Citation1988). For the most part, particle concentrators have been used for health and toxicology studies where the influence of aerosols on the respiratory and cardiovascular system is examined (e.g., Demokritou et al. Citation2003; Sioutas et al. Citation1995). More recent studies applied particle concentrators for online atmospheric aerosol measurements (e.g., Saarikoski et al. Citation2014) and for INP measurements (e.g., McCluskey et al. Citation2017, Citation2018; Suski et al. Citation2018; DeMott et al. 2017; Boose et al. Citation2016a; Prenni et al. Citation2013; Tobo et al. Citation2013). In particular, a 3-stage concentrator first described in Prenni et al. (Citation2013) and Tobo et al. (Citation2013) and based on the principal of virtual impaction, has been used in several field and lab studies in different environments, including agricultural fields, forest and marine environments. These initial studies reported an enrichment of INP concentrations over ambient values of a value of 103. Also, we note that aerodynamic lenses also lead to particle concentration (Liu et al. Citation1995). However, they generally have a large pressure drop across the lens which can potentially lead to the desorption of surface sorbed species, thus affecting the ice nucleation abilities of the particles.
We present in this article an evaluation of a new Portable Fine Particle Concentrator (PFPC) for atmospheric INP measurements. Described below, the PFPC is built along the design by Sioutas et al. (Citation1995). The instrument's ability to concentrate particles as a function of particle diameter is evaluated in the laboratory at sea level. Then, experiments are presented for the use of the concentrator at high elevation (3580 m above sea level [asl]) as part of a field campaign, where enrichment factors (EFs) for INPs, ambient particle concentration, and aerosol mass spectrometer particle composition were measured.
Experimental
Portable Fine Particle Concentrator (PFPC)
The PFPC is a two-stage concentrator designed and built at Harvard University, and based on the design of Sioutas et al. (Citation1995). The total inlet flow is 250 LPM, and the total outlet flow is 10 LPM. Across each stage, the flow is split into a major flow and a minor flow, at a ratio of roughly 5:1. The major flow, containing the gas phase and smaller particles, is pumped away whereas the minor flow contains the concentrated (larger) particles (see ). The two slit-nozzle virtual impactors combine to concentrate particles in the particle diameter range of 0.1–2.5 µm (Sioutas et al. Citation1995). Enrichment is not as efficient for the smallest sized particles because they more readily follow the streamlines of the gas flow and so most exit with the major flow. Due to inertia, larger particles can cross the flow streamlines and are concentrated. The total pressure drop across both stages was measured upon fabrication to be 9.5 hPa and therefore negligible chemical or physical alteration of the particles should occur. Each slit stage consists of an acceleration slit 0.33 mm wide, a collection slit 0.51 mm wide, and a 0.51 mm gap between them. Each concentrator stage operates by minimizing aerosol losses while removing 80% of the total air flow.
Figure 1. (a) Schematic of the PFPC stages, each consisting of a two slit-nozzle. The inlet flow is 250 LPM and particles are concentrated into a 10 LPM outlet flow. Major flows represent unconcentrated air being removed by the pumps. Flow settings of the PFPC are monitored by three pressure readings against atmosphere. (b) Horizontal configuration of the PFPC, and (c) vertical configuration of the PFPC. Air flows through the size selective inlet, either PM 10 or 2.5, then the two-stage slit nozzle concentrator. Flows are manually controlled using differential pressure gauges to monitor flow rates. The cylinder for the two optional impactors for 2.5 and 10 µm particles is in the front of the PFPC rack (right hand side) and the pressure readings on the left-hand side. A schematic with dimensions of the stages is provided in Figure S1 (online supplemental information).
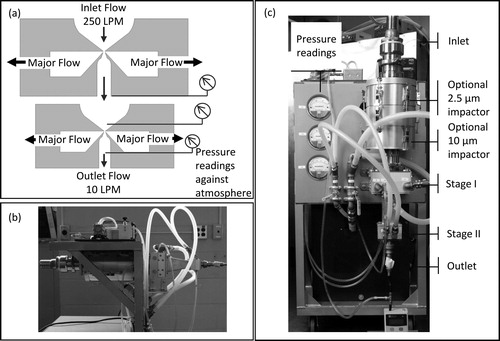
In its original configuration, the virtual impactor stages were in a vertical configuration, with the particle flow directed downward across the stages. For field deployment, this setup was changed to a horizontal flow setup to account for the available space and inlet configuration at the sampling site. A schematic of the two concentrator stages is shown in ; side and top view drawings with dimensions are provided in Figure S1 (see the SI). If required, larger particles of diameters >2.5 µm or >10 µm can be removed upstream of the concentrator stages by conventional (i.e., non-virtual) impactors. The conventional impactors to remove particles larger than 2.5 or 10 µm were not applied in this study. Enrichment of these larger particles will occur but was not characterized in this work given the possibility of large line losses for such large particles in the setup used.
The concentrator is housed on a mobile aluminum cart 61-cm-wide by 84-cm-deep by 122-cm-high; the total weight of the unit, including the cart, pumps and concentrator stages is 140 kg. The weight of the concentrator largely arises from two pumps that pull the two major flows in the impactors. The first stage pump is a Busch SV1016 C (317 LPM, 0.75 HP) and the second is a Gast G588 (170 LPM, 0.75 HP). Additionally, installed is a FarHawk sound-dampened enclosure, a muffler on the pumps, and a HEPA filter on the exhaust outlet. When configured in the horizontal configuration, the inlet port (4.45 cm i.d.) is 107 cm from the floor. All measurements using the PFPC were started after a 30-min warm-up phase.
Laboratory evaluation
Tests were performed at the University of Toronto (∼80 m asl), with the PFPC set up to characterize the size-dependent particle enrichment using particles present in room air with no additional inlet connected in-line. A compact scanning mobility particle sizer unit (SMPS, TSI Model 3034, time resolution 2:15 min) was used to measure particles of sizes between 50 and 400 nm mobility diameter, and two optical particle counters (OPC, MetOne, Model GT-526S) were used to detect particles of diameters between 0.35 and 2.5 µm optical diameter. Side-by-side measurements of the two OPCs were performed to ensure similar sizing abilities, and the results are shown in Figure S2 (see the SI). Particle concentrations were measured up- and down-stream of the PFPC for each set of instruments. Downstream of the PFPC, instruments were connected using conductive tubing (either 5- or 6.4-mm i.d.) with a total length of 39 and 13 cm for measurements using the horizontal and vertical PFPC configurations, respectively.
For both laboratory and field measurements, it was ensured that the pressure ratios between the intake and outlet flow of each stage were kept constant for all measurements. Pressure is measured using pressure readings against atmosphere after stage I and before and after stage II, as shown in . Line loss calculations for the flows from the PFPC to the individual instruments were performed using the Particle Loss Calculator described in Von Der Weiden, Drewnick, and Borrmann (Citation2009). The line losses for all laboratory and field measurements were below 10% for all tubing configurations.
Evaluation at high elevation
An evaluation of the PFPC for low INP abundance was desirable and its operation at high elevation was tested. The PFPC was deployed inside the Sphinx Observatory at the High Altitude Research Station Jungfraujoch in the Swiss Alps (46°32′53″N, 7°59′2 ″E) located 3580 m asl. Evaluation tests were carried out as part of the CLACE/INUIT (CLACE: Cloud and Aerosol Characterization Experiment; INUIT: Ice Nuclei research Unit) field campaign in January and February 2017 (15.01.2017–21.02.2017). The observatory experiences free-tropospheric conditions during 60–80% of the winter time when vertical lifting of air masses from the planetary boundary layer are less likely to reach the station (Boose et al. Citation2016a; Herrmann et al. Citation2015; Zellweger et al. Citation2003). The INP concentration in the free troposphere is generally low and often close to the LOD of online INP counters (Lacher et al. Citation2018; Boose et al. Citation2016a).
The concentrator was located inside the observatory building and assembled in the horizontal configuration (see ). A heated inlet (3-m long, inner diameter of 6 cm; see Weingartner, Nyeki, and Baltensperger (Citation1999)) was mounted vertically from the rooftop to the window with a bend of 90° at the lower end before being directed through the window to the horizontal inlet of the PFPC. The inlet line outside the building was heated to 25 °C and was equipped with a heated snow-cap to prevent freezing and clogging of the PFPC slits. Measurements were taken during in-cloud and out-of-cloud conditions. With the inlet being heated at all times, ice crystal residuals sampled during in-cloud conditions may have contributed to the number of INPs detected as the inlet evaporates cloud droplets and ice crystals. As with the measurements at the University of Toronto, the PFPC performance was tested using a SMPS (time resolution 1:06 min) consisting of a condensation particle counter (CPC) (TSI 3772) and a differential mobility analyzer (DMA) (TSI 3082) to detect particles of 50–400 nm mobility diameter and an OPC (MetOne, GT-526S) for the range of 0.35–2.5 µm particles (optical diameter). The SMPS and OPC measurements were conducted sequentially upstream and downstream of the PFPC over 30-min time periods using 6.35 mm-i.d.-conductive tubing of a total length of 167 cm for the SMPS setup and 85 cm for the connection of the OPC, where both lines also consisted of two isokinetic splits. For the upstream measurements, the sampling line included the heated inlet.
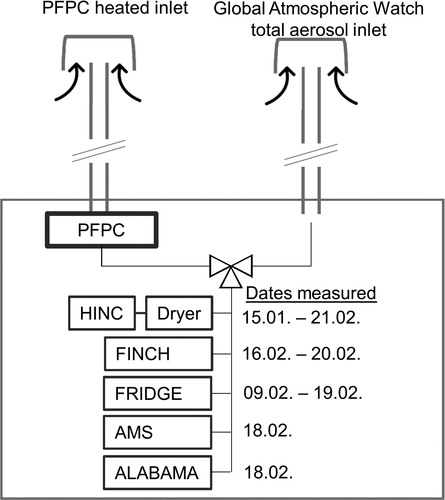
Figure 2. Schematic of the flow setup at the Sphinx Observatory for measurements of different INP and particle instruments downstream of the PFPC and the total aerosol inlet.
As part of the CLACE/INUIT 2017 measurements, the PFPC was deployed periodically upstream of the Horizontal Ice Nucleation Chamber (HINC) (Lacher et al. Citation2018). HINC (Lacher et al. Citation2017) detected INPs at a temperature of 242 K and relative humidity of 104% with respect to water with a 8-s residence time of particles inside the chamber. INP measurements with the HINC were conducted over a period of typically 6 h for 30 days. They were bracketed by approximately 30-min intervals at the beginning and the end of most days with the HINC attached to the Global Atmospheric Watch total aerosol inlet at the Sphinx Observatory to detect unconcentrated INPs. All HINC measurements were taken downstream of a molecular sieve diffusion dryer, connected via a line 129 cm long and 6.35 mm inner diameter. INP concentrations detected by HINC during CLACE/INUIT 2017 were in the range 0.01–233/L with a mean (median) 2.6 (0.5)/L. Estimated errors in INP concentrations are ±17%. A detailed account of the experimental procedure for field measurements with HINC are presented in (Lacher et al. Citation2017). A second INP chamber, the Fast Ice Nucleus CHamber (FINCH) based on the principle of a continuous flow mixing chamber and described elsewhere (Bundke et al. Citation2008) was operated downstream of the PFPC between 16 and 20 February. FINCH was connected to the PFPC using a 5.5 mm-i.d.-conductive tubing of a total length of 295 cm; estimated errors in the INP concentrations are less than 25%. FINCH INP measurements were conducted above water saturation at the mean temperature of either 244 or 249 K. Ambient INP concentrations measured by FINCH and included in the data set presented were 2.8 and 3.0 INPs/L. The Frankfurt Ice Deposition Freezing Experiment FRIDGE, described in Schrod et al. (Citation2016), sampled six samples downstream of the PFPC between 9 and 19 February (line length 190 cm, inner diameter 5.5 mm) with sampling times between 87 and 103 min; INP estimated errors are ±20%. FRIDGE INP measurements were conducted at 253, 248, and 243 K in deposition freezing mode. Ambient INP concentrations measured by FRIDGE at the Jungfraujoch station are in the range of 0.019–0.963 INPs/standard liter. Additional information about instrument operation and errors associated with each approach is available in the primary references for the instruments.
The composition of submicron, non-refractory aerosol particles was measured using a C-ToF-AMS (Compact Time-of-Flight Aerosol Mass Spectrometer [Canagaratna et al. Citation2007; Drewnick et al. Citation2005]) during 6 h on 18 February 2017. The instrument combines aerodynamic focusing and flash evaporation of the particles, followed by electron impact ionization and time-of-flight mass spectrometry. Size-resolved composition measurements can be obtained using a chopper wheel to modulate the particle beam. Mass spectrum mode (for total composition) and particle time-of-flight mode (for size-resolved measurements) were recorded alternately, spending 20 s in mass spectrum mode and 10 s in particle time-of-flight mode, saving the averages after 120 s. Calibration of ionization efficiencies and aerodynamic sizing were conducted on site. A collection efficiency correction of 0.5 was applied to the final data. On the same day, a single particle laser ablation aerosol mass spectrometer (ALABAMA; Schmidt et al. Citation2017; Brands et al. Citation2011) was connected to the PFPC. Briefly, ALABAMA is made up of an aerodynamic lens to focus the incoming particles, a two stage detection laser system to trigger a Nd:YAG laser (266 nm) and a bipolar Z-shaped time-of-flight mass spectrometer. Additionally, the two detection lasers allow to ascertain a vacuum aerodynamic diameter of sampled particles. During the CLACE/INUIT-2017 field campaign particles in the size range between about 200 and 1800 nm were detected with ALABAMA.
For the measurements described in this article, all INP instruments as well as the C-ToF-AMS and ALABAMA measured particles alternating between the total aerosol inlet and the PFPC inlet; measurement times for ALABAMA are provided in Table S2 (see the online supplementary information [SI]). A schematic of the flow setup with the all instruments connected to the PFPC is given in . Continuous atmospheric measurements at the station included particle number size distributions for ambient air using an optical particle sizer (OPS) operated by the Global Atmospheric Watch program and attached to the total aerosol inlet.
Results and discussion
Ambient particle enrichment factors
The performance of the PFPC is described in terms of particle EFs defined as the ratio of ambient particle concentrations measured downstream to those measured upstream of the PFPC. EFs are calculated for each set of measurements performed with the different instruments listed above. Calculated EFs from SMPS and OPC measurements plotted against particle diameter are shown in . Smaller particles (50 to 400 nm) were measured with the SMPS and their size corresponds to mobility diameter while larger particles were measured using the OPC and sizes correspond to optical diameters. The average EF value and its standard deviation in these plots are derived by taking the average over individual EF values. In the case of all the SMPS measurements and the OPC measurements, there were three series of 20 (Toronto) or 30-min (Jungfraujoch) sampling periods alternating between downstream and upstream of the concentrator, giving rise to three EF values. In the case of the OPC measurements at Toronto, average EF values were determined from the individual simultaneous measurements made over one hour both upstream and downstream of the concentrator, where the time resolution of the OPC is 5 s.
Figure 3. Measured particle EFs for the horizontal and vertical configuration of the PFPC. At Jungfraujoch only the horizontal configuration was available, where characterization measurements at Toronto were taken in both horizontal and vertical configurations. Data obtained from SMPS measurements (mobility diameter) are represented with open symbols and data from OPC measurements (optical diameter) are shown by filled symbols. The horizontal position of each point is the mid-point of the particle diameter bin analyzed. The error bars are standard error of the mean, i.e., one standard deviation. The systematic uncertainty is likely 14%, as calculated from estimated errors in the particle concentrations.
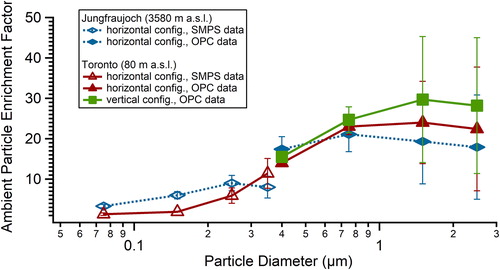
As expected for inertial impactors, there is a strong size dependency of the EFs where large particles are concentrated more efficiently than small particles. Specifically, for the PFPC under both horizontal and vertical configuration and at all altitudes, EFs were highest for particle diameters between 0.4 and 2.5 µm diameter. The EF for the vertical configuration at sea level is 25 ± 6 (uncertainty is one standard deviation) over this diameter range while for the horizontal setup an EF of 21 ± 5 is obtained. At the high-altitude site, the EF for large particles with particle diameters between 0.4 and 2.5 µm is 18 ± 2 for the PFPC operated in horizontal configuration. The higher EFs achieved with the vertical set-up of the PFPC compared to its horizontal configuration are likely due to fewer gravitational losses in the unit when the airflow is directed downward. The variability in the EFs does not arise from variations in flows which are indirectly monitored through pressure readings up and downstream of the concentrator slits. Rather, we believe that it primarily arises when sampling ambient particles from changing concentrations of the particles in the air being sequentially sampled with and without the concentrator.
In general, the behavior of aerosol particles in a gas flow is characterized by their Stokes number (e.g., Seinfeld and Pandis Citation2006; Hinds Citation1999). Particles with large Stokes numbers tend to continue their movement in a straight line, whereas particles having small Stokes numbers tend to follow the gas stream. Since the Stokes number is proportional to the square of the particle diameter, we expect that small particles are less efficiently enriched by the concentrator. This can be seen in the data where for particle diameters below 0.3 µm, the PFPC’s ability for inertial separation is weaker, leading to overall lower EFs than for larger particles at all altitudes (). The Stokes number is also proportional to the Cunningham correction (Seinfeld and Pandis Citation2006; Hinds Citation1999), which in general is increasing with decreasing pressure. This effect should thus lead to better enrichment of small particles at high altitude. We note that at high altitude, particles below 0.3 µm are more enriched than at low altitude. The similar EFs at 250 and 350 nm likely arise from experimental variability.
Ice nucleating particle enrichment factors
For specific times during the campaign, three INP measuring instruments were attached to the PFPC. To quantitatively investigate the comparison of the INP EFs determined from these different instruments, we would ideally account for changes in the number size distribution of the ambient INPs. As this quantity is unknown, we use the full-number size distribution of the ambient particles as a surrogate, i.e., if the particle number size distribution is shifted to larger particle diameters, we hypothesize that both the INP sizes and the measured EFs will be larger too (DeMott et al. Citation2010).
To illustrate the form of the size distribution, we plot the cumulative fraction (CF) of the ambient particle number size distribution using the OPS data measured at the station. The justification for using this data set, which reports particle diameters from 0.3 to 10 µm, is that INPs are generally present in the larger particles. This concept is used for example by DeMott et al. (Citation2010) in the development of a parameterization for INP concentrations in the atmosphere where the number concentrations of particles larger than 0.5 µm diameter are used. Specifically, we define the CFx-y as the fraction of the total particle concentration that is smaller than a specific particle diameter y nm (but larger than diameter x nm). For this work, we choose the diameter y to be 579 nm, i.e., CF300-579, in correspondence with the size criterion used in the DeMott et al. (Citation2010) parameterization. The conclusions we draw below from are the same as for CF300-465 and CF300-721 (see Figures S3 and S4). Number size distributions are shown in Figure S5 in the SI for times when the CF300-579 is above and below 0.95. In particular, contains data over the measurement period from 15–22 January, 2017. Plotted are the INP EFs from the three different INP measurement techniques versus the CF300-579 values. The uncertainties in the plot are one standard deviation values calculated for the vertical axis from the individual uncertainties of the INP measurements and for the horizontal axis from individual OPS measurements. The averaging times for the calculated CF values correspond to the respective measurement periods of the INP instruments and are typically 50 min for HINC data (20 min total inlet followed by 10 min background, and 20 min concentrator) and between 1 and 6 h for FINCH and FRIDGE measurements.
Figure 4. INP EFs determined from measurements with the HINC, FRIDGE, and FINCH instruments plotted against the calculated cumulative fraction (CF300-579) obtained for 579 nm particles from the OPS data. The CF is the fraction of the number size distribution that is smaller than the size specified. For example, a CF300-579 of 0.9 indicates that 90% of the particles for that measurement were 579 nm in diameter or smaller (but larger than 300 nm, the lower size limit of the OPC).
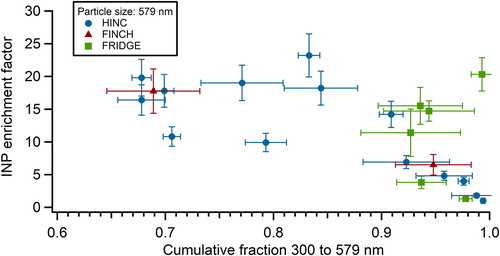
Overall, the data in exhibit expected behavior consistent with the particle-diameter-dependent EF values presented above. Specifically, focusing on the HINC data which are more numerous, it is seen that EFs were smaller when CF300-579 converges to unity (CF300-579 > 0.95), i.e., hence the size distribution is shifted to smaller diameters and 95% of the particles are smaller than the selected threshold of 579 nm. This is consistent with there being few large ice active particles present and most INPs may have diameters below 579 nm. As a result, the INP EF is correspondingly lower. Conversely, when the CF300-579 values are lower, more large particles are present in the airmass. In this condition, for CF300-579 < 0.95, higher EFs are observed with some variability (EF = 16 ± 5).
We note that aside from one FRIDGE data point at high CF300-579 values, the data from the FINCH and FRIDGE instruments show generally the same behavior as those from HINC, which strengthens the finding of being able to infer an INP diameter range from the CFs. This occurs even though the different instruments may be probing different sizes of INPs.
Aerosol mass/composition enrichment factors
Given that there is a particle diameter-dependence to the EFs, it is interesting to evaluate whether there is a compositional change arising in the particles after passing through the concentrator. To evaluate this effect, the C-ToF-AMS and ALABAMA were coupled to the output of the concentrator on one day of measurements. For the C-ToF-AMS, the time series of those measurements is shown in Figure S6 in the SI where the time intervals used to evaluate the C-ToF-AMS EFs were chosen to be 10 min, alternating between ambient air and concentrated air. The four measurements result in two EFs, which are presented in Table S1. By averaging aerosol mass signals arising from the C-ToF-AMS over these periods, the following C-ToF-AMS EFs were measured: 5.4 ± 2.3 for the mass of the organic component and 8.2 ± 1.3 (standard error of the mean, i.e., one standard deviation) for the mass of the sulfate component (see ). Apparently, there is not a large composition dependence in the C-ToF-AMS measurements.
Figure 5. Average enrichment factors for the organic and sulfate components of particles measured with the C-ToF-AMS.
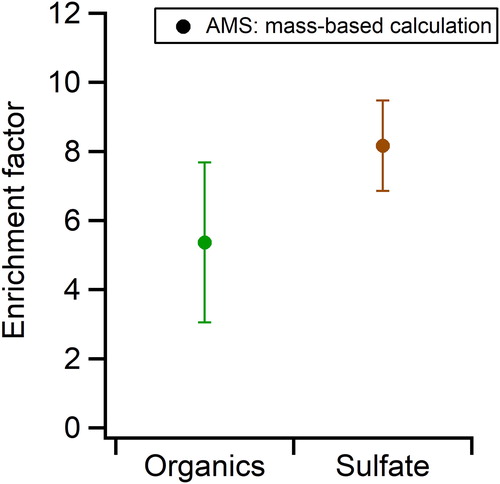
We note that these C-ToF-AMS EFs are smaller than those described above for the INP EFs with low CF300-579 values because the peak in the C-ToF-AMS mass distribution is between 0.3 and 0.4 µm vacuum aerodynamic diameter (see Figure S7 and S8 in the online SI). The INP EFs are of comparable magnitude when CF300-579 is high, i.e., presumably smaller INPs dominate by number under such conditions. The particles are largely organic in composition and thus we assume their density is on the order of 1.2–1.4 g/cm3. In that case, the corresponding peak mobility diameters are between roughly 0.2 and 0.3 µm. The observed particle EF (see ) is somewhere between 5 and 10, i.e., in good agreement with the observations. To within experimental uncertainties, the similarity in the EF values for the sulfate and organics components is consistent with those components being internally mixed within the particles.
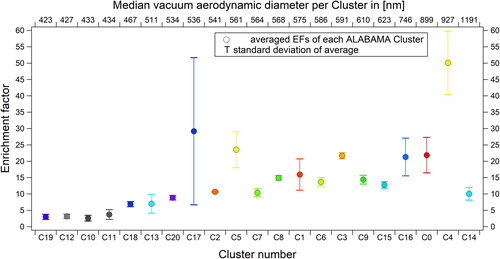
From the ALABAMA instrument, the time periods of measurements are provided in Table S2 and EFs for different particle types (clusters) are illustrated in , where the median vacuum aerodynamic diameter is shown on the upper horizontal axis and the cluster label is given on the lower horizontal axis. It is beyond the scope of this article to discuss the composition of each particle cluster but two clusters, C12 and C0, are discussed in Text S1. Briefly, the mass spectral character for C12 is that of elemental carbon particles that have not experienced considerable atmospheric aging. This is consistent with the size of this cluster being small, 427 nm vacuum aerodynamic diameter. By comparison, C0 particles are larger (899 nm) and have a mixed organic/ammonium sulfate character indicative of atmospheric aging. It is seen that the ALABAMA EFs are dependent to a large degree upon the diameters of the particles with larger EFs generally associated with larger particles. The abundance of each particle cluster as a function of particle diameter is shown in Figure S9. The main point illustrated by is that the EF may be dependent upon the composition of the particle, to the degree that particle composition and size are related to each other.
Figure 6. Enrichment factors measured for individual particle types (clusters) by the ALABAMA instrument. The clusters are ordered according to their median particle diameter from smallest to largest. The size distribution for the clusters is given in Figure S9 in the SI which uses the same colors to identify the clusters; please find the color coded version of this figure in the online version of this publication.
Conclusions
This article describes the first deployment of the PFPC to measure INP abundance in remote regions. For ambient particles of diameters between 0.4 and 2.5 µm, the PFPC has EFs of 18 ± 2 for horizontal operation at high altitude, and 25 ± 6 and 21 ± 5 when operated at sea level in the vertical and horizontal configurations, respectively. EFs for INPs, as measured by the HINC CFDC at a high-altitude site, were 16 ± 5 when the air mass contained higher proportions of larger particles (CF300-579 < 0.95), whereas this value was smaller when the aerosol number size distribution was shifted to small particle diameters (CF300-579 > 0.95). Similar behavior was observed with the FRIDGE and FINCH INP-counting instruments. This significant degree of INP enrichment occurs with only 9.5 hPa pressure drop relative to ambient conditions, indicating that minimal alteration to the composition of individual aerosol particles will occur during concentration. C-ToF-AMS measurements confirm that there is not a statistically significant alteration to the sulfate-to-organic ratios upon concentration. Nevertheless, single particle mass spectrometry measurements by the ALABAMA instrument indicate that the composition of the concentrated flow will be different from the unconcentrated air when viewed across a wide range of particle types, dependent on the diameter of the particles being concentrated. However, for size-resolved composition measurements, the size-dependent enrichment can be corrected such that the initial composition of the aerosol can be determined.
These initial measurements indicate that the PFPC can be profitably applied to field studies to shorten the time required for INP measurements and to improve signal-to-noise ratios. This will be particularly useful for measurements at higher temperatures where the concentrations of INPs are lower, or for measurement locations where INP concentrations are particularly low, e.g., far away from INP source regions. As an example, the LOD of the HINC instrument with unconcentrated aerosol is typically 0.8/L. This value drops to 0.04/L with the use of the PFPC for particles larger than 400 nm in diameter (EF of ∼20). The PFPC is portable and provides 10 LPM of output flow so that several instruments can simultaneously sample from its output. It can be used not only to enhance concentrations of INPs but for composition measurements as well.
We can compare the performance of the PFPC with that of a commercial virtual impactor concentrator (MSP Inc., Model 4240) which was used in prior INP field studies (e.g., Prenni et al. Citation2013; Tobo et al. Citation2013). In particular, the INP EF from these studies is reported to be 103 ± 41, i.e., significantly higher than the value reported here. This is achieved via a comparably large input flow but with an output flow of roughly 1 LPM, i.e., smaller than the 10 LPM value for the PFPC. Both units have characterized the concentration of ambient particles, with the maximum EF for the MSP Inc. unit reached at approximately 1 μm aerodynamic diameter, and the corresponding value for the PFPC is approximately 0.5 μm optical diameter at Jungfraujoch. Both are portable units, but an advantage of the MSP Inc. unit is that it is commercially available, whereas the PFPC is custom fabricated.
We point out that the INP concentration factor was 16 ± 5 when the air mass was characterized by ambient aerosol distributions with CF300-579 < 0.95. This INP EF value needs to be confirmed via additional field campaigns, in particular in varied environmental settings where the size distribution of the INPs may be different. There will be added confidence in the INP concentrations measured using the concentrator if this INP concentration factor in other settings is found to be consistent for this CF300-579 criterion, i.e., presumably there are not a large number of INPs smaller than this particle size.
As a result, for application of the PFPC in future studies, we recommend that air mass aerosol size distributions should be monitored throughout the field campaign in order to derive CF values. This is an easy measurement to implement using widely available optical particle sizing instruments that size down to 300 nm. If the INP concentrations are high, then daily measurements for 30 min to an hour of the non-concentrated INP values are useful, to derive INP EFs. These INP EFs can then be compared to those measured in this work. As well, we recommend that aerosol size-dependent EFs be measured using an OPC and a SMPS up- and downstream of the PFPC, as was done in this study. This is necessary to confirm that the concentrator is working as it should. In clean remote regions, these measurements should be performed once per week for approximately 30 min as the PFPC slits did not show any signs of clogging in clean atmospheric conditions. However, for polluted regions or those with high aerosol loading, we recommend determining the aerosol EF values once daily, again for approximately 30 min.
Data availability
Figure source data for this publication have been deposited in the University of Toronto Dataverse (https://doi.org/10.5683/SP2/DGS2TT).
Supplemental Material
Download MS Word (685.7 KB)Acknowledgments
We acknowledge that the International Foundation High Altitude Research Stations Jungfraujoch and Gornergrat (HSFJG), 3012 Bern, Switzerland made it possible for us to carry out our experiments at the High Altitude Research Station at Jungfraujoch. We acknowledge Nicolas Bukowiecki for providing and discussion of the GAW data.
Additional information
Funding
Related Research Data
References
- Bigg, E. K. 1953. The formation of atmospheric ice crystals by the freezing of droplets. Q. J. R. Meteorol. Soc 79 (342):510–519. doi: 10.1002/qj.49707934207.
- Boose, Y., Z. A. Kanji, M. Kohn, B. Sierau, A. Zipori, I. Crawford, G. Lloyd, N. Bukowiecki, E. Herrmann, P. Kupiszewski, M. Steinbacher, and U. Lohmann. 2016a. Ice nucleating particle measurements at 241 K during winter months at 3580 m MSL in the swiss alps. J. Atmos. Sci. 73 (5):2203–2228. doi: 10.1175/JAS-D-15-0236.1.
- Boose, Y., B. Sierau, M. Isabel Garcia, S. Rodriguez, A. Alastuey, C. Linke, M. Schnaiter, P. Kupiszewski, Z. A. Kanji, and U. Lohmann. 2016b. Ice nucleating particles in the Saharan air layer. Atmos. Chem. Phys. 16 (14):9067–9087. doi: 10.5194/acp-16-9067-2016.
- Boucher, O., D. Randall, P. Artaxo, C. Bretherton, G. Feingold, P. Forster, V.-M. Kerminen, Y. Kondo, H. Liao, U. Lohmann, P. Rasch, S. K. Satheesh, S. Sherwood, B. Stevens, X. Y. Zhang, and X. Y. Zhan. 2013. Clouds and aerosols. Clim. Chang. 2013 Phys. Sci. Basis. Contrib. Work. Gr. I Fifth Assess. Rep. Intergov. Panel Clim. Chang:571–657.
- Brands, M., M. Kamphus, T. Bottger, J. Schneider, F. Drewnick, A. Roth, J. Curtius, C. Voigt, A. Borbon, M. Beekmann, A. Bourdon, T. Perrin, and S. Borrmann. 2011. Characterization of a newly developed aircraft-based laser ablation aerosol mass spectrometer (Alabama) and first field deployment in urban pollution plumes over Paris during MEGAPOLI 2009. Aerosol Sci. Technol. 45 (1):46–64. doi: 10.1080/02786826.2010.517813.
- Budke, C., and T. Koop. 2015. BINARY: an optical freezing array for assessing temperature and time dependence of heterogeneous ice nucleation. Atmos. Meas. Tech. 8 (2):689–703. doi: 10.5194/amt-8-689-2015.
- Bundke, U., B. Nillius, R. Jaenicke, T. Wetter, H. Klein, and H. Bingemer. 2008. The fast ice nucleus chamber FINCH. Atmos. Res. 90 (2–4):180–186. doi: 10.1016/j.atmosres.2008.02.008.
- Canagaratna, M. R., J. T. Jayne, J. L. Jimenez, J. D. Allan, M. R. Alfarra, Q. Zhang, T. B. Onasch, F. Drewnick, H. Coe, A. Middlebrook, A. Delia, L. R. Williams, A. M. Trimborn, M. J. Northway, P. F. DeCarlo, C. E. Kolb, P. Davidovits, and D. R. Worsnop. 2007. Chemical and microphysical characterization of ambient aerosols with the aerodyne aerosol mass spectrometer. Mass Spectrom. Rev. 26 (2):185–222. doi: 10.1002/mas.20115.
- Cziczo, D. J., L. Ladino, Y. Boose, Z. A. Kanji, P. Kupiszewski, S. Lance, S. Mertes, and H. Wex. 2017. Measurements of ice nucleating particles and ice residuals. Meteorol. Monogr. 58:8.1–8.13. doi: 10.1175/AMSMONOGRAPHS-D-16-0008.1.
- Demokritou, P., T. Gupta, S. Ferguson, and P. Koutrakis. 2003. Development of a high-volume concentrated ambient particles system (CAPS) for human and animal inhalation toxicological studies. Inhal. Toxicol. 15 (2):111–129. doi: 10.1080/08958370304475.
- DeMott, P. J., T. C. J. Hill, C. S. McCluskey, K. A. Prather, D. B. Collins, R. C. Sullivan, M. J. Ruppel, R. H. Mason, V. E. Irish, T. Lee, C. Y. Hwang, T. S. Rhee, J. R. Snider, G. R. McMeeking, S. Dhaniyala, E. R. Lewis, J. J. B. Wentzell, J. P. D. Abbatt, C. Lee, C. M. Sultana, A. P. Ault, J. L. Axson, M. Diaz Martinez, I. Venero, G. Santos-Figueroa, M. D. Stokes, G. B. Deane, O. L. Mayol-Bracero, V. H. Grassian, T. H. Bertram, A. K. Bertram, B. F. Moffett, and G. D. Franc. 2016. Sea spray aerosol as a unique source of ice nucleating particles. Proc. Natl. Acad. Sci. 113 (21):5797–5803. doi: 10.1073/pnas.1514034112.
- DeMott, P. J., T. C. J. Hill, M. D. Petters, A. K. Bertram, Y. Tobo, R. H. Mason, K. J. Suski, C. S. Mccluskey, E. J. T. Levin, G. P. Schill, Y. Boose, A. M. Rauker, A. J. Miller, J. Zaragoza, K. Rocci, N. E. Rothfuss, H. P. Taylor, J. D. Hader, C. Chou, J. A. Huffman, U. Pöschl, A. J. Prenni, and S. M. Kreidenweis. 2017. Comparative measurements of ambient atmospheric concentrations of ice nucleating particles using multiple immersion freezing methods and a continuous flow diffusion chamber. Atmos. Chem. Phys. 17 (18):11227–11245. doi: 10.5194/acp-17-11227-2017.
- DeMott, P. J., A. J. Prenni, X. Liu, S. M. Kreidenweis, M. D. Petters, C. H. Twohy, M. S. Richardson, T. Eidhammer, and D. C. Rogers. 2010. Predicting global atmospheric ice nuclei distributions and their impacts on climate. Proc. Natl. Acad. Sci. U. S. A. 107 (25):11217–11222. doi: 10.1073/pnas.0910818107.
- Drewnick, F., S. S. Hings, P. DeCarlo, J. T. Jayne, M. Gonin, K. Fuhrer, S. Weimer, J. L. Jimenez, K. L. Demerjian, S. Borrmann, and D. R. Worsnop. 2005. A new Time-of-Flight Aerosol Mass Spectrometer (TOF-AMS)—instrument description and first field deployment. Aerosol Sci. Technol. 39 (7):637–658. doi: 10.1080/02786820500182040.
- Herrmann, E., E. Weingartner, S. Henne, L. Vuilleumier, N. Bukowiecki, M. Steinbacher, F. Conen, M. Collaud Coen, E. Hammer, Z. Jurányi, U. Baltensperger, and M. Gysel. 2015. Analysis of long-term aerosol size distribution data from Jungfraujoch with emphasis on free tropospheric conditions, cloud influence, and air mass transport. J. Geophys. Res. Atmos. 120 (18):9459–9480. doi: 10.1002/2015JD023660.
- Hinds, W. C. 1999. Aerosol technology – properties, behaviour, and measurements of airborne particles. 2nd ed. New York: Wiley.
- Hoose, C., and O. Möhler. 2012. Heterogeneous ice nucleation on atmospheric aerosols: a review of results from laboratory experiments. Atmos. Chem. Phys. 12 (20):9817–9854. doi: 10.5194/acp-12-9817-2012.
- Kanji, Z. A., L. A. Ladino, H. Wex, Y. Boose, M. Burkert-Kohn, D. J. Cziczo, and M. Krämer. 2017. Overview of ice nucleating particles. Meteorol. Monogr. 58:1.1–1.33. doi: 10.1175/AMSMONOGRAPHS-D-16-0006.1.
- Korolev, A., G. McFarquhar, P. R. Field, C. Franklin, P. Lawson, Z. Wang, E. Williams, S. J. Abel, D. Axisa, S. Borrmann, J. Crosier, J. Fugal, M. Krämer, U. Lohmann, O. Schlenczek, and M. Wendisch. 2017. Ice formation and evolution in clouds and precipitation: Measurement and modeling challenges. Chapter 5: Mixed-phase clouds: progress and challenges. Meteorol. Monogr. 1724 (Fahrenheit 1724):AMSMONOGRAPHS-D-17-0001.1.
- Lacher, L., P. J. DeMott, E. J. T. Levin, K. J. Suski, Y. Boose, A. Zipori, E. Herrmann, N. Bukowiecki, M. Steinbacher, E. Gute, J. P. D. Abbatt, U. Lohmann, and Z. A. Kanji. 2018. Background Free-Tropospheric ice nucleating particle concentrations at mixed-phase cloud conditions. J. Geophys. Res. Atmos. 123 (18):10,506–10,525. doi: 10.1029/2018JD028338.
- Lacher, L., U. Lohmann, Y. Boose, A. Zipori, E. Herrmann, N. Bukowiecki, M. Steinbacher, and Z. A. Kanji. 2017. The horizontal ice nucleation chamber (HINC): INP measurements at conditions relevant for mixed-phase clouds at the high altitude research station Jungfraujoch. Atmos. Chem. Phys. 17 (24):15199–15224. doi: 10.5194/acp-17-15199-2017.
- Liu, P., P. J. Ziemann, D. B. Kittelson, and P. H. McMurry. 1995. Generating particle beams of controlled dimensions and divergence: I. Theory of particle motion in aerodynamic lenses and nozzle expansions. Aerosol Sci. Technol. 22 (3):293–313. doi: 10.1080/02786829408959748.
- Loo, B. W., and C. P. Cork. 1988. Development of high efficiency virtual impactors. Aerosol Sci. Technol. 9 (3):167–176. doi: 10.1080/02786828808959205.
- McCluskey, C. S., T. C. J. Hill, R. S. Humphries, A. M. Rauker, S. Moreau, P. G. Strutton, S. D. Chambers, A. G. Williams, I. McRobert, J. Ward, M. D. Keywood, J. Harnwell, W. Ponsonby, Z. M. Loh, P. B. Krummel, A. Protat, S. M. Kreidenweis, and P. J. DeMott. 2018. Observations of ice nucleating particles over Southern ocean waters. Geophys. Res. Lett. 45 (21):11,989–11,997. doi: 10.1029/2018GL079981.
- McCluskey, C. S., T. C. J. Hill, F. Malfatti, C. M. Sultana, C. Lee, M. V. Santander, C. M. Beall, K. A. Moore, G. C. Cornwell, D. B. Collins, K. A. Prather, T. Jayarathne, E. A. Stone, F. Azam, S. M. Kreidenweis, and P. J. DeMott. 2017. A dynamic link between ice nucleating particles released in nascent sea spray aerosol and oceanic biological activity during two mesocosm experiments. J. Atmos. Sci. 74 (1):151–166. doi: 10.1175/JAS-D-16-0087.1.
- Mülmenstädt, J., O. Sourdeval, J. Delanoë, and J. Quaas. 2015. Frequency of occurrence of rain from liquid-, mixed-, and ice-phase clouds derived from A-Train satellite retrievals. Geophys. Res. Lett. 42 (15):6502–6509. doi: 10.1002/2015GL064604.
- Prenni, A. J., P. J. Demott, D. C. Rogers, S. M. Kreidenweis, G. M. McFarquhar, G. Zhang, and M. R. Poellot. 2009. Ice nuclei characteristics from M-PACE and their relation to ice formation in clouds. Tellus, Ser. B Chem. Phys. Meteorol. 61B (2):436–448. doi: 10.1111/j.1600-0889.2009.00415.x.
- Prenni, A. J., Y. Tobo, E. Garcia, P. J. DeMott, J. A. Huffman, C. S. McCluskey, S. M. Kreidenweis, J. E. Prenni, C. Pöhlker, and U. Pöschl. 2013. The impact of rain on ice nuclei populations at a forested site in Colorado. Geophys. Res. Lett. 40 (1):227–231. doi: 10.1029/2012GL053953.
- Pruppacher, H. R., and J. D. Klett. 1997. Mircophysics of clouds and precipitation. 2nd ed. Dordrecht, The Netherlands: Kluwer Academic Publishers,.
- Rogers, D. C., P. J. DeMott, and S. M. Kreidenweis. 2001. Airborne measurements of tropospheric ice-nucleating aerosol particles in the arctic spring. J. Geophys. Res. Atmos. 106 (D14):15053–15063. doi: 10.1029/2000JD900790.
- Saarikoski, S., S. Carbone, M. J. Cubison, R. Hillamo, P. Keronen, C. Sioutas, D. R. Worsnop, and J. L. Jimenez. 2014. Evaluation of the performance of a particle concentrator for online instrumentation. Atmos. Meas. Tech. 7 (7):2121–2135.
- Schmidt, S., J. Schneider, T. Klimach, S. Mertes, L. P. Schenk, P. Kupiszewski, J. Curtius, and S. Borrmann. 2017. Online single particle analysis of ice particle residuals from mountain-top mixed-phase clouds using laboratory derived particle type assignment. Atmos. Chem. Phys. 17 (1):575–594. doi: 10.5194/acp-17-575-2017.
- Schrod, J., A. Danielczok, D. Weber, M. Ebert, E. S. Thomson, and H. G. Bingemer. 2016. Re-evaluating the frankfurt isothermal static diffusion chamber for ice nucleation. Atmos. Meas. Tech. 9 (3):1313–1324. doi: 10.5194/amt-9-1313-2016.
- Seinfeld, J. H., and S. N. Pandis. 2006. Atmospheric chemistry and physics: from air pollution to climate change. 2nd ed. New York: Wiley.
- Sioutas, C., P. Koutrakis, S. T. Ferguson, and R. M. Burton. 1995. Development and evaluation of a prototype ambient particle concentrator for inhalation exposure studies. Inhal. Toxicol. 7 (5):633–644. doi: 10.3109/08958379509014470.
- Suski, K. J., T. C. J. Hill, E. J. T. Levin, A. Miller, P. J. Demott, and S. M. Kreidenweis. 2018. Agricultural harvesting emissions of ice nucleating particles. Atmos. Chem. Phys. 18 (May):13755–13771: doi: 10.5194/acp-18-13755-2018.
- Tobo, Y., A. J. Prenni, P. J. Demott, J. A. Huffman, C. S. McCluskey, G. Tian, C. Pöhlker, U. Pöschl, and S. M. Kreidenweis. 2013. Biological aerosol particles as a key determinant of ice nuclei populations in a Forest ecosystem. J. Geophys. Res. Atmos. 118 (17):10100–10110.
- Vali, G., P. J. DeMott, O. Möhler, and T. F. Whale. 2015. Technical note: a proposal for ice nucleation terminology. Atmos. Chem. Phys. 15 (18):10263–10270. doi: 10.5194/acp-15-10263-2015.
- Von Der Weiden, S. L., F. Drewnick, and S. Borrmann. 2009. Particle loss calculator – a new software tool for the assessment of the performance of aerosol inlet systems. Atmos. Meas. Tech 2 (2):479–494. doi: 10.5194/amt-2-479-2009.
- Weingartner, E., S. Nyeki, and U. Baltensperger. 1999. Seasonal and diurnal variation of aerosol size distributions (10<D<750 nm) at a high-alpine site (Jungfraujoch 3580 m asl). J. Geophys. Res. Atmos. 104 (D21):26809–26820.
- Zellweger, C., J. Forrer, P. Hofer, S. Nyeki, B. Schwarzenbach, E. Weingartner, M. Ammann, and U. Baltensperger. 2003. Partitioning of reactive nitrogen (NOy) and dependence on meteorological conditions in the lower free troposphere. Atmos. Chem. Phys. 3 (3):779–796. doi: 10.5194/acp-3-779-2003.