
 ?Mathematical formulae have been encoded as MathML and are displayed in this HTML version using MathJax in order to improve their display. Uncheck the box to turn MathJax off. This feature requires Javascript. Click on a formula to zoom.
Abstract
High-performance air filters composed of a hybrid structure of nanofiber/microfiber were fabricated using wet paper processing. Two types of nanofibers (NF) with average diameters of 180 and 234 nm were mixed with a suspension of microfibers (11.5 and 11.7 µm) in various mixing fractions. Then, the suspension was filtered to fabricate hybridized fiber sheets with a known nanofiber/microfiber composition. The effects of NF diameter and mixing fraction on the performance of the hybrid filters were experimentally investigated. With increasing NF fraction, both the particle collection efficiency and the pressure drop increased. The quality factor (Qf) was used to evaluate the performance of the prepared filters. As predicted by the single fiber filtration theory, the experimentally obtained Qf was almost independent of the mixing fraction of the NF. The collection efficiency and pressure drop of the hybrid filters could be controlled by the NF fraction at the same Qf. Moreover, the inhomogeneity factor of fiber packing (δ) did not significantly affect Qf over the δ range from 3 to 23 for our filters. This implies that the lower particle capturing efficiency due to heterogeneous packing could be compensated by a decrease in the pressure drop, resulting in the same Qf value. Therefore, Qf for particles smaller than 100 nm, which are in the diffusion-controlled regime, can be increased by reducing the NF diameter.
Copyright © 2019 American Association for Aerosol Research
EDITOR:
1. Introduction
Recent progress in the manufacturing of nanofibers (NFs) has led to their application as air filtration media (Choi et al. Citation2017). According to the single fiber collection efficiency theory (Kirsch and Stechkina Citation1978), filters composed of fibers with smaller diameters should have higher collection efficiencies due to enhanced capture of particles via the interception mechanism. In addition, the discontinuity of fluid motion near the fiber surface is favorable for reducing the pressure drop across the media by slip flow effects. Thus, the use of NFs as a filter material is expected to be promising for developing the next generation of high-performance air filters. The application of NF filters to air filtration has been investigated by several research groups. Wang, Kim, and Pui (Citation2008) calculated the figure of merit for various NF-composite filters. Yun et al. (Citation2010) reported that the filter performance could be improved by laminating polyacrylonitrile (PAN) NFs made by electrostatic spinning on the surface of microfibers (MFs). Purwar, Goutham, and Srivastava (Citation2016) prepared sericin/poly vinyl alcohol (PVA)/clay (Cloisite 30B) nanofibrous (300–400 nm) mats by electrospinning without beads. Bao et al. (Citation2016) experimentally demonstrated that the slip flow effect of the NFs reduces the pressure drop across the filter. Gu et al. (Citation2017) developed a high-efficiency air filter system by enhancing the removal of particulate matter from a polyimide (PI) NF filter using a rotating triboelectric nanogenerator in ambient atmosphere. However, the specific factors affecting the filtration performance have not yet been clarified in the abovementioned studies.
The filter quality factor, Qf [Pa−1], is a widely used index that represents the initial filter performance, and is given by:
(1)
(1)
where P [−] is the particle penetration (P = 1 − E, where E is the collection efficiency) and Δp [Pa] is the pressure drop over the filter media. Qf is a widely used indicator for filtration performance, and it is usually less than 0.03 for conventional HEPA filters (for example, Qf = 0.027 for P = 0.0003 and Δp = 300 Pa). Filters with higher Qf values have better performance due to a lower pressure drop, i.e., lower energy consumption for the same collection efficiency. To date, a PAN NF (36.5–300 nm) laminated filter material has shown a Qf > 0.05 Pa−1 for filtering 100-nm monodispersed sodium chloride (NaCl) (Balgis et al. Citation2015), while Qf = 0.06 Pa−1 was obtained for 300-nm polyalphaolefin (PAO) droplets filtered by polytetrafluoroethylene (PTFE) NFs (Bao et al. Citation2016). Currently, NF composite filter media is limited to a few applications due to the high cost of manufacturing NF filters made of expensive ingredients polymers (PAN or PTFE).
In addition, pure NF layers, used in the form of laminated or coated filters, result in high pressure drops due to the high packing density (>0.1) of the fibers. Such high-density packing results in a shorter filter life against dust loading, and lower quality of filtration because of packing inhomogeneities. Therefore, we propose that NF/MF filters could be a better solution that can take advantage of a three-dimensional network of single NFs.
In the present work, we used wet paper processing to fabricate hybrid NF/MF structures with controlled weight fractions. This conventional method was chosen because it is a well-investigated and effective process for producing fiber sheets. The effects of fiber diameter, weight fraction, and inhomogeneity factor of fiber packing (δ) on Qf were investigated in order to elucidate the main factors determining the filtration performance of the NF/MF hybrid air filters.
2. Experimental
2.1. Preparation of NF/MF hybrid filter
lists the geometrical properties of the fibers used in this study. Two types of glass NF, labeled NF-a and NF-b, with geometric mean diameters of 151 and 195 nm, respectively, were mixed with glass MFs (11.7 µm diameter) and PVA MFs (11.5 µm diameter) in a water solution. Wet paper processing is a widely used method for industrial paper production and involves dispersion, dehydration, water squeezing, and drying processes. Unlike deposition processes for producing NF films, such as electrospinning, three-dimensional hybrid structures can be formed during the drying step of paper processing using well-mixed NF/MF dispersions. In the present study, a laboratory-scale paper processing apparatus was used based on the Japanese Industrial Standard (JIS) P-8222 (Citation2005) (). Briefly, a premixed fiber slurry (NF/MF mixture in water) with a concentration of about 0.02 wt.% was supplied to a 7 L cylinder (158 mm in diameter and 350 mm in height). The suspension was thoroughly stirred using a porous plate to obtain a well-dispersed suspension. A stainless steel screen (150 mesh) was placed in the bottom of the cylinder. During the dehydration process, water was discharged quickly (over ∼5 s) through the mesh while the fibers accumulated on the surface of the screen. Then, a roller was used to press the wet filter sheet to squeeze excess water out of the sheet. Finally, the sheet was removed from the screen and dried at 80–150 °C to remove moisture remaining in fiber sheet and immobilize the fibers.
Figure 1. Schematic of laboratory-scale paper production process based on the Japanese Industrial Standard JIS-P8222 (Citation2005).
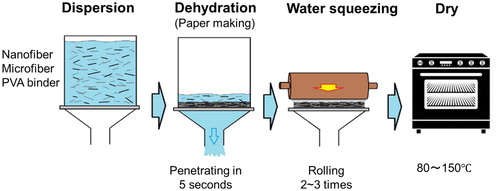
Table 1. Nanofiber geometrical properties.
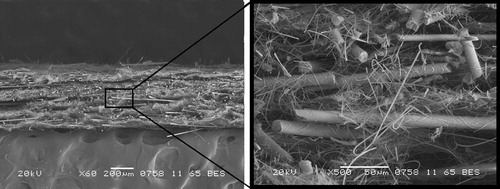
Unlike standard papermaking processes, it is important to produce media with a appropriate packing density (less than 10%), isolating individual nanofibers in the filter matrix in order to effectively capture aerosol particles. Meanwhile, sufficient NF-MF and MF-MF inter-bonding is also important to ensure mechanical strength of the filter media. For this reason, hydrophilic PVA polymer MFs (weight fraction of 20%) were used as a binder. The temperature of the drying process was carefully chosen to partially melt the surface of the PVA to fix the glass NFs and MFs. shows a typical scanning electron microscopy (SEM) image of the prepared filter media composed of 30% NF-a. It can be seen that the NFs were uniformly dispersed throughout the cross-section of the filter. In addition, the MFs formed the skeleton of the structure, with the NFs bridging the gaps between the MFs.
Figure 2. SEM micrograph of NF-a (30%)/MF composite filter.
The geometric standard deviation of the fibers (σg [−]) was measured from the SEM images to determine the variance of the fiber diameter (σ [−]), as shown in . The σg value of the fiber diameter was about 1.8, while σ was 0.5–0.6. The mean fiber diameters of 180 nm and 234 nm for NF-a and -b, respectively, were used for calculating the filter performance.
The weight fraction of the NFs was varied from 1% to 30% for both NF-a and -b by changing the mixing fraction of the water suspension. It should be noted that, with an increase in NF fraction, the thickness of the filter media slightly decreases from 400 to 300 µm; however, the packing density (α [−]) was almost constant (0.06–0.08), suggesting that the MFs successfully formed the skeleton of the structure. In other words, the physical properties of the filter media, such as α, did not change significantly with the mixing fraction. Therefore, we used α = 0.06 to calculate the theoretical filtration efficiency.
2.2. Filtration performance of NF/MF hybrid filter
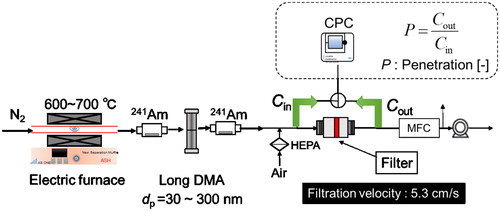
shows the experimental setup used in this study. NaCl test particles with a mobility diameter from 30 to 200 nm were generated using an evaporation–condensation aerosol generator. Average diameter of the test aerosol was controlled from about 40 to 100 nm by changing the evaporation temperature from 600 to 700 °C to obtain enough number concentration of test aerosol for filtration experiments. The NaCl particles were electrically charged and classified using a differential mobility analyzer. Then, the electric charge of the classified particles was neutralized by passing them through another neutralizer. The prepared hybrid filter sheet was cut to form a circular filter and mounted in a filter holder (inner diameter of 40 mm). The particle concentrations upstream and downstream of the test filter were measured using a condensation particle counter (CPC, TSI model 3775). The collection efficiency was measured by determining the penetration of the filter with changing particle size for a fixed filter face velocity of 5.3 cm s−1. The pressure drop of the filter was measured using a manometer.
Figure 3. Experimental setup for measuring the pressure drop and penetration of the test filter (DMA: differential mobility analyzer, CPC: condensation particle counter, and MFC: mass flow controller).
3. Results
3.1. Pressure drop and inhomogeneity factor
shows the pressure drop of the test filter as a function of mixing fraction of the NFs (x). It can be seen that the experimental pressure drop (solid circles) increased with mixing fraction, but not linearly. The lines in represent the theoretical pressure drop calculated using the Fan model filter (FMF), Δpf, as follows:
(2)
(2)
where, Ff [−], u [m s−1], μ [Pa s], l [m−1], L [m], and f(α) [−] are the drag force, media face velocity, air viscosity, fiber length at unit area of the filter media, thickness of the media, and hydrodynamic factor, respectively. The contributions of both NF and MF on the pressure drop of hybrid filter were calculated as Δpf = ΔpfNF + ΔpfMF, where ΔpfNF and ΔpfMF are pressure drop of NF and MF, respectively. However, the contribution of MF on the pressure drop of hybrid filter is very small (less than 1%). The effect of NF-mixing ratio, x on the pressure drop was considered in the calculation of the packing density of NF, αNF (= αx). The effect of slip was also taken into account in the calculation of hydrodynamic factor, f (α), which is a function of Knudsen number, Kn. When fibers in a real filter are not packed uniformly, the pressure drop (Δpr) decreases due to flow channeling through the filter. Kirsch and Stechkina (Citation1978) defined the inhomogeneity factor (δ) as the ratio of the pressure drop of a Fan model filter to that of a real filter:
(3)
(3)
where Kn [−] is Knudesen number. The various solid lines in are the predicted pressure drops with various δ values. For example, the pressure drop of the real filter composed of 10% NF-a was 1/4 of that of the Fan model filter (δ = 4). lists the δ values for NF-a and NF-b filters. Both the table and figure show that δ of both filters decreased with increasing mixing fraction; therefore, more uniform filters were fabricated with higher NF contents. In addition, the δ values of NF-b were higher than those of NF-a, probably because the number of fibers is proportional to the inverse square of the NF-diameter (
); hence, NF-a had ∼1.7 times the number of fibers of NF-b.
Figure 4. Pressure drops of the tests filters as a function of mixing fraction.
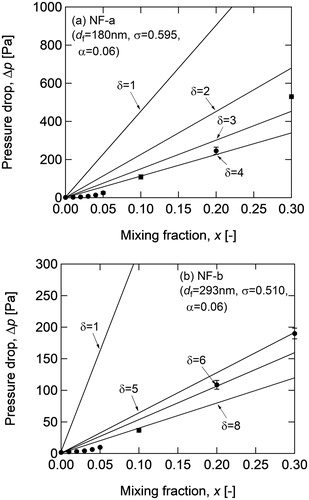
Table 2. Pressure drop and inhomogeneity factor of the mixed filter (α = 0.06, u = 0.053 m s−1).
3.2. Collection efficiency of the hybrid filters
shows the penetration of the hybrid filters plotted against the mobility diameter. It should be noted that the experimental data for the mixing fraction of 30% NF-a have low reliability due to the very low penetration (<10−6). Other data for particle diameters less than 100 nm showed behavior reasonably consistent with a Brownian diffusion limited mechanism where penetration decreases with decreasing particle size. The solid lines in were calculated using single fiber filtration theory assuming a bimodal distribution of fiber diameter (Bao et al. Citation1998), as given by:
(4)
(4)
where, df1, df2, l1, and l2 are the fiber diameter (d) and fiber length (l) of the NF (1) and MF (2), respectively. In the calculation of P, the value of δ (which determines particle capture) is assumed to be the same as the value of δ measured from the pressure drop (Kirsch and Stechkina Citation1978).
Figure 5. Penetration of the nanofiber mixed filters, (a) NF-a and (b) NF-b, as a function of particle diameter. The inhomogeneity factor of the fiber packing (δ) was used to calculate the theoretical curves (solid lines).
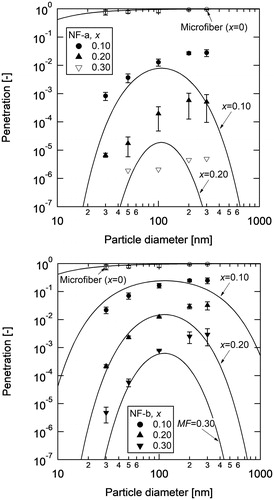
As seen in , the predicted curves are in quite good agreement with the experimental penetration for particles smaller than 100 nm (diffusion-controlled regime), except for the hybrid filter with 30% NF-a (near the detection limit). On the other hand, the experimental data for particle diameters of 200 and 300 nm did not decrease with increasing particle size as interception did not occur (as predicted by filtration theory). This discrepancy was seen for filters with different mixing fractions and fiber diameters. A possible reason may be the reduced adhesion on the glass NFs of particles with a diameter close to or larger than the fiber diameter. Near the most penetrating particle size (MPPS), none of the filtration mechanisms (diffusion, interception, or inertia) effectively occurred to achieve particle capture. Therefore, particles with a diameter similar to that of the fiber collided with the nanofiber surface, but the particles may rebound or not be captured by the fiber surface due to the small van der Waals forces. Such a tendency was not observed for PTFE NF membranes (Bao et al. Citation2016). Therefore, further investigation is necessary, which should consider the sticking probability of the particles.
3.3. Effects of df and δ on the quality factor
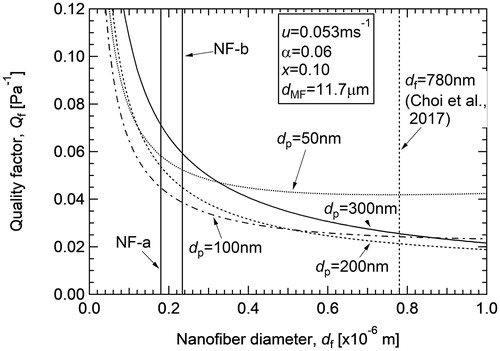
Although some experimental penetration data were not modeled using the theory, we were able to fabricate a variety of hybrid filters with different mixing fractions, fiber diameters, and δ values. In a next step, the performance of the hybrid filter was evaluated using Qf. shows calculated Qf values as a function of fiber diameter for δ = 1 and σ = 0. The predicted curves did not depend significantly on the mixing fraction (which was set to 0.1). It can be seen that reducing the fiber diameter effectively enhances filter performance, particularly when df is smaller than the particle diameter. The fiber diameter used in our previous study (Choi et al. Citation2017; PET NF with a diameter of 780 nm) is indicated by the vertical dashed line. According to the fiber diameter, the Qf values of NF-a (180 nm) and NF-b (234 nm) were expected to be much higher than those of previously studied filters (almost double).
Figure 6. Calculated quality factor of the NF/MF mixed filter as a function of NF diameter. Dispersion of fiber diameter, σ, and inhomogeneity of the fiber packing, δ, were set to 0 and 1, respectively.
compares our experimental data for Qf (data points) and the theoretical predictions (lines). Here, δ was set to unity for calculating the theoretical lines. The theoretical curves for mixing fractions of 0.1, 0.2, and 0.3 almost overlapped; hence, the mixing fraction had a minor effect on Qf, as mentioned above.
Figure 7. Comparison of the experimental and theoretical quality factor values of the nanofiber mixed filters, (a) NF-a and (b) NF-b, as a function of particle diameter. The inhomogeneity factor of the fiber packing, δ, was set to 1 for the calculations.
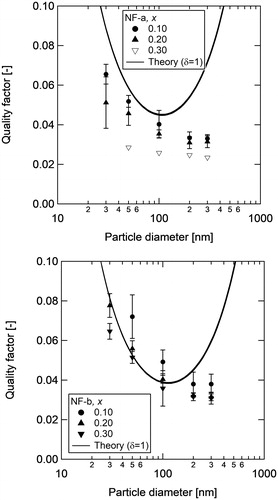
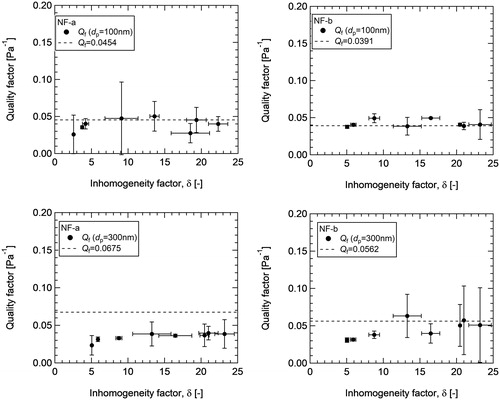
To investigate the effect of δ on Qf, shows experimental Qf values for the 100- and 300-nm particles plotted against δ for various filter composition. It can be seen that δ did not significantly affect Qf over our experimental range (δ < 23). Hence, the reduction of the collection efficiency was compensated by the lower pressure drop. Therefore, the filter grade, e.g., medium performance to ultrahigh performance, can be controlled simply by changing the weight fraction of the NFs at the same Qf value. As can be seen in , the experimental Qf values for the 300-nm particles were lower than those predicted by the theory as a result of the low collection efficiency of particles larger than the fiber diameter. However, this discrepancy was smaller for the larger fibers, NF-b, than NF-a. This tendency may support our hypothesis that particles larger than fiber diameter near the MPPS had poorer adhesion with the NF.
Figure 8. Quality factor (Qf) of the NF/MF mixed filters plotted against inhomogeneity factor of the fiber packing (δ). The broken lines show the theoretical values of Qf.
4. Conclusions
High-performance air filters composed of NF/MF hybrid materials were successfully fabricated using wet paper processing. Although the fabricated filters showed large δ values, the Qf values of the filters were mostly independent of the mixing fraction, packing density, and δ for our experimental conditions. Hence, the NFs were well dispersed over the filter layer, where a fraction of the NFs both captured particles and provided resistance to the fluid. The hybrid filters exhibited high performance with Qf = 0.043 for NF-a and 0.039 for NF-b for filtering 100-nm particles. Further investigation of the unexpected decrease in Qf when the particle diameter exceeds the fiber diameter is required, which is important for the industrial application of NF filters.
Additional information
Funding
Related Research Data
References
- Balgis, R., C. W. Kartikowati, T. Ogi, L. Gradon, L. Bao, K. Seki, and K. Okuyama. 2015. Synthesis and evaluation of straight and bead-free nanofibers for improved aerosol filtration. Chem. Eng. Sci. 137:947–954. doi: 10.1016/j.ces.2015.07.038.
- Bao, L., Y. Otani, N. Namiki, J. Mori, and H. Emi. 1998. Prediction of HEPA filter collection efficiency with a bimodal fiber size distribution. Kagaku Kogaku Rombunshu 24 (5):766–71. doi: 10.1252/kakoronbunshu.24.766.
- Bao, L., K. Seki, H. Niinuma, Y. Otani, R. Balgis, T. Ogi, L. Gradon, and K. Okuyama. 2016. Verification of slip flow in nanofiber filter media through pressure drop measurement at low-pressure conditions. Sep. Purif. Technol. 159:100–7. doi: 10.1016/j.seppur.2015.12.045.
- Choi, H., M. Kumita, S. Hayashi, H. Yuasa, M. Kamiyama, T. Seto, C. Tsai, and Y. Otani. 2017. Filtration properties of nanofiber/microfiber mixed filter and prediction of its performance. Aerosol Air Qual. Res. 17 (4):1052–62. doi: 10.4209/aaqr.2016.06.0256.
- Gu, G. Q., C. B. Han, C. X. Lu, C. He, T. Jiang, Z. L. Gao, C. J. Li, and Z. L. Wang. 2017. Triboelectric nanogenerator enhanced nanofiber air filters for efficient particulate matter removal. ACS Nano 11 (6):6211–7. doi: 10.1021/acsnano.7b02321.
- Japanese Industrial Standard (JIS) P-8222. 2005. Pulps - Preparation of laboratory sheets for physical testing - Conventional sheet-former method.
- Kirsch, A. A., and I. B. Stechkina. 1978. The theory of aerosol filtration with fibrous filters. In Fundamentals of aerosol science, ed. D. T. Shaw, 165–256. New York: John Wiley & Sons.
- Purwar, R., K. S. Goutham, and C. M. Srivastava. 2016. Electrospun sericin/PVA/clay nanofibrous mats for antimicrobial air filtration mask. Fibers Polym. 17 (8):1206–16. doi: 10.1007/s12221-016-6345-7.
- Wang, J., S. C. Kim, and D. Y. H. Pui. 2008. Figure of merit of composite filters with micrometer and nanometer fibers. Aerosol Sci. Technol. 42 (9):722–8. doi: 10.1080/02786820802249133.
- Yun, K., A. Suryamas, F. Iskandar, L. Bao, H. Niinuma, and K. Okuyama. 2010. Morphology optimization of polymer nanofiber for applications in aerosol. Sep. Purif. Technol. 75 (3):340–5. doi: 10.1016/j.seppur.2010.09.002.