?Mathematical formulae have been encoded as MathML and are displayed in this HTML version using MathJax in order to improve their display. Uncheck the box to turn MathJax off. This feature requires Javascript. Click on a formula to zoom.
Abstract
A new design of a Differential Mobility Analyzer (DMA) was tested with medium aerosol flow rates ranging from 1.5 to 10 slm and high-density particles. The vacuum-tight construction makes it possible to classify pure metal nanoparticles from production processes. The selectable electrical mobility range is comparable to the TSI Long and Nano DMA and covers the full nanometer scale from 15–600 nm. The Medium Flow-DMA (MF-DMA) is characterized by its transfer function, which was determined by a tandem DMA setup using a SMPS with Long DMA downstream. Silver nanoparticles with a density of 10.49 g cm−3 were used to demonstrate the size-selecting performance of high-density particles. The transfer function was calculated for aerosol to sheath gas flow ratios of 1/10, 1/5, and 1/3 directly from the SMPS data by a new method using modeling approach and comparison to the theory. Sufficiently high resolution was reached by increasing the SMPS scan time of the classified size distribution to 300 s. During the investigation, a broadened transfer function could be attributed to an inhomogeneous flow field resulting from the aerosol inlet design. The aerosol inlet of the MF-DMA was optimized by the number of inlet drillings and the opening of the inlet slit to achieve a more homogeneous flow field. CFD simulations of the MF-DMA also confirmed this. The modification improved the transfer function especially for medium aerosol flow rates above 5 slm.
Copyright © 2019 American Association for Aerosol Research
Editor:
1. Introduction
Differential Mobility Analyzers (DMA) are valuable instruments for classifying a polydisperse aerosol into particle size classes on the basis of their electrical mobility. The operation principle bases on the deflection of charged aerosol particles in an electrical field according to their particle size, level of electrical charge and properties of the gas environment. High-resolution classification can be performed in the submicron particle range, depending on the DMA design and the flow rates.
The broad application range of nanoparticles, especially with defined sizes (Kruis, Fissan, and Peled Citation1998), increases the interest in classifying these particles by means of a DMA. Cylindrical, radial, and parallel plate DMA designs have been optimized for a range of applications. Since the development of the first cylindrical DMA by Hewitt (Citation1957), many publications have focused on the optimization of its’ transfer function by adapting the design of DMAs for different gas flow rates. Rosser and Fernández de la Mora (Citation2005) have shown an approach to optimize the cylindrical DMA for small particles at high flow rates. They applied a converging flow, thus enabling classification with Reynolds numbers up to 20,000 and sheath gas flow rates up to 4000 slm. The high gas flow rate leads to short residence time in the classification zone in which particles between 1 and 100 nm can be classified. A disadvantage of this approach is that ambient air is used as sheath gas flow, drawn in the DMA by a vacuum pump. Operation under a controlled gas atmosphere is sometimes required to avoid particle–gas interaction, such as the oxidation of pure metal nanoparticles. Steiner et al. (Citation2010) reduced the sheath gas flow rate to 280 and 700 slm by using a closed loop arrangement to better control the sheath gas composition. A combination of both approaches into a single DMA is the High Flow-DMA (HF-DMA) from Hontañón and Kruis (Citation2009). It is designed for the lower size range of nanoparticles using high flow rates, with an aerosol flow rate up to 100 slm and a sheath flow rate up to 1000 slm, comparable to Steiner et al. (Citation2010). A high aerosol flow rate can be useful when additional online instrumentation is needed for comprehensive aerosol characterization (Babick et al. Citation2018), calibration measurements are required, or monodisperse aerosols have to be provided to production processes.
One range of applications requires the classification of larger (but still submicron) and high-density particles. In particular, size-selected gold nanoparticles are required in various applications due to their good catalytic effect. Heurlin et al. (Citation2012) developed a method for the one-dimensional growth of GaAs nanowires onto highly crystalline gold nanoparticles in the gas phase. The gold particle size is a sensitive parameter for controlling the nanowire shape. In biomedicine, the well-studied interaction of organic functionalized groups with the gold surface is exploited to produce functionalized gold nanoparticles, e.g., for selective drug delivery and for biomedicine imaging. Functionalization of gold nanoparticles with thiol for gas-phase gene transfection has already been demonstrated by Byeon and Roberts (Citation2012). The gas-phase production of gold nanoparticles has proven to be an efficient and scalable process for a wide range of functionalized nanobiomaterials.
Unfortunately, not much effort has been put into investigating and optimizing the transfer function for large and heavy particles. One reason for this might be that a compromise between selectable size range and residence time of the particles in the classification zone have to be found. A DMA prototype with longer residence time by extending the classification length to 1200 mm was demonstrated by Uin, Tamm, and Mirme (Citation2009). As a result, PSL particles up to 1 µm in a sheath gas flow rate of 29 slm could be theoretically classified. The commercially available Long DMA (Model 3081, TSI, MN, US) can classify particle sizes up to 700 nm with an aerosol to sheath gas ratio of 0.3/3 slm. When operating this DMA with a gas flow ratio of 1.5/15 slm, the maximum achievable particle size drops to 200 nm.
However, these DMAs have not been designed for particles of high density such as gold, so high particle losses by impaction can be expected. Impaction losses are dependent on the stopping distance of the particles, which is proportional to the particle density. When the stopping distance of the particles is of the same order of magnitude as a characteristic instrument dimension such as a bend or orifice size, impaction losses are expected to occur. The minimization of impaction losses places particularly high demands on the aerosol inlet and outlet geometry of the DMA, as here small orifices and bends are present.
In this work, a DMA was designed to classify particle diameters from 15 to 600 nm in an aerosol flow rate of 1.5 slm and sheath gas flow rate of 15 slm. The DMA aerosol inlet was optimized taking also possible aerosol flow rates up to 10 slm into account. The primary goal of this design is to minimize particle losses for high-density particles such as gold. Therefore, a CFD model of the DMA was used to simulate the flow field, calculate the transfer function and to compare it with experiments. Usually, the transfer function of a DMA is determined by a method which requires two DMA prototypes or at least one DMA with known transfer function in a Tandem DMA setup (Stratmann et al. Citation1997). To avoid the fabrication of a second prototype, a new method for determining the transfer function of a DMA was developed, using two continuous scanning SMPS systems containing DMAs with known transfer function. This allowed the experimental evaluation of the transfer function of the DMA developed in this work, which is named Medium Flow-DMA (MF-DMA).
2. Design considerations
2.1. Size range
The MF-DMA aims at providing a monodisperse aerosol in the range 15–600 nm at a medium flow rate of the aerosol (up to 10 slm). A previous study of a DMA having medium flow rates focused on the lower nanometer range, especially 1–5 nm (Steiner et al. Citation2010), where diffusion losses play a major role. In contrast, as one of the applications here is to provide size-selected metallic particles, the instrument should show minimal losses of high-density particles at the upper end of the size range. For these relatively large and heavy particles, their large relaxation times can lead to particle losses due to impaction in the in- and outlet sections of the DMA, so that these sections have to be optimized. In this work, an inverted cylindrical DMA design similar to an earlier high flow DMA (Hontañón and Kruis Citation2009) with an easily exchangeable classification zone was chosen. The inverted design was selected as it has been proven to be the most economical construction for large vacuum-tight components.
The inner radius of the cylindrical classification zone is set to =36 mm and the outer radius to
=46 mm, resulting in a 10 mm gap. To avoid electrical breakdown between the inner and outer electrode or inside the high voltage plug, the maximal voltage is set to 10 kV although voltages up to 12 kV did not lead to discharges when there was no particle deposit present on the electrodes. The mean electrical mobility
of particles exiting the aerosol outlet of this inverted cylindrical DMA can be derived in the same way as the one for the classical cylindrical DMA. It depends on the sheath gas flow
and the applied voltage
as well as the DMA geometry:
(1)
(1)
Designed for an aerosol flow rate of at least 1.5 slm, the MF-DMA is suitable to classify particles over a large range by expanding the classification length from 95 mm (Short MF-DMA) to 495 mm (Long MF-DMA). Assuming spherical particles, the mobility diameter
can be calculated with:
(2)
(2)
and using the Cunningham slip correction factor
:
(3)
(3)
with the parameters
and
given by Kim et al. (Citation2005). Here,
is the number of charges,
the elementary charge,
the dynamic gas viscosity, and
the mean free path of the surrounding gas.
As a reference, the Nano DMA (Model 3085, TSI) and Long DMA (Model 3081, TSI) are usually used in combination with a classifier with aerosol to sheath gas ratio of 0.3/3 or 1.5/15 slm. Under these sheath gas conditions, it is possible to select maximal mobility diameters up to 165 and 65 nm, respectively, using the Nano DMA and up to 840 and 240 nm, respectively, with the Long DMA, assuming singly charged particles. The MF-DMA was tested in this work with larger sheath gas flows rates, between 4.5 and 30 slm, which theoretically allows to provide a monodisperse aerosol up to 420 and 120 nm, respectively, with the Short version and up to 1700 and 350 nm, respectively, with the Long version. In comparison to the traditional DMA design exemplified by the TSI DMAs, the instrument dimensions of the MF-DMA can provide size-selected particles in larger quantities, having larger and high-density particles.
2.2. Technical description
The MF-DMA consists of several parts, of which the outer parts are joined together by large vacuum flanges based on DN ISO-F 100 specifications. In this way, the DMA can easily be disassembled in smaller and lighter components for transportation and cleaning. In addition, some parts can be replaced or inserted to enable the conversion of the Short MF-DMA into the Long MF-DMA. The material used is stainless steel 316 L, which is for purposes of material synthesis better suited than aluminum. shows the cross sections of the Short and Long MF-DMA. All gas in- and outlets are equipped with DN ISO-K 16 flanges. The sheath gas enters the DMA from the top DN ISO-KF 16 flange through twelve Ø5 mm holes in the upper insulator tangential to the copper rod. The copper rod is used to electrically contact the hemisphere on top of the central electrode. Before the sheath gas passes the aerosol inlet and enters the classification zone, the gas flows around the hemisphere top and passes two polymer meshes. These laminarization meshes consist of fifty-four Ø50 µm fibers per cm and are mounted on a ring structure to provide a homogeneous flow field in the classification zone and to dampen possible flow turbulences. The mesh holder is fixed in place when screwing the hemisphere and the upper electrode together. The inner electrode consists of three parts, hemisphere, an upper and lower electrode, which are connected by threads.
The inner electrode is electrically isolated by two insulators at the top and bottom which are made from a ceramic material (MACOR). The polydisperse aerosol enters the DMA at the bottom and flows inside the inner electrode towards the aerosol inlet. The aerosol is led through twenty Ø3 mm drillings in the original design, which was optimized later in this work to forty Ø3 mm drillings (see discussion in Section 2.3), and a 1 mm inlet slit in the classification zone. The opening of the inlet slit is variable in the range from 1 mm to 4.5 mm in 0.5 mm steps by placing distance holders between upper and lower inner electrode. The inlet slit has an angle of 39.8° (upper) and 21.8° (lower) with respect to the inner electrode. The classification zone has an inner radius of 36 mm and an outer radius of 46 mm. The Short MF-DMA has a classification length of 95 mm. The lower part of the inner electrode can be interchanged by a longer version with a classification length of 495 mm to classify larger particles. An additional tubular part is nipped with vacuum flanges that can be inserted in the outer electrode, thereby accommodating the increased length of the inner electrode. The electrical high voltage can be applied to the inner electrode over a DN ISO-K 40 electrical feedthrough. It is connected to a copper rod and the hemisphere of the inner electrode via spring contact. The classified aerosol exits through thirty Ø0.5 mm drillings at the outer electrode in a 90° bend with an inner and outer diameter of 15 mm and 20 mm towards four DN ISO-K 16 flanges. The pressure drops over the small drillings is high enough so that a single aerosol outlet can be used without causing flow distortion in the classification zone. The excess aerosol leaves the annular space through ninety-six Ø1.3 mm drillings and exits the DMA sideward over four DN ISO-KF 16 flanges.
2.3. Optimization of in- and outlet geometry
As the MF-DMA should be able to operate with relatively large particles of high-density up to 1.7 µm as well as with medium gas flow rates, the particle losses due to impaction have to be investigated. To this end, CFD simulations based on the finite element method were performed using a three-dimensional mesh for a radial piece of 90°, including the regions before and after the outlet, with Fluent (Version 6.2, Fluent Inc., NH, USA). The gas phase was simulated by solving the Navier–Stokes equations for an ideal gas. It was assumed that the viscosity is only temperature-dependent and can be described by the Sutherland model. Heat capacity, as well as heat conductivity, are described by the kinetic gas theory with known degrees of freedom. Particle trajectories were calculated by using the Lagrangian approach, neglecting particle–particle interactions:
(4)
(4)
with
and
indicating the velocity of the particles and the gas. The particle acceleration results from several forces: the particle drag
), a random distributed force caused by Brownian motion
and an electrical force
The Stokes drag force was calculated using the friction coefficient
with the Cunningham slip correction factor
by Fuchs (Citation1964) (3):
(5)
(5)
The force resulting from Brownian motion was calculated with Gaussian distributed random numbers for with a mean value of 0 (Li and Ahmadi Citation1992):
(6)
(6)
is the Boltzmann constant and
the cell temperature. The time step at each iteration is set by
It was assumed that the electrical force
occurs only in the radial direction and is proportional to the electrical field
and to the particle charge
First experiments indicated that the MF-DMA with the original design of the aerosol inlet (twenty Ø3 mm drillings and 1 mm inlet slit) delivered a broadened bimodal size distribution for aerosol flows above 5 slm. Therefore, CFD simulations of the gas velocity in the classification zone of the MF-DMA were performed for analyzing the flow uniformity in the classification zone and for predicting the transfer function of the MF-DMA. For the analysis of the transfer function, 100 logarithmically distributed particle diameters in the size range 30‒200 nm for gold particles with a density =19.32 g cm−3 were calculated, taking nearly 2400 different starting points each simulated trajectory into account.
depicts the results of the 2.4 × 10⁵ simulated trajectories based on the original (a) and the optimized inlet design (b), as well as the corresponding experimentally measured transfer functions of the Short MF-DMA (crosses). The aerosol flow rate was set to 5 slm with a sheath gas flow rate of 25 slm. Experimentally, silver particles with a diameter of 74 nm were selected by applying a voltage of 3775 V. The transport efficiency and losses are attributed to the aerosol inlet and aerosol outlet wall, the electrodes, and the aerosol outlet (i.e., the DMA transfer function).
Regarding the experimental measurement of the original design, a bimodal size distribution with nodes at 65 and 80 nm can be observed, as stated earlier. The transport efficiency for the particle diameter to be classified (74 nm) is low, approx. 23%. The corresponding simulation indicates a broadened size distribution with a flat top and a comparable low transport efficiency of 35% (solid line), with 13% losses in the aerosol inlet and 8% in the outlet, and 47% losses to inner and outer electrode. The particle losses to the outlet walls are not so significant, which can be explained by its design which aimed at minimizing impaction losses by avoidance of sharp bends after the outlet drillings.
Particles with a diameter 65 nm and
> 100 nm do not reach the aerosol outlet and deposit on the electrodes. The broadened transfer function, as well as the relatively high losses, necessitate a reconsideration of the inlet region design based on an analysis of the streamlines in the classification zone.
The simulation with the optimized aerosol inlet (b) shows a narrower size distribution with a significant improvement of the transport efficiency up to 66% by reducing losses to the electrodes. The predicted size distribution by the simulation is even narrower, but still in good agreement with the experiment. The transport losses to the aerosol inlet walls (9%) are independent on the particle size and comparable to the original aerosol inlet.
depicts the axial gas velocity in the classification zone of the CFD simulation model based on the Short MF-DMA geometry. The left part of the figure shows the streamlines in the original design of the lower inner electrode, both as a top and as a side view. The original aerosol inlet contains 20 drillings in the inner part of the inner electrode, which are necessary to spread the aerosol homogeneously in the radial direction before the aerosol enters the classification zone through the inlet slit. In the 90° top view of , only five of these drillings are depicted. It can be observed that this number of drillings is insufficient to reach a homogeneous gas flow field in the classification zone at these relatively high gas flow rates, as the axial velocity shows a wavy form in the top view. The mean radial velocity in the aerosol inlet slit is 0.432 m/s with a standard deviation of 0.035 m/s. The non-uniformities in the radial flow profile lead to an inhomogeneous axial flow profile (streaks in color plot seen from the side view), which results in particles having different residence time and thus a different mobility-equivalent diameter. Consequently, the transfer function is broadened due to the simultaneous classification of particles having a different mobility-equivalent diameter. These nonuniform axial velocities are caused by the fact that the drillings are placed too far apart, so the number of drillings is doubled in the optimized design. By doubling the number of drillings, the mean radial velocity in the aerosol inlet slit does not change, but the standard deviation is reduced and becomes smaller than 0.01 m/s. That this modification leads to a much more uniform flow before and after the aerosol inlet slit can be seen on the right part of . Detailed experimental results and effects of the optimized aerosol inlet on the transfer function are presented in Section 4. In the following experimental setup and investigations, the optimized design of the aerosol inlet is used for the Long and Short MF-DMA.
3. Experimental methods
3.1. Experimental setup for determination of the transfer function
The performance of the MF-DMA can be assessed by means of measurement of the transfer function, which is described by its characteristic height and full width at half maximum (FWHM). Here, the resolution and the height
are applied to describe a diffusional broadened transfer function (Flagan Citation1999). By measuring the particle size distribution before and after the MF-DMA with a reference system, the transfer function can be calculated by deconvolution (Stratmann et al. Citation1997; Li, Li, and Chen Citation2006).
The standard technique for determining the transfer function of a DMA is based on a tandem DMA setup. Generally, a first DMA provides a monodisperse aerosol with known electrical mobility and a second DMA steps through specific mobility sizes differentially. If the DMA designs are identical, the transfer function can be calculated by deconvolution, assuming that both functions are equal. If two identical DMAs are not available, it is necessary that one transfer function is known. Therefore, in a first experiment, two Long DMAs (3081, TSI) are used in a tandem DMA setup to determine the transfer function of the DMA used by the SMPS. After the completion of this measurement, the first Long DMA is exchanged by the MF-DMA.
The experimental setups for determining the transfer function of the DMAs are shown in . The particle generation in both setups is equal, but the supply of the aerosol flow rate for the DMAs differs as represented in the setup (*a) and (*b). A first mass flow controller (Bronkhorst High-Tech B.V., Ruurlo, NL) controls a nitrogen gas flow rate of 0.8 slm (MFC 1), flowing through a furnace operated at temperatures between 1473 and 1673 K. In the tube furnace, silver particles are synthesized by an evaporation/condensation process and are transported towards a coagulation vessel. The vessel consists of a DN ISO-F 250 tube with a total volume of 12 l. It is equipped with two DN ISO-KF 40 flanges at the top for the aerosol inlet and side flange as an outflow. After the coagulation vessel, the size of the incoming aerosol is increased to particle diameters as large as 600 nm. A custom-built Kr-85 neutralizer with an initial activity of 370 MBq is used to establish a defined equilibrium charge distribution and is required for the subsequent data inversion (Yang, Dhaniyala, and He Citation2018).
In setup (*b) only, a second mass flow controller (MFC 2) downstream of the neutralizer dilutes the aerosol to provide a total aerosol flow rate for the MF-DMA between 2 and 10.5 slm.
A flow splitter directs a partial aerosol flow through a bypass with an exhaust HEPA-filter and thereby guarantees atmospheric pressure in the DMAs downstream. The flow rate in the bypass is permanently measured with a flow meter (Model 4140, TSI) to ensure constant conditions and is set to approx. 0.2 slm (MFM 1) by adjusting MFC 2. The first SMPS (Model 3936, TSI), a combination of a classifier (Model 3080, TSI), a Long DMA (Model 3081, TSI) and condensation particle counter (Model 3775, TSI), measures the polydisperse particle size distribution before entering the DMA to be characterized without additional neutralization (SMPS 1). The sample flow rate through Long DMAs to be characterized (*a)) is set to 0.3 slm and a sheath gas flow rate of 3 slm is provided by a classifier (Model 3080, TSI). This configuration was chosen because it corresponds to one of the SMPS standard setups and settings. The MF-DMA is placed on top of a sheath gas closed-loop recirculation system with blower, mass flow meter (MFM 2), and HEPA-filters (*b)). Thereby, the aerosol flow rate at the inlet and outlet of the DMAs are identical. A power supply (12.5 kV, 500 µA) is connected to the MF-DMA and voltages can be applied by software, controlled via LabVIEW (National Instruments, TX, US). Another SMPS (Model 3938, TSI), a combination of a classifier (Model 3080, TSI), a Long DMA (Model 3081, TSI), condensation particle counter (Model 3775, TSI), measures the monodisperse particle size distribution at the aerosol outlet of the DMA to be characterized and also here without additional neutralization (SMPS 2). The aerosol flow rate through the MF-DMA is set by means of a needle valve and a vacuum pump placed downstream. The total aerosol flow rate provided by the two MFCs is always higher than the required gas flow rate, sucked in by the two SMPS and by the vacuum pump via the needle valve.
The transfer function of the unknown DMA is determined by selecting 14 different mobilities and measuring the fractionated mobility distribution three times each with a SMPS (SMPS 2). Preparatory measurements with this tandem DMA setup show that it is necessary to use the largest SMPS scan time, 300 s with 6 s retrace and 10 s purge, to obtain consistent results. Thereby, a better resolution for narrow distributions (Collins et al. Citation2004) and an enhanced particle size range from 13.6 to 736.5 nm is reached. In the Appendix A, the broadening of the measured geometric standard deviation of an aerosol fractionated with a Long DMA and a flow ratio of 1:10 in dependency of the scan times is shown. The largest possible scan time of 300 s was chosen for all experiments in this work. The transfer function is determined according to the method described in Section 3.2.
3.2. Determination of the transfer function by data inversion
For the determination of the transfer function by data inversion, a simulation of all steps involved in the measurement chain is implemented and utilized. Different devices can be simulated, combined and the outputs can be predicted. For the calculation of the transfer function of an unknown DMA, a full simulation of said DMA combined with a SMPS, consisting of a neutralizer, DMA and CPC is carried out and compared with experimental data. The input polydisperse size distribution for the simulation is defined by the measurement with a first SMPS (SMPS 1). Downstream of the DMA to be characterized, a second SMPS (SMPS 2) measures the classified monodisperse size distribution. A numerical fit of the SMPS 2 data and the simulation with a variety of input parameters for the DMA transfer function lead finally to the correct prediction. The numerical fit is carried out with a Nelder–Mead simplex algorithm as described in Lagarias et al. (Citation1998) and is used to find the minimized error between measured and simulated particle size distribution. The simulation is sufficiently accurate if the error is smaller than 10−6. Thereby, the transfer function of the unknown DMA is determined by convolution with a known DMA transfer function, in this case, the Long DMA (3081, TSI).
The transfer function of the Long DMA is determined by a tandem DMA setup of two similar DMAs and the assumption that the resolution and transfer efficiency of both instruments are equal. In this case, the heights and widths of the transfer functions of the first and second DMA (SMPS 2) are coupled and the measured size distribution can be calculated by changing the FWHM and The transfer function is calculated for an ideal non-diffusional broadened transfer function with equal aerosol flow rate into and out of the DMA. The detailed results of this measurements can be found in the Appendix B. Height and resolution are fitted with an exponential expression based on the theory for diffusional broadening as derived by Flagan (1999):
(7)
(7)
The transfer function is calculated by a mathematical toolbox (MATLAB, MathWorks, Natick, MA, USA) using a matrix-based workspace. A diffusional or non-diffusional transfer function can be calculated. The program uses direct import of the SMPS data. The imported SMPS data files (SMPS 1) are converted into a number concentration with indexed
channels of the polydisperse aerosol. Multiple charge correction is not activated in the SMPS software (Aerosol Instrument Manager AIM, TSI) measuring the number concentration per electrical mobility. The absolute charge
is calculated by elementary charge
multiplied with the charge level
of the particles. The charge probability for smaller particles (
70 nm) is calculated by the Wiedensohler (Citation1988) approximation formula with the given coefficients
assuming that smaller particles can only be singly, doubly or uncharged (
):
(8)
(8)
The Gunn-Model (Gunn and Woessner Citation1956) is applied for all charges up to and for particles larger than
70 nm.
(9)
(9)
with dielectric constant
Boltzmann’s constant
temperature
the ion concentration ratio
assuming to be in the state of equilibrium, and the ratio of ion mobility for nitrogen
(Wiedensohler and Fissan Citation1991).
The number concentration after the neutralizer depends on the charge level
in the size channel
and is calculated stepwise for each size channel:
(10)
(10)
Knowledge of particle charging is critical for accurate estimation of and affects the calculation of the number concentration after the DMA, if there is a significant fraction of multiply charged particles. Yang, Dhaniyala, and He (Citation2018) showed that a 85Kr charger with an initial activity of 41 MBq does not produce particles with steady-state charge. A higher initial activity of 221 MBq is sufficient to produce steady-state charging values at a flow rate of 0.3 slm
. Increasing the aerosol flow rate (0.93 slm
) leads to a less charging performance but still close to theoretically prediction. Using a charger with a higher activity with a sufficient long residence time is recommended. The channel-based charge-dependent number concentration after the DMA
is calculated, if a DMA selects a mobility diameter
by a component-wise multiplication of the transfer function
with the charge-dependent inlet concentration
(11)
(11)
A transfer function describes the fraction of particles per size channel of a specific particle setpoint which can be found in the aerosol outlet of a DMA. The mobility-based center of the transfer function
is calculated by EquationEquation (2)
(2)
(2) using
instead of
for singly charged particles.
The diffusion broadened model for cylindrical DMAs derived by Stolzenburg (Citation1988) and given by Flagan (1999) is used for the determination of the transfer function. A new index is introduced that covers the entire mobility range
measured with the SMPS 2. The number of mobility channels
must be higher than the number of measuring channels to achieve a sufficiently high resolution. Thus, a high number of mobility channels avoids aliasing effects during back conversion. The values for
are calculated by interpolation between the mobility channels
The symmetrical flow of the aerosol flow rate is established by recirculation of the sheath gas so that the transfer function for the electrical mobility setpoint corresponding to the index can be expressed by:
(12)
(12)
where
and
the transfer efficiency. The smoothed triangular function
can be expressed by:
(13)
(13)
using the error function
and applying different equations for
with the normalized electrical mobility
(14)
(14)
Linear interpolation is used to convert the transfer function based on the mobility channels
to
based on the particle size
and charge space
The transfer function is only non-zero for the charge index
The diffusional broadening of a transfer function depends on the particle traversing time in the DMA and is expressed as the dimensionless variance
(15)
(15)
The Peclet number points out the dominant particle transport mechanism and is calculated by the ratio of electrophoretic to diffusive transport rate:
(16)
(16)
The applied DMA voltage is calculated from:
(17)
(17)
A summary of the geometry- and flow-dependent parameters: flow ratio the geometry parameter
and the parameter for nonuniformities in the electric field
calculated according to Flagan (1999) are shown in .
Table 1. Parameters calculated according to Flagan (1999) for a Long DMA and the two MF-DMA versions, at common DMA settings and standard conditions.
The resolution of the DMA is defined by EquationEquation (18)(18)
(18) with flow ratio
and the dimensionless variance
(18)
(18)
The simulated total number concentration for a given setpoint can be expressed as the sum of the total number concentration after the DMA multiplied by the counting efficiency
Therefore, a loop with the number of
measurement channels of the SMPS is needed to calculate the number concentration of each channel. The counting efficiency is set to 100% for particles diameters larger than 20 nm independent of their size (Hermann et al. Citation2007).
(19)
(19)
If a DMA with an unknown transfer function is used for size selection upstream of the SMPS 2, containing a DMA with a known transfer function, initial values for the transfer efficiency and resolution of the first DMA are used to predict and
By comparison of the simulated number concentration with the measured number concentration by the SMPS 2 the transfer function of the first DMA will be adjusted stepwise until the error will be smaller than
10−6.
4. Result and discussion
The transfer function of the MF-DMA is determined and evaluated according to the procedures described in Sections 3.1 and 3.2. The aerosol flow rate is varied from 1.5 slm up to 10 slm. The maximal sheath gas flow is limited to 30 slm with the available blower and pressure drop over HEPA-filters and laminarization mesh. Therefore, aerosol flow rates above 2.5 slm are operated with an aerosol to sheath gas ratio of 1/3 or 1/5 only. The transfer function is determined by a tandem DMA setup with the MF-DMA followed by a TSI Long DMA of the SMPS 2 downstream. The MF-DMA is assembled with the improved design of the aerosol inlet design, number of 40 drillings, with an inlet slit of 1 mm. A fully characterized transfer function is determined by a data inversion procedure and delivers experimental values for the height and the width
Results are compared with theory: the width based non-diffusional theory describing the theoretical limit of the resolution, given by the aerosol to sheath gas ratio
(Knutson and Whitby Citation1975), and the width according to diffusional theory as calculated from EquationEquation (18)
(18)
(18) . The theoretical limit of the height is 1 and indicates no particle losses in the DMA.
For the experimental evaluation of the transfer function particle diameters in the full-size range from 15 to 600 nm could be tested. Higher aerosol flow rates were provided by a dilution gas so that the total number concentration was reduced, resulting in a slightly smaller size range from which a sufficiently high number concentration could be classified. An improved transfer function for smaller particle diameters can be achieved by the shortening of the classification zone. The classification length of Short MF-DMA is 95 mm and thereby approx. five times shorter than the Long MF-DMA. The measurements of the transfer function using the Long MF-DMA are presented in this section, whereas the transfer function of the Short MF-DMA can be found in Figures S1–3 (see the online supplementary information ([SI])).
depicts the width (a) and the height
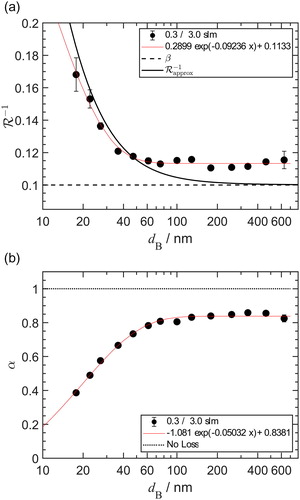
(b) of the transfer function of the Long MF-DMA for an aerosol to sheath flow ratio of 1/3 as a function of the setpoint particle diameter
Error bars indicate the standard deviation of three measurements at a given setpoint. The widths predicted by non-diffusional (
) and diffusional theory (
) are indicated by dashed and solid lines, respectively. A narrow size distribution is achieved with an aerosol flow rate of 1.5 slm and 2.5 slm. The width is approximately 6% above the theoretical optimum. The transfer function becomes more broadened and is size-independent by increasing the aerosol flow rate. For higher aerosol flow rates, 8 and 10 slm, the width increases strongly towards smaller particle diameters. A significant broadening of the transfer function and more particle losses are observed. Particle diameter larger than 300 nm can be still sufficiently resolved with a width of 0.45.
For the height, a value above 0.7 is obtained for aerosol flow rates below 5 slm. The height decreases towards smaller diameters due to the broadening of the transfer function. The broadening can be explained by a slightly distorted flow field which becomes more significant for higher aerosol flow rates as described in Section 2.3. This leads to a general offset of the width from the theoretical limit The decrease of the resolution for smaller particle diameter could indicate higher diffusion broadening in the classification zone. Comparing with the predicted diffusional broadening (colored solid lines), it can be seen that the diffusion is not the main cause. Due to the high velocity in this classification area, diffusion broadening is only expected for setpoints below 40 nm. A higher effective diffusivity, and therefore a broadening could be a result of microturbulences at the aerosol inlet area where the aerosol and sheath gas come together.
Additional particle losses can be attributed to the inner electrode wall. The multiplication of the height with the resolution gives the area of the transfer function and is equal to without particles losses. Particle losses are higher towards smaller particle diameters and longer residence time in the inlet tube of the inner electrode. Aerosol flow rates of 1.5 and 2.5 slm lead to 28% losses of a particle diameter of 50 nm and aerosol flow rate above 5 slm to 11%. A shorter residence time in the inner electrode is given by the Short MF-DMA leading to less particle losses with the same settings as can be seen in SI Figure S4 (see the online supplementary information ([SI])). Particle losses of 15% occur at an aerosol flow rate of 1.5 slm, 8% at 2.5 slm, and 2% above 5 slm, respectively.
shows the transfer characteristics of the Long MF-DMA for a flow ratio of 1/5. As mentioned before, sheath gas flow rates above 30 slm cannot be supplied by the used blower. Therefore, the highest aerosol flow rate is limited to 5 slm. Similar to the flow ratio of 1/3, the width for flow rates up to 5 slm seems to be relatively independent of the setpoint diameter and increases with aerosol flow rate. The transfer function is broadened by 13 and 20% for aerosol flow rates below and above 2.5 slm, respectively. The standard deviation increases with particle size larger than 200 nm due to less concentration during the measurements. A trend of the transfer characteristic for setpoints 200 nm cannot be clearly described. The transfer efficiency increases with the particles diameter from 70% (50 nm) to 90% (350 nm) and is comparable to previous results with a gas ratio of 1/3.
For a flow ratio of 1/10, shows that the width can be found in the range of 0.125, fairly size-independent and deviating more than the ones with same aerosol flow rate but higher gas flow ratios. The height of the transfer function is between 0.6 and 0.8 and shows a less clear size-dependency compared to flow ratios of 1/3 and 1/5. This can be explained by the fairly constant and broadened width. Influence of the sheath gas flow on the broadening of the transfer function is not observed. For this reason, the formation of microturbulence resulting from the fine laminarization mesh placed at a large distance to the aerosol inlet can be excluded. In fact, the slight broadening at larger aerosol and sheath flow rates shown in is mainly caused by the aerosol flow rate and can be probably related to flow inhomogeneities and turbulence at the aerosol inlet.
The broadening observed at higher aerosol flow rates supposedly caused by undesired mixing of aerosol and sheath gas is investigated more in detail. The aerosol inlet slit is increased stepwise by 1 mm up to 3 mm, thereby reducing the aerosol inlet velocity. displays the width and height of the transfer function as a function of the aerosol flow rate for a gas ratio of 1/3, using an aerosol inlet slit opening of 1, 2, and 3 mm and a constant setpoint diameter of 100 nm. It can be seen that the width of the transfer function increases with the aerosol flow rate, in line with the earlier findings. The width of the transfer function for a slit opening of 2 mm is reduced in comparison to an opening of 1 mm. A further enlarge of the slit opening up to 3 mm leads to a clear deterioration of the width and height characteristics.
The measurements of the transfer function were repeated using an aerosol inlet slit opening of 2 mm, as best results have been obtained with this configuration. In , the width and height of the transfer function for a flow ratio of 1/3 are depicted. Higher aerosol flow rates are more affected by the aerosol inlet slit so that only flow rates above 5 slm are shown. A significant improvement of the transfer characteristics can be seen in comparison to a slit opening of 1 mm (). The width is less broadened and the height is comparable to previous measurements: around 0.6 for the smallest particle sizes, increasing to values over 0.9 for the largest sizes.
5. Conclusion
A new DMA has been designed for high-density particles in the size range from 15 to 600 nm with a flow ratio of 1.5/15 slm. The MF-DMA was developed, manufactured and optimized by comparing experimental measurements and CFD simulations. The transfer function was experimentally determined with aerosol to sheath gas ratio of 1/10, 1/5, and 1/3 and aerosol flow rates up to 10 slm. A new software tool has been introduced to calculate the transfer function directly from SMPS raw data. A significant broadening of the transfer function was observed while increasing the aerosol flow rate over 5 slm. An improvement of the transfer function, especially for higher aerosol flow rates, was achieved by the modification of the aerosol inlet and adjustment of the inlet slit which have led to a more homogeneous flow field in the classification zone.
The MF-DMA is suitable for submicron particle diameters with high density, such as pure metal nanoparticles, in an aerosol flow rate up to 5 slm. This results in a new variety of applications such as the combination of online instruments for particle structure analysis, production processes on a pilot scale, calibration of particle mass analyzers. The CFD simulations are in good agreement with the experiments so that they can be used for further investigations or for the design of different DMAs. Together with the implemented software tool, the transfer function can be easily and quickly determined and DMAs characterized without the need of two identical DMAs in a tandem setup.
However, the transfer function of MF-DMA shows potential for further improvements in the area of the aerosol inlet and outlet, leading to a more homogeneous flow field, and the optimization of the design of the lower ceramic insulator for a longer operating time in production processes.
Supplemental data for this article is available online at https://doi.org/10.1080/02786826.2019.1642443.
Download MS Word (402.1 KB)Additional information
Funding
Related Research Data
References
- Babick, F., L. Hillemann, M. Stintz, T. Dillenburger, M. Pitz, A. Hellmann, S. Antonyuk, S. Ripperger, F. J. T. Huber, S. Will, et al. 2018. Multiparameter characterization of aerosols. Chem. Ing. Tech. 90 (7):923–36. doi:10.1002/cite.201700094.
- Byeon, J. H., and J. T. Roberts. 2012. Aerosol-Based fabrication of biocompatible Organic-Inorganic nanocomposites. ACS Appl. Mater. Interfaces 4 (5):2693–98. doi:10.1021/am300337c.
- Collins, D. R., D. R. Cocker, R. C. Flagan, and J. H. Seinfeld. 2004. The scanning DMA transfer function. Aerosol Sci. Technol. 38 (8):833–50. doi:10.1080/027868290503082.
- Flagan, R. C. 1999. On differential mobility analyzer resolution. Aerosol Sci. Technol. 30 (6):556–70. doi:10.1080/027868299304417.
- Fuchs, N. A. 1964. The mechanics of aerosols. Q. J. Roy. Meteorol. Soc. 91 (388):249. doi:10.1002/qj.49709138822.
- Gunn, R., and R. H. Woessner. 1956. Measurements of the systematic electrification of aerosols. J. Colloid Sci. 11 (3):254–59. doi:10.1016/0095-8522(56)90050-2.
- Hermann, M., B. Wehner, O. Bischof, H.-S. Han, T. Krinke, W. Liu, A. Zerrath, and A. Wiedensohler. 2007. Particle counting efficiencies of new TSI condensation particle counters. J. Aerosol Sci. 38 (6):674–82. doi:10.1016/j.jaerosci.2007.05.001.
- Heurlin, M., M. H. Magnusson, D. Lindgren, M. Ek, L. R. Wallenberg, K. Deppert, and L. Samuelson. 2012. Continuous gas-phase synthesis of nanowires with tunable properties. Nature 492 (7427):90–4. doi:10.1038/nature11652.
- Hewitt, G. W. 1957. The charging of small particles for electrostatic precipitation. Trans. AIEE I: Comm. Electron. 76 (3):300–6. doi:10.1109/TCE.1957.6372672.
- Hontañón, E., and F. E. Kruis. 2009. A differential mobility analyzer (DMA) for size selection of nanoparticles at high flow rates. Aerosol Sci. Technol. 43 (1):25–37. doi:10.1080/02786820802446812.
- Kim, J. H., G. W. Mulholland, S. R. Kukuck, and D. Y. H. Pui. 2005. Slip correction measurements of certified PSL nanoparticles using a nanometer differential mobility analyzer (Nano-DMA) for knudsen number from 0.5 to 83. J. Res. Nat. Inst. Standards Technol. 110 (1):31–54. doi:10.6028/jres.110.005.
- Knutson, E. O., and K. T. Whitby. 1975. Aerosol classification by electric mobility: Apparatus, theory, and applications. J. Aerosol Sci. 6 (6):443–51. doi:10.1016/0021-8502(75)90060-9.
- Kruis, F. E., H. Fissan, and A. Peled. 1998. Synthesis of nanoparticles in the gas phase for electronic, optical and magnetic applications—A review. J. Aerosol Sci. 29 (5–6):511–35. doi:10.1016/S0021-8502(97)10032-5.
- Lagarias, J. C., J. A. Reeds, M. H. Wright, and P. E. Wright. 1998. Convergence properties of the Nelder–Mead simplex method in low dimensions. SIAM J. Optim. 9 (1):112–47. doi:10.1137/S1052623496303470.
- Li, A., and G. Ahmadi. 1992. Dispersion and deposition of spherical particles from point sources in a turbulent channel flow. Aerosol Sci. Technol. 16 (4):209–26. doi:10.1080/02786829208959550.
- Li, W., L. Li, and D.-R. Chen. 2006. Technical note: A new deconvolution scheme for the retrieval of true DMA transfer function from tandem DMA data. Aerosol Sci. Technol. 40 (12):1052–57. doi:10.1080/02786820600944331.
- Rosser, S., and J. Fernández de la Mora. 2005. Vienna-type DMA of high resolution and high flow rate. Aerosol Sci. Technol. 39 (12):1191–200. doi:10.1080/02786820500444820.
- Steiner, G., M. Attoui, D. Wimmer, and G. P. Reischl. 2010. A medium flow, high-resolution Vienna DMA running in recirculating mode. Aerosol Sci. Technol. 44 (4):308–15. doi:10.1080/02786821003636763.
- Stolzenburg, M. R. 1988. An ultrafine aerosol size distribution measuring system. Ph.D. Thesis, Department of Mechanical Engineering, University of Minnesota.
- Stratmann, F., T. Kauffeldt, D. Hummes, and H. Fissan. 1997. Differential electrical mobility analysis: A theoretical study. Aerosol Sci. Technol. 26 (4):368–83. doi:10.1080/02786829708965437.
- Uin, J., E. Tamm, and A. Mirme. 2009. Electrically produced standard aerosols in a wide size range. Aerosol Sci. Technol. 43 (8):847–53. doi:10.1080/02786820902980348.
- Wiedensohler, A. 1988. An approximation of the bipolar charge distribution for particles in the submicron size range. J. Aerosol Sci. 19 (3):387–9. doi:10.1016/0021-8502(88)90278-9.
- Wiedensohler, A., and H. J. Fissan. 1991. Bipolar charge distributions of aerosol particles in high-purity argon and nitrogen. Aerosol Sci. Technol. 14 (3):358–64. doi:10.1080/02786829108959498.
- Yang, H., S. Dhaniyala, and M. He. and 2018. Performance of bipolar diffusion chargers: Experiments with particles in the size range of 100 to 900 nm. Aerosol Sci. Technol. 52 (2):182–191. doi:10.1080/02786826.2017.1387641.
Appendix A
A SMPS (3938, TSI), classifier (3080), Long DMA (3081), condensation particle counter (3775) is used in Low-Flow mode with a scan time up to 300 s. depicts the geometric standard deviation of a monodispersed aerosol ( = 100 nm) in dependency of the scan time in seconds. The scan time is increased stepwise and is limited to 300 s. Faster scan times than 180 s show a clearly increased geometric standard deviation and precise calculation of the transfer function, especially the resolution of DMAs, are not possible.
Appendix B
depicts the transfer function of the Long DMA (3081, TSI) which is characterized by the width and height
The measured width of the transfer function is compared to the approximation
by Flagan (1999). The characteristics width
and height
are fitted by exponential expressions to determine the transfer function of an unknown DMA in a tandem DMA setup. Particle losses occurring in the experimental setup are minimized by avoiding sharp bends and using short tube lengths. Thereby, using same tube dimensions to SMPS 1, Long DMA and SMPS 2 the particle losses are almost identical and can be neglected.
Figure 1. Cross-sections of the Short (a) and Long MF-DMA (b).
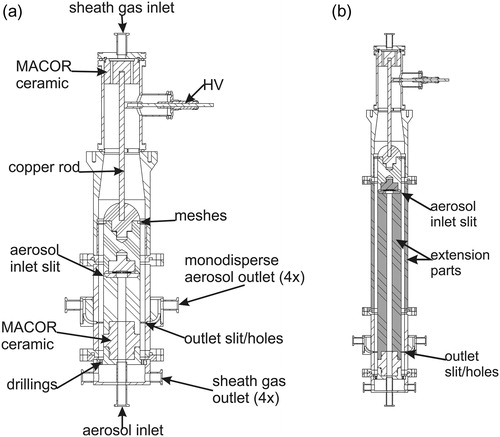
Figure 2. Transport efficiency and losses in different regions of the MF-DMA with original aerosol inlet design (a) and optimized aerosol inlet (b) according to the simulations. The experimentally measured transfer function is also included (crosses). Short MF-DMA, with Qaerosol=5 slm and Qsheath=25 slm and an aerosol inlet gap of 1 mm.
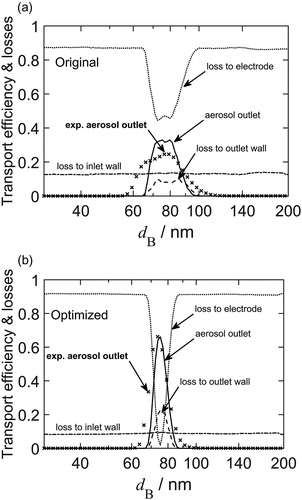
Figure 3. Simulation of the axial gas velocity for the original aerosol inlet with 20 drillings (left) and the optimized aerosol inlet with 40 drillings (right). Shown are the top and the side view of the inner electrode (conditions as in ).
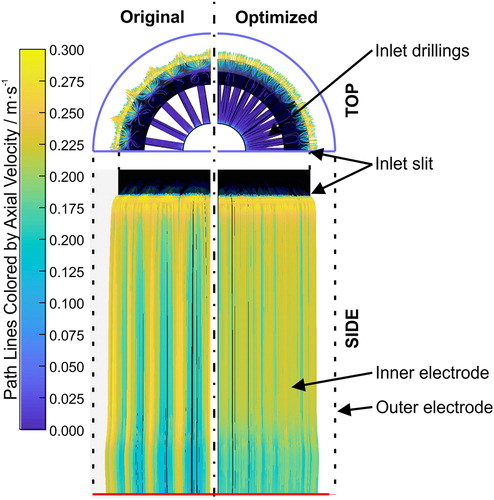
Figure 4. Experimental setup for the determination of the transfer function of the Long DMA (3081, TSI) (*a), as well as the Short and Long MF-DMA (*b).
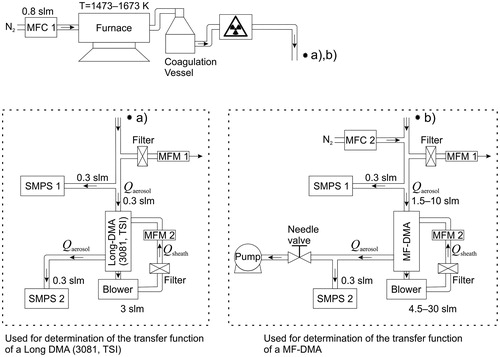
Figure 5. Width (a) and the height
(b) of the transfer function of the Long MF-DMA for a flow ratio
and an aerosol inlet gap of 1 mm. The legend shows the aerosol and sheath flow rates.
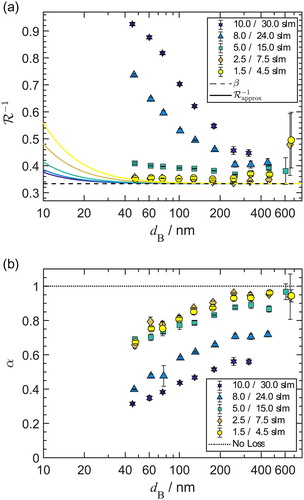
Figure 6. Width (a) and the height
(b) of the transfer function of the Long MF-DMA for a flow ratio
and an aerosol inlet gap of 1 mm.
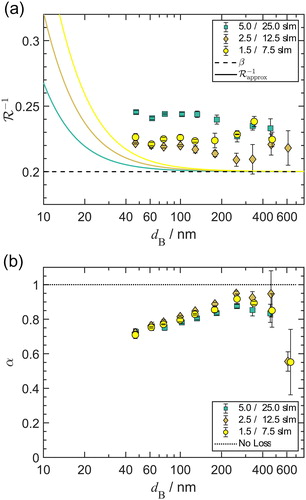
Figure 7. Width (left) and the height
(right) of the transfer function of the Long MF-DMA for a flow ratio
and an aerosol inlet gap of 1 mm.
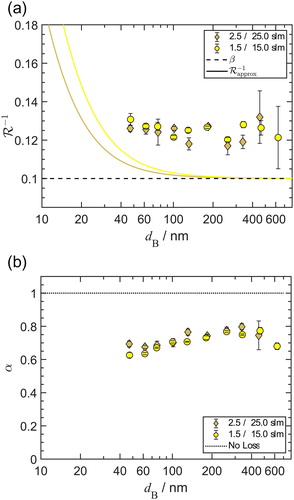
Figure 8. Width (left) and the height
(right) of the transfer function of the Long MF-DMAfor a flow ratio
and a variable aerosol inlet gap for a particle diameter of 100 nm.
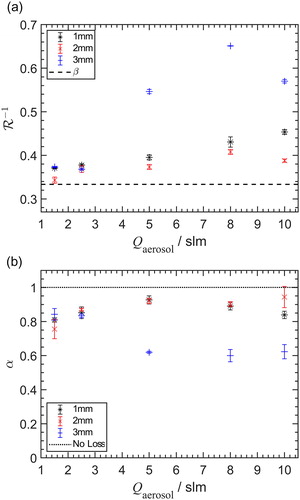
Figure 9. Transfer function of the Long MF-DMA for a flow ratio and an optimized aerosol inlet gap of 2 mm.
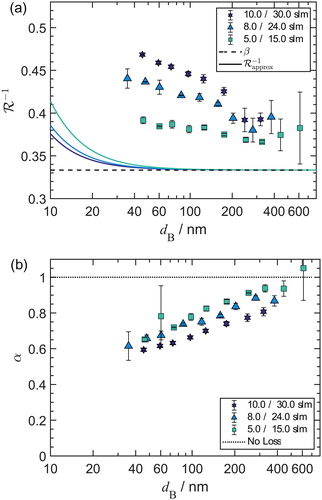
Figure A1. Geometric standard deviation in dependency of the SMPS scan time with a flow ratio of 1:10.
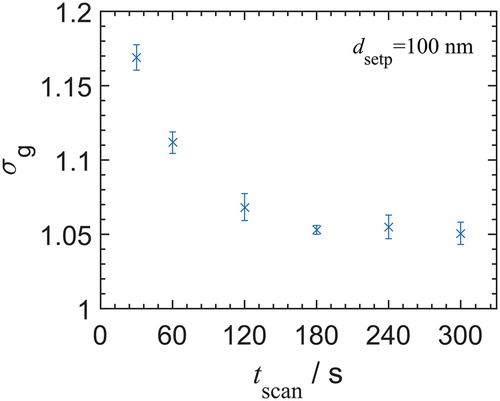
Figure A2. Transfer function of the Long DMA (3081) for a theoretical