
Abstract
It is widely known that cooking contributes particulate matter (PM) to outdoor and indoor air. To research the morphology and chemical composition of PM10 and PM2.5 in cooking fumes, four Chinese restaurants with distinct cooking styles were sampled. A Zeiss Merlin Compact (FE-SEM) with EDS system was used to determine the morphology and chemical composition of individual PM. The results show six types of particles with different morphologies: rectangular, flocculent, flat, irregular, spheroidal and spherical, and they are primarily Ca-rich, C-rich, and Si-rich particles. The most abundant PM was Ca-rich particles with rectangular shape, thus, Chinese style cooking may be an important source of rectangular Ca-S particles The amount of these particles was affected by the cooking style and method: water-based cooking methods emitted more rectangular Ca-S particles, C-rich particles with spherical shapes were abundant in cooking fumes from oil-based cooking methods, and the spheroidal particles in cooking fumes are closely associated with roasting.
Copyright © 2019 American Association for Aerosol Research
1. Introduction
The widespread occurrence of atmospheric particulate matter (PM) pollution has led to many discussions (Breed, Arocena, and Sutherland Citation2002; Robinson et al. Citation2006; Chen et al. Citation2007; Barone and Zhu Citation2008; Abdullahi, Delgado-Saborit, and Harrison Citation2013; Huffman et al. Citation2009; González et al. Citation2016, Citation2017). Previous studies have shown that cooking is a significant particle-generating activity indoor, and a large number of people are exposed to potential cooking-related mortality and morbidity risks due to the PM in cooking fumes (Lazaridis et al. Citation2006; Zhao et al. Citation2007; Buonanno, Morawska, and Stabile Citation2009; Lai et al. Citation2010; Wan et al. Citation2011; Alves et al. Citation2012; Massey et al. Citation2012). Furthermore, cooking also significantly contributes to outdoor PM, for example, Wen and Hu (Citation2007) reported that the emission of particulate organic matter from cooking is nearly equal to the contribution from vehicular traffic in Beijing. Therefore, numerous field sampling and laboratory experiments have been performed to investigate the characteristics of inorganic and organic fractions of PM generated during cooking (Rogge et al. Citation1991, Citation1993; Lee, Li, and Chan Citation2001; See and Balasubramanian Citation2006a, Citation2006b, Citation2008; Susaya et al. Citation2010; Buonanno et al. Citation2011; Shipley, Peishi, and Qing Citation2018). Despite these investigations, substantial uncertainties still remain about the morphology characterization and chemical properties of individual particles in cooking fumes. More detailed studies are needed to investigate the quantitative morphology and chemical composition of particles emitted by cooking. Such investigations are necessary because the shape of PM directly affects its deposition efficiency and interactions with biological fluids in the lungs of organisms (Stearns, Paulauskis, and Godleski Citation2001; Bond and Bergstrom Citation2006).
The morphologies of PM have been found to differ with respect to the emission source, and morphological analyses of particles are commonly used to determine the possible source of atmospheric PM (Yue et al. Citation2006; Barone and Zhu Citation2008). Previous studies have reported several typical morphologies, including round, spherical, aggregate, rectangular, flat and irregular shapes (Breed, Arocena, and Sutherland Citation2002; Barone and Zhu Citation2008; Campos-Ramos et al. Citation2009; Li and Shao Citation2009; González et al. Citation2018), and it is widely accepted that regularly shaped particles (such as round and spherical particles) in the atmosphere are formed at high temperature by anthropogenic sources (Conner et al. Citation2001). However, these observations have only evaluated the relative contributions of vehicular traffic, industry, and combustion activities. Few studies have compared the morphologies of PM from cooking and other sources in the atmosphere. It is difficult to accurately predict the contribution of cooking to air pollution without more detailed knowledge regarding the morphologies of PM emitted from cooking.
Chinese cooking is extremely complex and can be characterized by eight representative styles that use various cooking methods and ingredients. The composition of the particles emitted from cooking operations is strongly dependent on the cooking procedures (McDonald et al. Citation2003; He et al. Citation2004; See and Balasubramanian Citation2008). Previous studies have reported the emission characteristics of different Chinese cooking methods or procedures (He et al. Citation2004; Zhao et al. Citation2007). Few studies have addressed how the morphologies and chemical compositions of PM vary as a function of the cooking style. Research on differences in PM morphologies and chemical compositions caused by different Chinese cooking styles may provide useful information when investigating purification technics of PM in cooking fumes.
In this study, the PM from four Chinese restaurants that utilize different cooking styles was collected in Shenzhen, China. All of the samples were analyzed by SEM-EDS and ICP-AES to address three issues: (1) the mass concentration and chemical compositions of PM10 and PM2.5 in the cooking fumes, (2) the morphological characterization of typical individual PM, and (3) the differences in the PM morphologies and trace element emissions of the different Chinese cooking styles.
2. Materials and methods
2.1. Sampling
In this study, four representative Chinese restaurants that use different cooking styles, i.e., Cantonese style (GD), Sichuan style (SC), Xibei style (XB), and Hunan style (HN), were selected in the city of Shenzhen. The basic information regarding these restaurants is listed in Table S1 (see the online supplementary information [SI]). The size of these restaurants was similar, and the four restaurants all used the same blended cooking oil (918498, Jinlongyu, China). This oil consists of 94% soybean oil and 6% sunflower seed oil and has a specific gravity of 0.917 kg/L, and smoking point of 221 °C. The four restaurants were all located in office blocks, and the exhaust vents of the restaurants were far away from the road, minimizing the influence of other sources. The total sampling time at each restaurant lasted two hours (11:00 AM to 13:00 PM). During the sampling time, the restaurant patrons were mainly nearby office staff, and the customers and orders did not significantly change each day. The samplers were deployed at the exhaust vents, and four samples were collected on quartz fiber filters (90 mm diameter, Whatman) using two medium volume samplers (Model 2030, Laoshan Institute of Applied Technology, China) with a 100 L/min flow rate. The single sampling lasted 1 h. The concentrations of PM2.5 and PM10 emitted from the restaurants were monitored using two DustTrak samplers (Model 8530, TSI, USA). Information regarding calibration of the DustTraks is provided in the SI. The concentration of SO2, temperature and relative humidity of fumes were also detected by an air detector (Model 3012 H-C, Laoshan Institute of Applied Technology, China). As shown in Table S2, high relative humidity (>60%) may affect the PM morphology, however, the temperature and relative humidity of cooking fumes from four restaurants were close, which indicated that relative humidity may not affect the difference of PM among restaurants. Before each sampling, the quartz fiber filters were baked at 450 °C for 5 h and then conditioned in a chamber with a relative humidity of less than 50% and a temperature of 20 °C for 24 h.
2.2. Chemical and morphological analysis
2.2.1. SEM-EDS analysis
SEM was used to identify and determine the morphology and element composition of PM. For each PM filter, three representative subsamples with dimensions of 1 cm × 1 cm were extracted and analyzed. The subsamples were sputter-coated with Au and then placed on carbon tape. In this study, 100 randomly selected particles were analyzed to determine their dimensions, shapes and the chemical composition of each subsample. Therefore, a total of 300 particles were selected for one PM sample. Two of the four PM filters from one site were used for the SEM analysis, and each filer was tested by different researchers. In most cases, the reported results represent averages from the analyses of two separate samples, and we also established the reproducibility: σA=1.427, GRR= 6.125. A Zeiss, Merlin Compact -FE-SEM with EDS system was used to determine the PM size, shape, and chemical composition, and images were acquired by SEM using a Phenom Pro operated at 15 kV under low vacuum conditions (30 Pa).
2.2.2. Analysis of trace elements
The quartz membrane filters were cut into two parts, and one part was analyzed using ICP-AES to determine the levels of trace elements. The other part was stored at 4 °C as a backup sample or was used for SEM-EDS analysis. The filters were cut into some small strips and placed in a vessel (PFA Teflon). Then, 20 mL of an acidic solution (5.55% of HNO3, 16.75% of HCl) was added to the vessel. The vessel was sealed and heated to 200 °C for 15 min in a microwave system (Model MARS-5®, CEM Corp., Matthews, NC, USA). After heating, the vessel wall was washed with ultra-pure water. The solution was then transferred into a volumetric flask, and the final volume was adjusted to 100 mL by adding ultra-pure water. Two blank samples (reagent and filter blanks) were also prepared. The trace elements in the digested solution were analyzed using an ICP-AES system (Shimadzu, Japan, Model ICPE-9000). The operating conditions of the ICP-AES instrument were as follows: RF = 40.68 MHz, RF power = 1.4 kW, carrier gas flow rate = 0.55 L/min, auxiliary gas = 0.22 L/min, and coolant =15.0 L/min. Before testing, calibration curves were established, and the correlation coefficients were all above 0.999. The standard sample recovery rate was 85–116%. The method detection limits were as follows: 3.0 ng/mL for Mg, Al, and Fe; 2.0 ng/mL for Zn and Ba; 5.0 ng/mL for Pb; 1.0 ng/mL for Ni and Cr; and 0.3 ng/mL for Cd, Mn, and Cu.
3. Results and discussion
3.1. The concentrations of PM2.5 and PM10
lists the average PM concentrations corresponding to the four restaurants (the concentrations of PM2.5, PM10 and the ratio of the two values are shown in Figure S1). Previous studies have shown that the PM2.5 levels are always low when food was cooked by steaming (See and Balasubramanian Citation2006a). Therefore, the lowest average concentration of PM2.5 was observed for GD (1.40 mg/m3) because this restaurant primarily cooks dim sum, a type of steamed food. The average concentration of PM2.5 found for SC (3.38 mg/m3) was the highest, because the primary cooking processes used in the SC restaurants are panfrying and deep-frying. The average concentration of PM2.5 observed for HN (1.67 mg/m3) was much lower than that of SC, though the taste of these two cooking styles is similar. This may be attributed to the fact that HN restaurants always cook food by boiling, steaming, and stir-frying. The large difference in the PM2.5 concentrations of the SC and HN restaurants indicates that cooking methods may have a larger effect on PM emissions than flavoring. The highest maximum concentrations of PM2.5 and PM10 were both observed for XB which due to the large amount of roast mutton (electric oven) that was cooked. However, because the other foods were primarily boiled, the average concentration was relatively lower than that of the SC restaurant. In addition, the average concentration of PM10 found in this study is consistent with the trend found for PM2.5.
Table 1. Statistical summary of the PM2.5 and PM10 mass concentration.
3.2. Morphological and compositional analysis of PM10 and PM2.5 using SEM-EDS
3.2.1. Typical morphology of PM10 from four restaurants
In this study, six kinds of particles with different morphologies were observed in all the PM10 samples. shows the six types of typical particles, the PM was categorized into the following six morphological classes: rectangular (), flocculent (), flat (), irregular (), spheroidal (), and spherical (), this result is consistent with previous studies on the morphologies of PM emitted from other sources (Aragon-Piña et al. Citation2000, Citation2006; Breed, Arocena, and Sutherland Citation2002; Chakrabarty et al. Citation2006; Barone and Zhu Citation2008; Campos-Ramos et al. Citation2009; González et al. Citation2016, Citation2018). In addition, to eliminate the interference of other PM sources, ambient air samples were also examined. In the ambient air samples, nearly half of the particles were irregularly, flocculent and flat particles were both present at approximately 15%, rectangular particles made up approximately 10%, and the remainder consistent of spheroidal, spherical, and other regularly shaped particles.
Figure 1. SEM photomicrograph of (a) rectangular, (b) flocculent, (c) flat, (d) irregularly (e) spheroidal, and (f) sphere-shaped particles collected from four restaurants.
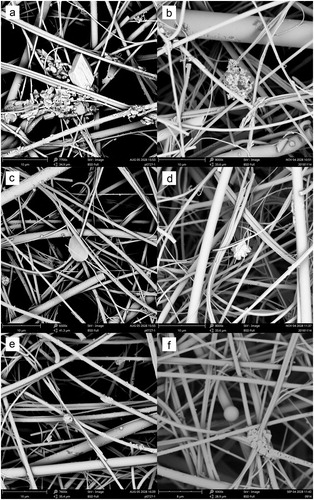
Figure 2. Size distribution of four types of PM: (a) rectangular, (b) flocculent, (c) flat, and (d) irregular.
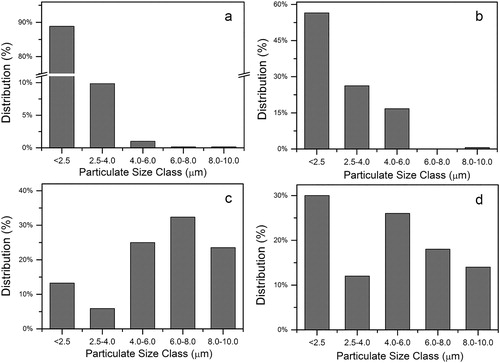
shows the rectangular particles. In contrast to the ambient air samples, rectangular particles were the most abundant particle type, accounting for over 55% of the particles present in the samples collected from the four restaurants. In this study, the rectangular shape was observed to exist in two forms, with most particles present in agglomerates, and only a few present as individual particles. This type of particle was always small, as shown in . Nearly 90% of the particles had diameters less than 2.5 μm, and the percentage of larger particles (>6 μm) was below 1%. A chemical analysis of individual rectangular particles using EDS is shown in FigureS2. The results showed that this type of particle primarily contained S, Ca, and O with minor amounts of Na, F, K, and N. This type of PM may be formed during cooking, and the high contents of S, Ca, and O suggest that the rectangular particles were CaSO4. Ca-S particles with rectangular shapes were not abundant in samples collected from other sources, especially traffic and coal combustion (Kim et al. Citation1987; Breed, Arocena, and Sutherland Citation2002; Barone and Zhu Citation2008). Additionally, previous morphological studies regarding atmospheric PM have observed few rectangular particles in samples collected from Baltimore (USA), Uppsala (Sweden), and Monterrey (Mexico) (Conner et al. Citation2001; Wilkinson et al. Citation2011; González et al. Citation2016). However, Breed, Arocena, and Sutherland (Citation2002) observed a few rectangular particles in the Prince George area (Canada). Li and Shao (Citation2009) also observed some well-defined Ca-S particles with rectangular shapes in samples collected from the atmosphere in Beijing (China). These researchers reported the rectangular shaped particles had high levels of S and Ca, which is indicative of an industrial source. In this study, S may be released from food, such as tofu. Tofu contains approximately 0.5%∼2% gypsum (CaSO4·2H2O) (Onodera et al. Citation2009; Chen et al. Citation2011) and is a traditional Chinese food. All four restaurants cook tofu every day. See and Balasubramanian (Citation2008) have reported that cooking tofu will emit significant number of SO42-. This observation indicated that Chinese cooking may be an important source of rectangular Ca-S particles. In addition, S could be present in the nature gas and released upon combustion. However, the concentration of SO2 were quite low in cooking fumes (shown in Table S2), the relationship between SO2 from gas combustion and Ca-S particles is to be investigated through controlled experiments on the combustion of the gas alone.
illustrates particles with a flocculent morphology. This category of particles accounted for nearly 30% of the particles present in the PM10 samples collected from the four restaurants. The percentage was twice that in the ambient air samples. Similar to the rectangular particles, the size of most of the flocculent particles was small, and over 50% of the flocculent particles had a size less than 2.5 μm (). However, the percentage of larger PM (2.5–6.0 μm) was greater than that observed for the rectangular particles (over 40%). Particles with flocculent shapes have been widely observed, not only in the atmosphere but also from anthropogenic combustion, vehicle exhaust and industrial sources (Breed, Arocena, and Sutherland Citation2002; Barone and Zhu Citation2008; Li and Shao Citation2009; Wang et al. Citation2013; González et al. Citation2018). Previous studies have usually classified flocculent particles as irregular shapes, and researchers attributed this type of particle to soot aggregation (Li and Shao Citation2009). Consistent with these previous studies, the elemental compositions of the flocculent aerosols in this study showed abundant C, O, S, and K and minor Ca, Al, Zn, and Cu. Soot particles have a close relationship with the combustion process (Pósfai et al. Citation1999; Wang et al. Citation2013). Therefore, the presence of this type of particle in cooking fumes can be attributed to the biomass or ingredients burning during cooking.
The particles with flat shapes are shown in . The percentage of flat particles was approximately 5%, which was much lower than that in the ambient air samples and lower than the percentages of rectangular and flocculent particles in cooking fumes. However, this type of particle was always large in size, as shown in , the most abundant particles ranged in size from 6.0 to 8.0 μm. The result of the elemental composition analysis using EDS showed that this kind of particle mainly consisted of Si, O, Na, Al, and C, and some particles contained minor K, S and trace metals. These Si-rich particles with flat morphologies are also not very abundant in other anthropogenic PM sources (Aragon-Piña et al. Citation2000, Citation2006; Barone and Zhu Citation2008; Li and Shao Citation2009; Wilkinson et al. Citation2011; González et al. Citation2016). Breed, Arocena, and Sutherland (Citation2002) reported a small number of Si-rich particles with flat or smooth flat shapes in the Prince George area. The researchers thought this type of particle was related to geologic material sources. Clays, especially phyllosilicates, often exhibit flat or sheet-like structures (Schulze, Citation1989). In this study, the presence of this type of PM in cooking fumes may be related to residual soil attached to the skin of root vegetables or the walls of the chimney.
shows a particle with an irregular shape. This type of particle has often been the most abundant particle in previous studies. However, in this study, the flocculent particles were distinguished from the irregular particles, and the proportion of irregular particles was only approximately 5%. The most abundant size class was particles less than 2.5 μm, but the proportion was not high (). Figure S3 illustrates the chemical analysis of an individual particle with an irregular morphology. This type of particle primarily contained Si, Al, O, and K, which is the elemental composition associated with K-feldspars (KAlSi3O8). These irregularly shaped particles are often observed in the atmosphere over Beijing, Prince George, and Mexico, and these particles possibly originate from soils and rocks (Breed, Arocena, and Sutherland Citation2002; Li and Shao Citation2009; González et al. Citation2016, Citation2018). Therefore, in this study, this type of PM was also likely from the residual soil attached to the skin of root vegetables.
shows a spheroidal particle. The amount of this type of particles was quite low (<2%), only slightly higher than the amount of regular spherical particles. In fact, even in the ambient air samples, particles with spheroidal or spherical shapes were the least abundant. All of the particles in this group were less than 2.5 μm in size. Therefore, the size distribution of particles with spheroidal morphologies is not listed in this study. These particles contained a large amount of Ca, O, S, Al, and K and traces of Fe, Ni, and Cl. Previous studies have shown that Ca-rich particles are seldom present as individual spheroidal or spherical shapes (Li and Shao Citation2009; González et al. Citation2016, Citation2017, Citation2018). In this study, this type of particles might have formed due to the CaSO4 mixing with Al or K-rich particles.
presents a regular spherical particle. This type of spherical, amorphous PM was not often observed, and its proportion was the lowest of all the categories (∼1.5%). These particles typically did not aggregate with other particles and were mostly in the fine fraction (<2.5 μm); only one particle with a size larger than 2.5 μm was observed. The observed elemental compositions of these aerosol particles showed a large amount of C and minor amount of O, S, K, and Ca. This composition indicated that the PM was organic. A majority of previous studies concluded that the spherical particles were tar balls that formed during biomass burning (Pósfai et al. Citation2004; Hand et al. Citation2005). Thus, this type of particle is often present in samples collected from a combustion source (Chakrabarty et al. Citation2006). However, because the combustion of ingredients is very slight during cooking processes, the number of regular spherical particles in the samples was low in this study. Therefore, cooking only makes a small contribution to the number of tar balls in the atmosphere.
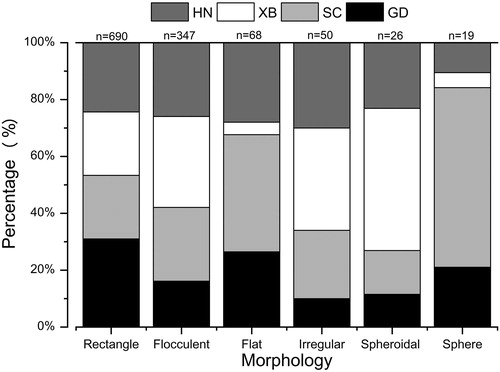
In addition, a comparison of the chemical compositions indicated some significant differences among the PM groups. A one-way analysis of variance (ANOVA) was used to determine the difference in the chemical compositions of the six types of PM. Only those elements showing significant differences (p < 0.05) among the morphological shapes were reported (). The rectangular, spheroidal and spherical particles were all Ca-rich particles; hence, Ca-rich particles typically have regular morphologies, and they are the most abundant particles in Chinese cooking fumes. The cooking fumes also contained large numbers of C-rich particles (flocculent and spherical particles), and they always have amorphous morphologies. The flat and irregularly shaped particles were mainly Si-rich particles, but the amounts of these two groups of particles in cooking fumes were not very high. In contrast to other PM sources, the PM emitted from cooking primarily consisted of Ca-rich, C-rich, and Si-rich particles. Although many trace elements were detected by ICP-ASE, no individual trace-element-rich particles were observed.
Table 2. Mean (and standard error) chemical composition (mass %) of various morphological types of PM10.
3.2.2. The influence of different cooking styles
shows the percentages of PM with different morphologies for each restaurant. The percentages of rectangular particles in the SC, HN, and XB restaurant fumes are very close, and only the GD restaurant has a higher percentage than the other three restaurants. However, the percentage of flocculent, irregular and spheroidal particles in the GD sample was significantly lower than that in the samples from the other three restaurants, while the proportions of the three types of particle in the XB samples were the highest. This indicated that water-based cooking methods emit more rectangular particles, but roasting emits more flocculent, irregular and spheroidal particles. In addition, SC samples had the most abundant flat and spherical particles, which suggests that the flat and spherical particles are more closely associated with pan-frying and deep frying.
Figure 3. Proportions of aerosol particles in PM10 collected from four restaurants. A total of 1200 (300 × 4) particles were identified on the basis of their different morphologies found using SEM.
3.2.3. Comparison of PM2.5 and PM10
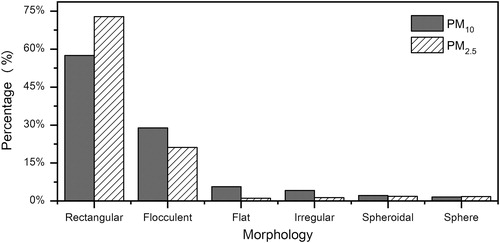
shows the percentages of PM10 and PM2.5 with different shapes in this study. PM with a rectangular shape was the most abundant, not only in PM10 but also in PM2.5. PM2.5 consisted of approximately 75% rectangular particles, which was significantly higher than that of PM10. Flocculent particles were also very common in PM2.5, and the percentage was close to 20%, which was slightly lower than that of PM10. The percentages of particles with flat and irregular morphologies in PM2.5 were significantly lower than those in PM10, with only approximately 1% of particles possessing these shapes. It was apparent that the two groups of PM primarily consisted of particles larger than 2.5 μm. The numbers of spherical and spheroidal particles in PM2.5 were both low. However, the proportion of spherical particles was higher than that in PM10, while the percentage of spheroidal particles was slightly lower.
Figure 4. Proportions of PM2.5 and PM10 collected in four restaurants.
3.3. PM10 and PM2.5 trace elements
lists the average concentrations of 13 elements in PM10. In this study, Cu (78.17 ng/m3), Fe (67.92 ng/m3) and Zn (46.77 ng/m3) were the three most abundant metals in ambient air, while the concentrations of Co and As were the lowest, with values of 0.21 ng/m3 and 0.77 ng/m3, respectively. In contrast to the ambient air, the trace elements concentrations in PM10 from the GD restaurant displayed the following trend: Zn > Fe > Cu > Ti > Ni > Al > Cr > Mn > V > Pb > As > Cd > Co. The concentration of Zn (833.7 ng/m3) was the highest, and the amounts of Ni (31.79 ng/m3) and As (6.05 ng/m3) were significantly higher than those in the ambient air. Ni can be leached from a stainless-steel wok (Kumar, Srivastava, and Srivastava Citation1994). Seafood is the primary ingredient in Cantonese food, and high concentrations of Zn, As, and Cd may have been released from fish (Wang and Chao Citation1992; Yang et al. Citation2014). For the SC restaurant, the most abundant metals were Fe (1316 ng/m3), Cu (1019 ng/m3), and Zn (843.1 ng/m3), unlike the GD restaurant, where the concentration of Zn was the highest. The high content of Fe may have been from animal innards and blood (Yang et al. Citation2014). Although the maximum concentration of PM was observed in the XB restaurant emissions, the metal concentrations were lower than those in the SC restaurant emissions, with the exception of Ni. Similar to the GD restaurant, the concentrations of Zn and Fe were the highest, with values of 1069 ng/m3 and 909.2 ng/m3, respectively. Since no aquatic products or seafood were used in the XB restaurant, the concentrations of As and Cd were significantly lower than those at the other three restaurants. With regard to the HN restaurant, the concentrations of all of the elements were close to those of the GD restaurant, and the three most abundant elements of the HN sample were Zn (896.5 ng/m3), Fe (819.2 ng/m3), and Cu (738.8 ng/m3). In addition, Cd (7.79 ng/m3) and As (6.82 ng/m3) were found to have the highest concentration in the HN restaurant sample compared to the other three restaurant samples. These two metals can be released from freshwater fish (Yang et al. Citation2014), which is the most common food cooked in an HN restaurant.
Table 3. Average concentrations of trace elements in the PM10 samples collected from the four restaurants.
It is apparent that cooking is an important source of metal exposure to humans. The element concentrations measured in this study were compared with those set by current regulations, advisories, and guidelines. In this study, Pb levels did not exceed the health regulations and guidelines of WHO AQG or European Commission air quality standards (Pb = 500 ng/m3) (WHO Citation2006; European Commission Citation2008). The concentrations of As in the fumes of GD (As = 6.05 ng/m3) and HN (As = 6.82 ng/m3) restaurants and the concentration of Cd in the fumes from the SC (5.32 ng/m3) and HN (7.79 ng/m3) restaurants exceed the European Commission Air quality standards (As = 6 ng/m3, Cd = 5 ng/m3). However, the concentrations of As and Cd only slightly exceeded the standards and may be lower in actual situations due to the dilution effect of air. Therefore, these metals may have minimal health effects on humans who are exposed to the measured concentrations. Other trace elements (e.g., Zn, Mg, Fe, Cu, V, Cr, and Ti) did not exceed any of the mentioned health regulations and guidelines.
In addition, the GD samples had the lowest amount of Cu; this observation is consistent with the SEM-EDS result that the number of flocculent particles in the GD restaurant sample was significantly lower than that in the other three restaurant samples, because many flocculent particles contained Cu. It should be noted that no individual trace-element-rich particles were observed in this study. The EDS analysis showed that most trace elements, such as Zn, Cu, and Fe, were primarily concentrated in the C-rich particles with flocculent morphologies and Si-rich particles with flat shapes. Some of the Ca-S rich particles and spheroidal particles also contained Fe and Zn. Since most trace metals were enriched in these three types of particle, especially the flocculent and flat particles, these particles may affect human health. However, the flat particles were always in lager size (>2.5 μm) while over 50% flocculent particles were in the size class of <2.5 μm, the flocculent particles may have more health implications on humans.
The major limitation of this paper is that SO2 from gas combustion may have influence on the formation of Ca-S particles, and the results may be less accurate for estimating pollutant concentrations. However, the SO2 levels were low and the four restaurants all used gas cooking methods, it is adept to capture the difference of PM composition among restaurants, and we will focus on this question in future studies.
Another limitation is that the influence of cooking methods on PM morphology was not sufficiently detailed, and four other Chinese cooking styles were not studied. In future studies, we plan to conduct two series of experiments to determine how cooking styles and methods affect the PM morphology.
4. Conclusion
This study focused on a chemical and morphological examination of PM10 and PM2.5 in cooking fumes from four Chinese restaurants. There were six types of particles with different morphologies in the cooking fumes from the four restaurants: rectangular, flocculent, flat, irregular, spheroidal and spherical. The most abundant PM was rectangular, followed by flocculent, flat, and irregular, and spheroidal and spherical were the least abundant.
In contrast to other PM sources, the PM emitted from cooking had primarily had Ca-rich, C-rich, and Si-rich particles. No individual trace-element-rich particles were observed. The rectangular and spheroidal particles were Ca-rich particles, the C-rich particles were always in flocculent and spherical shapes and the flat and irregular particles were Si-rich particles. Chinese cooking style may be an important source of rectangular Ca rich particles in the atmosphere.
Different cooking styles and methods influenced the number of particles with different morphologies. The restaurants that used more water-based cooking methods emitted more Ca-S particles with rectangular shapes. However, C-rich particles with spherical shapes were more abundant in cooking fumes from restaurants that use oil-based cooking methods, and flocculent and spheroidal-shaped particles were closely related to roasting.
The trace elements were primarily concentrated in C-rich particles with flocculent morphologies and Si-rich particles with flat shapes. Since over 50% flocculent particles were in the size class of <2.5 μm, the flocculent particles may have more health implications on humans.
Supplemental data for this article is available online at https://doi.org/10.1080/02786826.2019.1645292.
Download MS Word (592.6 KB)Additional information
Funding
Related Research Data
References
- Abdullahi, K. L., J. M. Delgado-Saborit, and R. M. Harrison. 2013. Emissions and indoor concentrations of particulate matter and its specific chemical components from cooking: a review. Atmos. Environ. 71 (2):260–294.
- Alves, C., A. Vicente, C. Pio, G. Kiss, A. Hoffer, S. Decesari, A. S. H. Prevôt, M. C. Minguillón, X. Querol, R. Hillamo, G. Spindler, and E. Swietlicki. 2012. Organic compounds in aerosols from selected European sites—biogenic versus anthropogenic sources. Atmos. Environ. 59:243–255.
- Aragon-Piña, A.,. G. Torres, M. Monroy, A. Luszczewski, and R. Ramos. 2000. Scanning electron microscope and statistical analysis of suspended heavy metal particles in San Luis potosí, Mexico. Atmos. Environ. 34 (24):4103–4112. doi: 10.1016/S1352-2310(99)00526-9.
- Aragon-Piña, A., A. A. Campos-Ramos, R. Leyva-Ramos, M. HernandezOrta, N. Miranda-Ortiz, and A. Luszcewki-Kundra. 2006. Ambient. Influence of industrial emissions on the atmospheric aerosol of San Luis Potosi. Mexico. Rev. Int. Contam. Ambient 22:5–19.
- Barone, T. L., and Y. Zhu. 2008. The morphology of ultrafine particles on and near major freeways. Atmos. Environ. 42 (28):6749–6758. doi: 10.1016/j.atmosenv.2008.05.019.
- Breed, C. A., J. M. Arocena, and D. Sutherland. 2002. Possible sources of PM10 in prince george (Canada) as revealed by morphology and in situ chemical composition of particulate. Atmos. Environ. 36 (10):1721–1731. doi: 10.1016/S1352-2310(01)00500-3.
- Bond, T. C., and R. W. Bergstrom. 2006. Light absorption by carbonaceous particles: an investigative review. Aerosol Sci. Technol. 40 (1):27–67. doi: 10.1080/02786820500421521.
- Buonanno, G., L. Morawska, and L. Stabile. 2009. Particle emission factors during cooking activities. Atmos. Environ. 43 (20):3235–3242. doi: 10.1016/j.atmosenv.2009.03.044.
- Buonanno, G., G. Johnson, L. Morawska, and L. Stabile. 2011. Volatility characterization of cooking-generated aerosol particles. Aerosol Sci. Technol. 45 (9):1069–1077. doi: 10.1080/02786826.2011.580797.
- Campos-Ramos, A., A. Aragón-Piña, I. Galindo-Estrada, X. Querol, and A. Alastuey. 2009. Characterization of atmospheric aerosols by SEM in a rural area in the Western part of méxico and its relation with different pollution sources. Atmos. Environ. 43 (39):6159–6167. doi: 10.1016/j.atmosenv.2009.09.004.
- Chakrabarty, R. K., H. Moosmuller, M. A. Garro, W. P. Arnott, J. Walker, R. A. Susott, R. E. Babbitt, C. E. Wold, E. N. Lincoln, and W. M. Hao. 2006. Emissions from the laboratory combustion of Wildland fuels: Particle morphology and size. J. Geophys. Res. 111 (D7). doi: 10.1029/2005JD006659.
- Chen, L. W. A., J. G. Watson, J. C. Chow, and K. L. Magliano. 2007. Quantifying PM2.5 source contributions for the San Joaquin valley with multivariate receptor models. Environ. Sci. Technol. 41:2818–2826. doi: 10.1021/es0525105.
- Chen, Y., Z. Lin, L. Xu, and S. Guo. 2011. Effects of different preparation of soymilk on the quality of tofu. Soybean Sci. 30:838–842 (in Chinese).
- Conner, T. L., G. A. Norris, M. S. Landis, and R. W. Williams. 2001. Individual particle analysis of indoor, outdoor, and community samples from the 1998 Baltimore particulate matter study. Atmosp. Environ. 35 (23):3935–3946. doi: 10.1016/S1352-2310(01)00191-1.
- European Commission. 2008. Air quality standards. European Commission, Germany, Belgium. http://ec.europa.eu/environment/air/quality/standards.htm.
- González, L. T., F. E. L. Rodríguez, M. Sánchez-Domínguez, C. Leyva-Porras, L. G. Silva-Vidaurri, K. Acuna-Askar, B. I. Kharisov, J. F. Villarreal Chiu, and J. M. Alfaro Barbosa. 2016. Chemical and morphological characterization of TSP and PM2.5 by SEM–EDS, XPS and XRD collected in the metropolitan area of Monterrey, Mexico. Atmos. Environ 143:249–260. doi: 10.1016/j.atmosenv.2016.08.053.
- González, L. T., F. E. Longoria Rodríguez, M. Sánchez-Domínguez, A. Cavazos, C. Leyva-Porras, L. G. Silva-Vidaurri, K. A. Askar, B. I. Kharissov, J. F. Villarreal Chiu, and J. M. Alfaro Barbosa. 2017. Determination of trace metals in TSP and PM2.5 materials collected in the metropolitan area of Monterrey, Mexico: a characterization study by XPS, ICP–AES and SEM–EDS. Atmos. Res 196 :8–22. doi: 10.1016/j.atmosres.2017.05.009.
- González, L. T., F. E. Longoria-Rodríguez, M. Sánchez-Domínguez, C. Leyva-Porras, K. Acuña-Askar, B. I. Kharissov, A. Arizpe-Zapata, and J. M. Alfaro-Barbosa. 2018. Seasonal variation and chemical composition of particulate matter: a study by XPS, ICP-AES and sequential microanalysis using Raman with SEM/EDS. J. Environ. Sci. 74:32. S1001074217331546. doi: 10.1016/j.jes.2018.02.002.
- Huffman, J. A., K. S. Docherty, C. Mohr, M. J. Cubison, I. M. Ulbrich, P. J. Ziemann, T. B. Onasch, and J. L. Jimenez. 2009. Chemically-resolved volatility measurements of organic aerosol from different sources. Environ. Sci. Technol. 43:5351–5357. doi: 10.1021/es803539d.
- Kim, D. S., P. K. Hopke, D. L. Massart, L. Kaufman, and G. S. Casuccio. 1987. Multivariate analysis of CCSEM auto emission data. Sci. Total Environ. 59:141–155. doi: 10.1016/0048-9697(87)90438-4.
- Kumar, R., P. K. Srivastava, and S. P. Srivastava. 1994. Leaching of heavy metals (Cr, Fe, and Ni) from stainless steel utensils in food simulants and food materials. Bullet. Environ. Contamin. Toxicol. 53 (2):259–266. doi: 10.1007/BF00192042.
- Lai, S. C., K. F. Ho, Y. Y. Zhang, S. C. Lee, Y. Huang, and S. C. Zou. 2010. Characteristics of residential indoor carbonaceous aerosols: a case study in Guangzhou, Pearl River Delta region. Aerosol Air Qual. Res. 10 (5):472–478. doi: 10.4209/aaqr.2010.05.0037.
- Lazaridis, M., V. Aleksandropoulou, J. Smolík, J. E. Hansen, T. Glytsos, N. Kalogerakis, and E. Dahlin. 2006. Physico-chemical characterization of indoor/outdoor particulate matter in two residential houses in Oslo, Norway: measurements overview and physical properties e URBAN-AEROSOL project. Indoor Air. 16 (4):282–295. doi: 10.1111/j.1600-0668.2006.00425.x.
- Lee, S. C., W. M. Li, and L. Y. Chan. 2001. Indoor air quality at restaurants with different styles of cooking in metropolitan Hong Kong. Sci. Total Environ. 279 (1–3):181–193.
- Li, W., and L. Y. Shao. 2009. Transmission electron microscopy study of aerosol particles from the brown hazes in Northern China. J. Geophys. Res 114 (D9):1–10. doi: 10.1029/2008JD011285.
- Massey, D., A. Kulshrestha, J. Masih, and A. Taneja. 2012. Seasonal trends of PM10, PM5.0, PM2.5 & PM1.0 in indoor and outdoor environments of residential homes located in North-Central India. Build. Environ. 47:223–231. doi: 10.1016/j.buildenv.2011.07.018.
- McDonald, J. D., B. Zielinska, E. M. Fujita, J. C. Sagebiel, J. C. Chow, and J. G. Watson. 2003. Emissions from charbroiling and grilling of chicken and beef. J. Air Waste Manage. Assoc. 53 (2):185–194.
- Hand, J. L., W. C. Malm, A. Laskin, D. Day, T. Lee, C. Wang, C. Carrico, J. Carrillo, J. P. Cowin, J. Collett, and M. J. Iedema. 2005. Optical, physical, and chemical properties of tar balls observed during the Yosemite Aerosol Characterization Study. J. Geophys. Res. 110 (D21):168–179. doi: 10.1029/2004JD005728.
- He, L. Y., M. Hu, X. F. Huang, B. D. Yu, Y. H. Zhang, and D. Q. Liu. 2004. Measurement of emissions of fine particulate organic matter from Chinese cooking. Atmos. Environ. 38 (38):6557–6564. doi: 10.1016/j.atmosenv.2004.08.034.
- Onodera, Y., T. Ono, K. Nakasato, and K. Toda. 2009. Homogeneity and microstructure of tofu depends on 11S/7S globulin ratio in soymilk and coagulant concentration. Food Sci. Technol. Res. 15 (3):265–274. doi: 10.3136/fstr.15.265.
- Pósfai, M., J. R. Anderson, P. R. Buseck, and H. Sievering. 1999. Soot and sulfate aerosol particles in the remote marine troposphere. J. Geophys. Res. 104 (D17):685–693. 21,doi: 10.1029/1999JD900208.
- Pósfai, M., A. Gelencse, R. Simonics, R. K. Arato, J. Li, P. V. Hobbs, and P. R. Buseck. 2004. Atmospheric tar balls: Particles from biomass and biofuel burning. J. Geophys. Res. 109 (D6). doi: 10.1029/2003JD004169.
- Robinson, A. L., R. Subramanian, N. M. Donahue, A. Bernardo-Bricker, and W. F. Rogge. 2006. Source apportionment of molecular markers and organic aerosol. 3. Food cooking emissions. Environ. Sci. Technol. 40 (24):7820–7827. doi: 10.1021/es060781p.
- Rogge, W. F., L. M. Hildemann, M. A. Mazurek, G. R. Cass, and B. R. T. Simoneit. 1991. Sources of fine organic aerosol. 1. Charbroilers and meat cooking operations. Environ. Sci. Technol 25 (6):1112–1125. doi: 10.1021/es00018a015.
- Rogge, W. F., L. M. Hildemann, M. A. Mazurek, G. R. Cass, and B. R. T. Simoneit. 1993. Sources of fine organic aerosol. 5. Natural gas home appliances. Environ. Sci. Technol. 27 (13):2736–2744. doi: 10.1021/es00049a012.
- Schulze, D. G. 1989. An introduction to soil mineralogy. In: Minerals in soil environments. ed. J. B. Dixon, and S. B. Weed, 2nd ed., p. 1 (SSSA Book Series No. 1). Madison, WI: Soil Science Society of America.
- See, S. W., and R. Balasubramanian. 2006a. Emissions of ultrafine particles from different gas cooking methods. Aerosol Air Quality Res. 6 (1):82–92. doi: 10.4209/aaqr.2006.03.0007.
- See, S. W., and R. Balasubramanian. 2006b. Risk assessment of exposure to indoor aerosols associated with Chinese cooking. Environmental res. 102 (2):197–204. doi: 10.1016/j.envres.2005.12.013.
- See, S. W., and R. Balasubramanian. 2008. Chemical characteristics of fine particles emitted from different gas cooking methods. Atmos. Environ. 42 (39):8852–8862. doi: 10.1016/j.atmosenv.2008.09.011.
- Shipley, R. E., G. Peishi, and Y. Qing. 2018. Restaurant impacts on outdoor air quality: Elevated organic aerosol mass from restaurant cooking with Neighborhood-Scale plume extents. Environ. Sci. Technol. 52 (16):9285–9294. doi: 10.1021/acs.est.8b02654.
- Stearns, R. C., J. D. Paulauskis, and J. J. Godleski. 2001. Endocytosis of ultrafine particles by A549 cells. Am. J. Resp. Cell Mol. Biol. 24 (2):108–115. doi: 10.1165/ajrcmb.24.2.4081.
- Susaya, J., K.-H. Kim, J.-W. Ahn, M.-C. Jung, and C.-H. Kang. 2010. BBQ charcoal combustion as an important source of trace metal exposure to humans. J. Hazard. Mater. 176 (1–3):932–937. doi: 10.1016/j.jhazmat.2009.11.129.
- Wan, M.-P., C.-L. Wu, G.-N. Sze To, T.-C. Chan, and C. Y. H. Chao. 2011. Ultrafine particles, and PM2.5 generated from cooking in homes. Atmos. Environ. 45 (34):6141–6148. doi: 10.1016/j.atmosenv.2011.08.036.
- Wang, Y. P., and C. C. Chao. 1992. Effects of vesicular arbuscular mycorrhizae and heavy metals on the growth of soybean and phosphate and heavy metal uptake by soybean in major soil groups of Taiwan. J. Agric. Assoc. China. 157:6–20.
- Wang, J., Z. Hu, Y. Chen, Z. Chen, and S. Xu. 2013. Contamination characteristics and possible sources of PM10 and PM2.5 in different functional areas of shanghai, China. Atmos. Environ. 68:221–229. doi: 10.1016/j.atmosenv.2012.10.070.
- Wen, M. T., and M. Hu. 2007. Physical and chemical characteristics of fine articles emitted from cooking emissions and its contribution to articulate organic matter in Beijing. Environ. Sci. 28:2620–2625 (in Chinese).
- WHO. 2006. Air Quality Guidelines for Particulate Matter, Ozone, Nitrogen Dioxide and Sulfur Dioxide. Geneva, Switzerland: World Health Organization. https://apps.who.int/iris/bitstream/handle/10665/69477/WHO_SDE_PHE_OEH_06.02_eng.pdf.
- Wilkinson, K., J. Lundkvist, G. Seisenbaeva, and V. Kessler. 2011. New tabletop SEM-EDS-based approach for cost-efficient monitoring of airborne particulate matter. Environ. Pollut 159 (1):311–318. doi: 10.1016/j.envpol.2010.08.024.
- Yang, J., X. S. Guo, M. Ten, Y. W. Yao, and Q. Fu. 2014. A review of atmospheric fine particulate matter associated trace metal pollutants in China. Environ. Chem. 33:1514–1521 (in Chinese).
- Yue, W., X. Li, J. Liu, Y. Li, X. Yu, B. Deng, T. Wan, G. Zhang, Y. Huang, W. He, W. Hua, L. Shao, W. Li, and S. Yang. 2006. Characterization of PM2.5 in the ambient air of Shanghai city by analyzing individual particles. Sci. Total Environ. 368 (2–3):916–925. doi: 10.1016/j.scitotenv.2006.03.043.
- Zhao, W. X., P. K. Hopke, E. W. Gelfand, and N. Rabinovitch. 2007. Use of an expanded receptor model for personal exposure analysis in schoolchildren with asthma. Atmospheric Environment 41 (19):4084–4096. doi: 10.1016/j.atmosenv.2007.01.037.
- Zhao, Y., M. Hu, S. Slanina, and Y. Zhang. 2007. Chemical compositions of fine particulate organic matter emitted from Chinese cooking. Environ. Sci. Technol. 41 (1):99–105. doi: 10.1021/es0614518.