
 ?Mathematical formulae have been encoded as MathML and are displayed in this HTML version using MathJax in order to improve their display. Uncheck the box to turn MathJax off. This feature requires Javascript. Click on a formula to zoom.
Abstract
Bioaerosols collected in a liquid-based sampler can be re-aerosolized into the airflow during collection and lost or concentrated in the collection fluid and overestimated during the subsequent analyses. Very little information is available concerning the specific impact on bioaerosol quantification and diversity and wrong evaluation of pathogens or potentially harmful microorganisms concentration could lead to incorrect data interpretation and inaccurate exposure risk assessment. The aim of this two-part study was to better understand how evaporation impacts the results obtained from liquid-based samplers. Bacterial consortium was spiked in the collection vessels of the Coriolisµ® and the BioSampler® and the bacterial concentration was monitored after running the samplers in vitro. Relative ratios of the bacteria were analyzed using qPCR (before/after). A field study in which liquid-based air samplers in a natural environment were compared to filter-based samplers was performed. This allowed for the relative characterization of either concentration or the re-aerosolization between the two samplers using high throughput sequencing methods. Amongst the four strains of bacteria examined in vitro, results suggest differential behavior between concentration or re-aerosolization from the liquid. Re-aerosolization of bacteria is difficult to predict as the cell-surface hydrophobicity, the liquid-based air sampler and its flowrate can influence it. The sequencing results from field samples confirmed the loss of entire genera by re-aerosolization (Brevundimonas, Clostridium, Mycobacterium, and Smithella) out of the BioSampler® while concentration of several other genera were reduced (Bradyrhizobium, Delftia, Propionibacterium, and Sphingomonas). These observations suggest that evaporation in liquid samplers might lead to over- or underestimation of the prevalence of some genera.
Copyright © 2019 American Association for Aerosol Research
EDITOR:
Introduction
Air is a highly complex environment to sample compared to soil or water, where biomass is more abundant (Whitman, Coleman, and Wiebe Citation1998; van der Heijden, Bardgett, and van Straalen Citation2008; Burrows et al. Citation2009; Yooseph et al. Citation2013; Bouchez et al. Citation2016). Since biomass in the air can be diluted, volumetric air sampling is the most effective approach for collecting and concentrating bioaerosols. Volumetric air sampling occurs when a known volume of air is captured at a specific flowrate, enabling the airborne particulates to be retrieved using various media such as liquid buffers, culture media or filters. The hope is that air samplers collect microbes leading to quantification and diversity analyses with as little bias as possible.
Several air samplers are currently available on the market. These samplers use various capture flowrates and capture mechanisms including inertial impactors, impingers, cyclones, and filters. The choice of sampling device and strategy is mainly related to their intended applications and must consider the advantages and weaknesses associated with the sampling principles (Thorne et al. Citation1992; Grinshpun et al. Citation1997; Pahl et al. Citation1997; Willeke, Lin, and Grinshpun Citation1998; Lin et al. Citation1999; Lin et al. Citation2000; Duchaine et al. Citation2001; Agranovski et al. Citation2002, Citation2005; Yao et al. Citation2009; Zhen et al. Citation2009; Coccia et al. Citation2010; Kesavan, Schepers, and McFarland Citation2010; Griffin et al. Citation2011; Springorum, Clauß, and Hartung 2011; Yamamoto et al. Citation2011; Han and Mainelis Citation2012; Sanchez-Munoz et al. Citation2012; Su et al. Citation2012; Dybwad, Skogan, and Blatny Citation2014; Amato et al. Citation2015; Kesavan and Sagripanti Citation2015; Wubulihairen et al. Citation2015; Haig et al. Citation2016; Yu et al. Citation2016). For example, high flowrates used with a filter-based sampler could be inappropriate for culture-based approaches but might be effective for molecular-based studies.
Because liquid samplers are gentler on microbial cell integrity and result in higher microbial viability, they are better suited for cultivability assays of various microorganisms such as bacteria, molds, and even viruses. They also allow dilution of the sample prior to plate count, microscopy, or cell count analyses (Juozaitis et al. Citation1994; Terzieva et al. Citation1996; Lin et al. Citation1999; Agranovski et al. Citation2002; Hogan et al. Citation2005; Hermann et al. Citation2006; Rule et al. Citation2007; Verreault, Moineau, and Duchaine Citation2008; Coccia et al. Citation2010; Riemenschneider et al. Citation2010; Griffin et al. Citation2011; King and McFarland Citation2012; Ahmed, Schulz, and Hartung Citation2013; Dybwad, Skogan, and Blatny Citation2014; West and Kimber Citation2015; Zheng and Yao Citation2017). Liquid-based samplers are also compatible with molecular analyses such as specific detection and quantification by qPCR or high throughput sequencing analyses (An, Mainelis, and White Citation2006; Cayer et al. Citation2007; Kim et al. Citation2011; Yamamoto et al. Citation2011; Lecours et al. Citation2012; Dybwad, Skogan, and Blatny Citation2014; Hoisington et al. Citation2014; Bonifait et al. Citation2017; Mbareche et al. Citation2017a, Citation2017b, Citation2018a, Citation2018b; Veillette, Mbareche, and Dion-Dupont Citation2017; Brisebois et al. Citation2018; Zhen et al. Citation2018). Indeed, widely used air samplers like the swirling impinger BioSampler® (SKC Inc., Eighty-Four, PA, USA) and the cyclonic impactor Coriolisµ® (Bertin Technologies, Montigny-le-Bretonneux, France) both share the benefits specific to liquid-based samplers. The BioSampler® has three nozzles tangentially oriented from its collection vessel. These nozzles dictate the flowrate through the critical orifices and create a swirling motion that collects bioaerosols in the collection fluid (Willeke, Lin, and Grinshpun Citation1998; Lin et al. Citation1999, Citation2000; Dungan and Leytem Citation2016). The Coriolisµ® aspirates air in a conical vessel where it creates a vortex in the collection fluid where the bioaerosols are collected by centrifugal motion (Carvalho et al. Citation2008; Gomez-Domenech et al. Citation2010; Langer et al. Citation2012). Furthermore, the BioSampler® and Coriolisµ® can sample over long time periods, which allows for the recovery of large volumes of air and microorganisms (Willeke, Lin, and Grinshpun Citation1998; Carvalho et al. Citation2008; Gomez-Domenech et al. Citation2010). However, a recent study reported large dissimilarities in the assessments of microbiota using 16S rDNA sequencing when liquid samplers were compared with electret filters (Veillette, Mbareche, and Dion-Dupont Citation2017; Mbareche et al. Citation2018a). The reasons behind this discrepancy could not be explained.
Various factors such as temperature, relative humidity and bacterial cell behavior in liquid may influence their response and thus, the consequent diversity sampled using liquid-based samplers. Liquid samplers always exhibit a loss of collection fluid during the sampling period (Henningson and Ahlberg Citation1994; Lin et al. Citation1997; Willeke, Lin, and Grinshpun Citation1998; Lin et al. Citation1999; Agranovski et al. Citation2002). This loss of liquid and its impact on the loss of specific microorganisms has never been addressed. This phenomenon associated with liquid samplers could lead to the loss of microorganisms by re-aerosolization (Grinshpun et al. Citation1997; Willeke, Lin, and Grinshpun Citation1998; Lin et al. Citation1999; Agranovski et al. Citation2002; Riemenschneider et al. Citation2010; Griffin et al. Citation2011; Springorum, Clauß, and Hartung Citation2011; Han and Mainelis Citation2012). Re-aerosolization occurs when microorganisms already harvested in the collection fluid are re-aerosolized in the airflow and lost, leading to an underestimation of biodiversity and biomass.
A recent study suggested that droplets produced by bubbles from liquid that has been artificially contaminated with bacteria have different behaviors than those produced from clean water (Poulain and Bourouiba Citation2018). This leads to the conclusion that the possible impacts of re-aerosolization on results can be significant if a population or a type of microorganism is completely or partially lost during sampling. Underestimating the concentration of a pathogen or a potentially harmful microorganism could be damaging, and inaccurate evaluations of microbiota or biodiversity could impair our understanding of the role of bioaerosols in health effects.
The aims of this study were to 1) evaluate re-aerosolization in two widely used liquid samplers spiked with known bacterial consortia and 2) evaluate evaporation and subsequent re-aerosolization induced bias in a natural environment by comparing liquid and filter samplers.
Material and methods
In vitro experiments
Air samplers
Two liquid samplers were tested in this study, the Coriolisµ® and the BioSampler®. The Coriolisµ® was tested at 100 L/min and 200 L/min for 10 min while the BioSampler® airflow was set at 12.5 L/min and was used for 20 min of sampling. The Coriolisµ® and BioSampler® collection vessels were filled with 15 and 20 mL of PBS (sodium phosphate buffer), respectively.
Experimental design
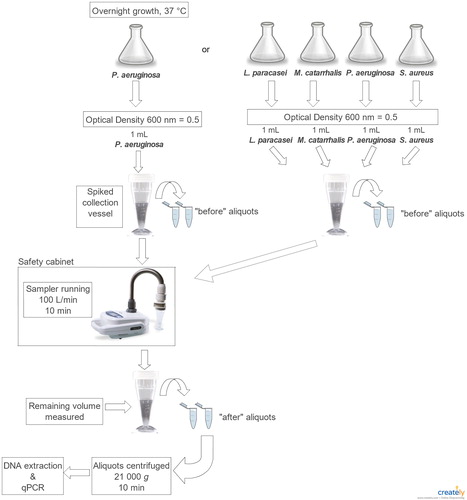
The collection vessels of the Coriolisµ® and BioSampler® were each spiked with a bacterial suspension prior to being run in a sterile environment (level 2 safety cabinet, type A2, Nu-Aire, MN, USA). Quantitative PCR was used to assess bacterial strains and total genome concentration before and after sampling. The concentration of a given bacterial strain in the collection fluid was compared before and after sampling to determine if re-aerosolization (loss) or concentration (increase) had occurred beyond the amount associated with normal evaporation. Five conditions were tested consisting of each one of the four chosen bacteria alone and the consortium (). Five replicates of each condition were performed.
Figure 1. Experimental protocol for sampling each of the four bacteria strains and the bacterial consortium using Coriolisµ® and the BioSampler®.
Bacteria growth and preparation for experiments
The four bacteria used in this study were Lactobacillus paracasei, Moraxella catarrhalis, Pseudomonas aeruginosa, and Staphylococcus aureus (). These bacteria were chosen because they represent a mixed population of Gram negative and positive bacteria as well as a mixture of rod- and coccus-shaped bacteria. Cell surface hydrophobicity was evaluated for each strain using a test based on adsorption to n-hexadecane as described by Rosenberg, Gutnick, and Rosenberg (Citation1980). Auto-aggregation capacity was also measured for each strain as described by Malik et al. (Citation2003).
Table 1. Bacterial strains included in this study.
L. paracasei, M. catarrhalis, P. aeruginosa, and S. aureus were grown as described in Perrott et al. (Citation2017), except that the cells were not washed before dilution. The optical density of each overnight culture was measured at 600 nm using a GeneQuant pro spectrometer (model 80-2114-98, GE Healthcare Biosciences, Buckinghamshire, England). Cultures were diluted with PBS to obtain an OD600 of 0.5 (approximately 1 × 10⁷ cells/mL).
First, each of the strains was tested alone. One milliliter of suspension was added to the collection fluid of each of the liquid samplers and vortexed. Aliquots (2 × 1.5 mL) were collected to represent “before sampling” conditions before the sampler was turned on. At the end of the running time, the residual volume of the collection fluid was measured and additional aliquots (2 x 1.5 mL) were collected to represent “after sampling” conditions (). The bacterial consortium was then tested, and one milliliter of each bacterial suspension was added to the collection fluid and vortexed. Next, the same “before” and “after” steps described above were completed (). Five replicates of each conditions were performed. After sampling, aliquots were centrifuged at 21,000 g for 10 min to concentrate the bacteria, then the supernatant was discarded, and the pellets were stored at –20 °C until DNA extraction. The experiments were repeated using the Coriolisµ® at 100 L/min and the BioSampler® with adding glycerol or sucrose to the collection fluid at a final concentration of 20% to determine if the composition of the fluid influences evaporation and re-aerosolization.
DNA extraction
DNA from the “before” and “after” aliquots as well as from the stock bacterial culture was extracted using a DNeasy PowerLyzer PowerSoil kit (Mississauga, ON, Canada) following the manufacturer’s instructions. Homogenization was performed with a Mixer Mill MM301 (Retsch, Düsseldorf, Germany) at 30 movements per minute for 15 min. DNA was eluted with 100 µl elution buffer supplied with the kit. Extracted DNA samples were stored at –20 °C until further analysis.
Quantitative PCR
Specific PCR amplifications of the four DNA strains were performed according to a previous study (Perrott et al. Citation2017). In addition, total bacteria amplification (Universal primers) was performed on the bacterial consortium samples (). Triplicates of each sample were used for quantification. Standard curves were prepared with 10-fold dilutions of genomic DNA specific to the assay. Results were analyzed using Bio-Rad CFX Manager software version 3.0.1224.1015 (Bio-Rad Laboratories).
Table 2. Primers and probes used in this study.
Data analysis
For each sample, the quantified number of genome copies for each strain per milliliter was used to calculate relative ratios (RR): the number of genome copies from the “after sampling” group divided by the number of genome copies from the “before sampling” group. As an example, the calculation of the relative ratio of P. aeruginosa is presented in EquationEquation (1)(1)
(1) .
(1)
(1)
The same calculation was performed for total bacteria with total genome copies. These relative ratios indicate if the bacteria are re-aerosolized from the collection fluid during sampling (RR < 1) or if they are concentrated only because of evaporation of the collection fluid (RR > 1). The same concentration of bacteria before and after (RR = 1) sampling indicates that the sampling and liquid evaporation processes do not affect the bacteria.
Field sampling experiments
Air samplers
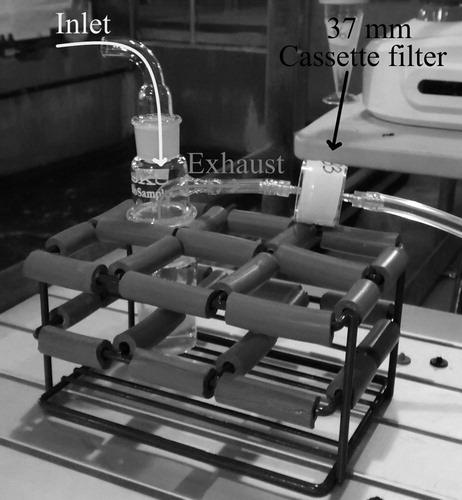
Liquid samplers were compared to filter samplers and one liquid sampler was connected to a filter at its outlet to evaluate the loss by re-aerosolization during evaporation. No significant loss is expected using filter samplers, as there is no liquid evaporation. The liquid samplers used in the experiment were the Coriolisµ® (high flowrate), sampling at 200 L/min for 10 min (2m3 of air), and the BioSampler® (low flowrate) connected to a pump (Gilian AirCon-2 Area Air Sampling Pump, Florida, United States), sampling at 12.5 L/min for 15 min (0.25 m3 of air). The Coriolisµ® and the BioSampler® collection vessels contained respectively 15 mL and 20 mL of sterile and filtered PBS. In addition, closed-face cassettes (37 mm) were connected at the exhaust of the BioSampler® (between the BioSampler® and the pump) to collect any microorganisms that might be re-aerosolized during evaporation (). The filter samplers used in this study were the SASS 3100 (high flowrate) (Research International, Inc., Monroe, WA), sampling at 300 L/min for 7 min and SKC 37 mm closed-face cassettes (low flowrate) (SKC Inc, Quebec, Canada), connected to a Gilian AirCon-2 pump set out at 12.5 L/min for 15 min. The 37 mm cassettes were loaded with 0.8 µm polycarbonate filter. Three sampling campaigns were performed during which five replicates were collected.
Figure 2. The 37 mm cassette filter connected to the BioSampler®.
Sampling setup
The sampling was performed in a wastewater treatment center (WTC) in Eastern Canada during the summer because this type of environment is known to contain significant bacterial bioaerosols. The four air samplers were placed 1 m above the floor in the area where grit removal takes place. All four samplers collected air simultaneously. Five replicates were taken per day and the WTC was visited three times.
Sample processing
Samples were kept on ice until arrival at the laboratory. The remaining volume of collection fluids were recorded and transferred to a sterile 50 mL conical tube and stored at 4 °C with the filters and the cassettes until the following day. The SASS 3100 filters were eluted in 5 mL of SASS Extraction Fluid with the SASS Particle Extractor (model 3010, Research International, Inc., Monroe, WA) according to the manufacturer’s instructions. The 37 mm cassettes were eluted by filling the cassettes with 3 mL of SASS Extraction Fluid and placed on an orbital shaker (model 260301F, Fisher Scientific Boekel Ocelot Shaker, Ottawa, Canada) at room temperature for 30 min. After each cassette was disassembled, an 1.5 mL aliquot was collected. Aliquots (1.5 mL) of the liquid samples and of the eluted filters from the SASS 3100 were collected and all air samples were centrifuged at 21,000 g for 10 min.
Quantitative PCR for total bacteria
See for details.
Miseq illumina sequencing, bioinformatics workflow and data analysis
The PCR-amplified 16S rDNA from the various samples were submitted to the Plateforme d’anlayses génomiques de l’Institut de Biologie Intégrative et des Systèmes (IBIS, Univeristé Laval). Sequencing protocols are described in detail in Comeau et al. (Citation2011).
The bioinformatics analyses used in this study are based on the workflow developed by Mbareche et al. (Citation2018a). An additional step was necessary for demultiplexing the raw FASTQ files where each sequence was grouped by the sample it came from, and the reads generated from the paired-end sequencing were combined using mothur v1.35.1 (Schloss et al. Citation2009). The sequences were filtered with mothur software (mothur.org) to get rid of homopolymers, ambiguous sequences and abnormal sequence lengths (too long or too short). Identical sequences were put together with VSEARCH (version 2.10.4) to reduce the file size and lighten the computational burden. QIIME was used to align the obtained sequences with the SILVA ribosomal reference database (Caporaso et al. 2010). The sequences were clustered into Operational Taxonomic Units (OTUs) using the UPARSE method implemented in VSEARCH with a cutoff of 97% similarity (Rognes et al. Citation2016). Identification and removal of chimeras were performed with UCHIME (Edgar et al. Citation2011). QIIME was used for the taxonomic assignment of OTUs using the 16S sequences from the SILVA database. In order to concentrate our effort on the core microbiome, OTUs that were present at least 10 times in the dataset were kept for the microbial diversity analyses. After constructing a metadata mapping file, the microbial diversity analyses, including the statistics were performed using QIIME scripts (http://qiime.org/scripts/).
Statistical analysis
The relative ratios were assessed using a two-way analysis of variance (two-way ANOVA) performed with GraphPad Prism 5 (GraphPad Software). The two variables were: the samplers (Coriolisµ® 100 L/min, Coriolisµ® 200 L/min and BioSampler®) and the conditions (each strain or the bacteria consortium). Bonferroni post-hoc tests were performed to compare replicate means. A one-way ANOVA was performed on the relative ratios for total bacteria for the bacterial consortium, followed by Turkey’s multiple comparison test. Differences were considered significant when the p-value < .05.
To determine the clustering of the samples a PCoA (Principal Coordinates Analysis) was performed. The statistical significance of the PCoA sample clustering was determined using a PERMANOVA (Permutational Multivariate Analyses of Variance). The test was applied on a Bray-Curtis dissimilarity matrix for the pairwise comparisons of samples. The statistical difference in the genera abundance between air samplers was determined by a Wilcoxon Rank Sum Test (n = 3). A p-value ≤ .05 was considered significantly different.
Data availability
Raw sequence reads of the samples used in this study have been deposited in the National Center for Biotechnology Information (NCBI) under BioProject PRJNA531492.
Results
In vitro experiments
Temperature and humidity
The different assays were performed from winter through summer. The temperature and relative humidity inside the laboratory in winter varied between 16.7 °C and 16.9 °C and 32.1% and 33.1%, respectively. During spring-summer, the temperature and relative humidity varied between 18.1 °C and 20.9 °C and 67.3% and 73.4%, respectively.
Percentage of collection fluid evaporation
Evaporation rates for the two samplers (Coriolisµ® and BioSampler®) were stable among replicates. The experiments were performed in summer for the BioSampler® and its evaporation rates varied from 7% to 13%. For the Coriolisµ® at 100 L/min, the evaporation rates varied between 9% and 19%. The discrepancies observed for Coriolisµ® might be because the experiments were performed in two different seasons, thus exposed to different levels of relative humidity. The percentage of evaporation observed for Coriolisµ® at 200 L/min varied between 33% and 39%.
Impact of running the spiked samplers on bacterial content
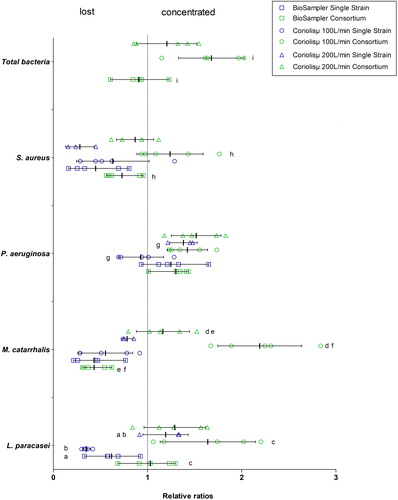
The relative ratios (RR) of the two conditions tested (single strain and bacterial consortium) for both samplers are shown in . The tendency of each strain was variable depending upon the condition and the sampler. S. aureus tended to be lost during sampling in almost all conditions, except in the bacterial consortium in the Coriolisµ® at both flowrates, where they tended to concentrate. The opposite tendency was observed for P. aeruginosa, which were concentrated in the collection liquid of both air samplers. Neither L. paracasei nor M. catarrhalis exhibited any clear trends, as they alternated between being lost and concentrated. The use of the Coriolisμ® resulted in more instances of total bacterial genome concentration while the BioSampler® led to more re-aerosolization (loss). The results of the experiments that included glycerol and sucrose were even more difficult to interpret and were not conclusive because of the randomness of the observed behaviors (data not shown).
Figure 3. Relative ratios of genome copy numbers of each single strain and the bacterial consortium when added to the BioSampler® and the Coriolisµ® collection fluid. The geometric forms represent each value of the relative ratio obtained for the five replicates (n = 5). The error bars represent standard deviation and the vertical bold lines represent the mean value of the relative ratios.
Sequencing from field assays
Summary of data processing
Fifty FASTQ files were generated and corresponded to the pair-end (forward and reverse) sequencing of 25 air samples. Initially, 854,254 sequences were generated. After quality filtering, dereplication and chimera checking, the resulting 226,545 sequences were clustered into 616 OTUs.
Alpha diversity: Richness and diversity indices
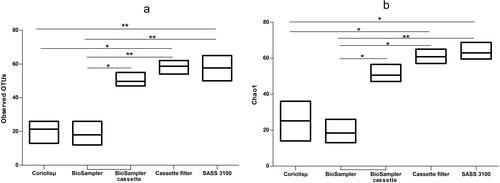
Alpha diversity was measured using two indices: observed OTUs and Chao1. Chao1 is a richness estimator where the calculation of the index takes into account the number of different OTUs in a sample. The higher the value of the index, the richer the sample. The observed OTUs index simply shows the number of different OTUs present in a sample; the higher the number of OTUs, the higher the bacterial diversity of the sample. shows the results of the comparisons of samples from the different air samplers used in the wastewater treatment facility. The four air samplers, Coriolisµ®, BioSampler®, SASS 3100 and cassette filter all sampled simultaneously. The samples collected with the filter-based samplers (cassette filter and SASS 3100) exhibited statistically greater species richness than those collected by liquid samplers (Coriolisµ® and BioSampler®). The alpha diversity determined from the BioSampler® cassette (collected re-aerosolized bacteria from the BioSampler®) was significantly greater than those from the liquid samplers (p-value < .05) but not from the SASS 3100 (p-value > .05). The alpha diversity from the cassette filter looked similar to the BioSampler® cassette but was significantly different (p-value < .05).
Figure 4. Comparisons of alpha-diversity metrics of observed OTUs (a) and Chao1 (b) for natural bioaerosols collected with two sampler types (liquid and filter). Each horizontal line in the boxes represents the minimum, the average and the maximum of the observed OTUs (n = 3).
Multivariate analysis
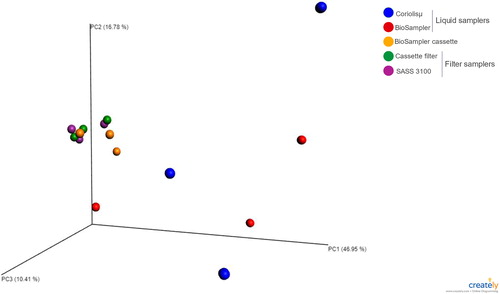
A multivariate analysis was conducted to determine the variation between the two types of air samplers (filter and liquid) used. Samples collected using each type of air sampler were compared using a PCoA, based on a Bray-Curtis dissimilarity metric (Ramette Citation2007; Mbareche et al. Citation2017b). shows the three principal-coordinate axes capturing 74% of the variation in the input data from the air samples. Samples were Colored according to the variable (air sampler) to better visualize clustering. Samples closer to each other were more similar than those farther apart. Sample grouping can be observed for filter-based samplers (cassette filter and SASS 3100), which are clustered close together. Samples from liquid-based samplers (Coriolisµ® and BioSampler®) were spread apart from the filter samplers and from each other. Samples from the BioSampler® cassette (which was a filter-based sampler) were clustering with the samples from other filter samplers.
Figure 5. Principal-coordinate analysis of air samples collected with two different types of air samplers.
Statistical significance of sample grouping
To determine the statistical significance of the sample grouping visualized with the PCoA analyses, a PERMANOVA (Permutational Multivariate Analysis of Variance) test was applied to the Bray-Curtis dissimilarity matrix. The PERMANOVA test is inspired by the ANOVA statistical test, but because it is a non-parametric test, it analyzes the variance and determines the significance using permutations. Whereas ANOVA/MANOVA (Analyses of Variance/Multivariate Analyses of Variance) assumes normal distributions, PERMANOVA is more appropriate for sequencing data where the type of distribution is hard to determine. The same variables that were used for grouping in the PCoA analyses were used for the PERMANOVA test. The results were consistent with the observations made from the PCoA analyses. The difference between the liquid and filter sample groupings had a p-value = .0001. As expected, the difference between samples from the two liquid samplers was statistically significant (p-value = .04).
Taxonomic analyses of natural bioaerosols samples
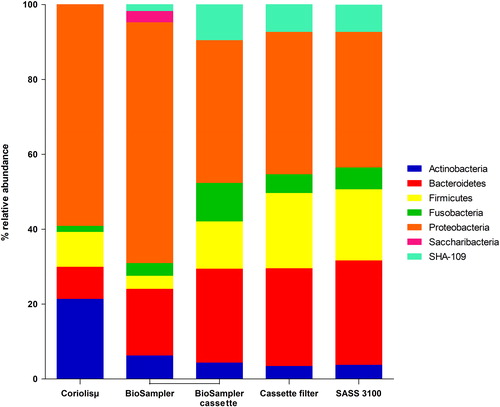
shows the most abundant phyla collected by the different air samplers used. Five or more phyla were collected by each of the air samplers and represented 94.2% of the total taxonomic profile: Proteobacteria (47.2%), Bacteroides (21.1%), Firmicutes (12.9%), Actinobacteria (7.80%), and Fusobacteria (5.20%). The relative abundances of the phyla collected by the filter-based samplers were similar. The phyla collected by the liquid-based samplers exhibited greater differences in the relative abundances and diversity of bacteria compared to the filter-based samplers. A comparison of the phyla and their relative abundances between the BioSampler® and its associated cassette (BioSampler® cassette) showed that most of the phyla collected in the BioSampler® were re-aerosolized at different rates and were captured by the cassette.
Figure 6. Relative abundance of the bacterial phyla collected using liquid- and filter-based samplers.
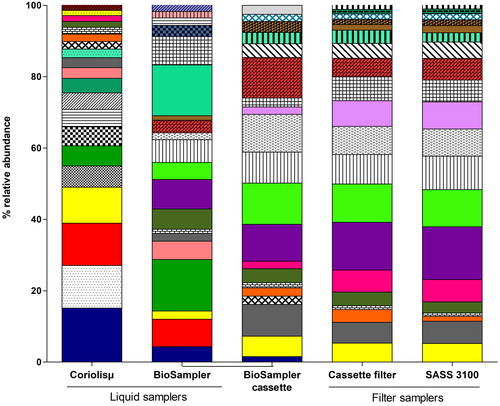
The taxonomic profiles of the genera demonstrated more obvious dissimilarities between the relative abundances of the bacteria collected. shows the 20 most abundant genera that were present in the liquid and filter samplers. These 20 genera represented more than 90% of all the genera captured by each air sampler: Coriolisµ® (90.4%), BioSampler® (95.6%), BioSampler® cassette (90.9%), cassette filter (94.2%), and SASS 3100 (96.0%). When identified to phyla, the taxonomic profiles from the filter samplers were similar. The cassette filter and the SASS 3100 shared the exact same 20 genera with almost the same percentages of relative abundances (). The cassette filter and the SASS 3100 collected other genera beyond the 20 must abundant (data not shown). The profiles of the liquid-based samplers were different from each other and from the filter-based samplers. There were more discrepancies than similarities between the profiles of the two liquid samplers. As shown in , the Coriolisµ® and the BioSampler® shared 8 of the 20 most abundant genera. The relative abundances of these 8 genera were very similar, except for Bradyrhizobium (p-value = .001), Paracoccus (p-value = .04), and Propionibacterium (p-value = .03). Bacillus, Campylobacter, Staphylococcus, and Corynebacteriaceae (uncultured) were only present in the collection fluid of the Coriolisµ® while Pantoea, Sphingopyxis, and Saccharibacteria (uncultured) were only present in the collection fluid of the BioSampler® (data not shown).
Figure 7. Relative abundances of bacterial genera collected using liquid and filter type samplers. (Please see supplemental information for a complete legend).
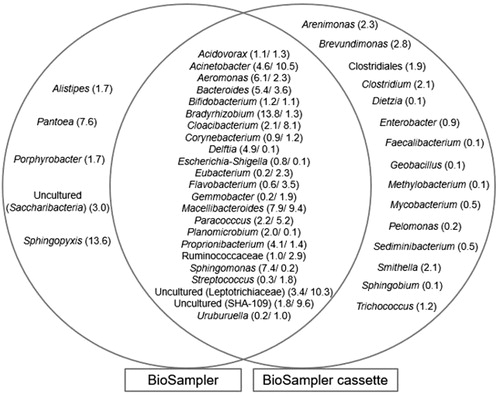
More thorough investigation of the profiles from the BioSampler® and its cassette (BioSampler® cassette), revealed that there is obvious re-aerosolization of some genera (partially or completely) from the collection fluid (). Among the 43 genera collected by the BioSampler® (), 23 were partially re-aerosolised from the collection fluid (found in the collection fluid of the BioSampler® as well as in the cassette connected to the sampler). Of those 23, only Bradyrhizobium (p-value = .001), Delftia (p-value = .05), Leptotrichiaceae (uncultured) (p-value = .01), Propionibacterium (p-value = .05), Sphingomonas (p-value = .04), and SHA-109 (uncultured) (p-value = .01) had statistically different abundances between samples from the BioSampler® and from its cassette. Fifteen were completely re-aerosolized from the sampler (not found in the collection fluid but present in the cassette). Mycobacterium spp, was completely re-aerosolized from the BioSampler® () and was not present in the collection fluid of the Coriolisµ® (data not shown). It was however successfully captured by the Cassette filter and the SASS 3100 (data not shown).
Figure 8. Venn diagram of the genera (relative abundance) collected by the BioSampler® and those re-aerosolized from the collection fluid captured by the BioSampler® cassette.
Discussion
This two-part study aimed to demonstrate the significant impact of aerosol sampler type on results. Liquid-based sampler results need careful examination since re-aerosolization and concentration are not well understood and seem to be influenced by multiple factors. The documented observations may be specific to this study and the presented hypotheses are based directly on the obtained results.
It has been previously observed that a fraction of the collection fluid evaporates during sampling, and that bubbles bursting into droplets can enrich bacteria in air (Blanchard and Syzdek Citation1970; Blanchard and Syzdek Citation1972; Blanchard Citation1978; Dahlback et al. Citation1981; Poulain and Bourouiba Citation2018). The continuous movement of the collection fluid in the Coriolisµ® and the BioSampler® can lead to bubbles production and then droplets. Thus, the sampler used in combination to the characteristics of the individual bacterial strains can account for a significant portion of the variation observed in in vitro behavior.
Bacterial characteristics such as cell surface hydrophobicity could help explain what happens at the air-liquid interface. A hydrophobic outer membrane means that the bacteria are prone to being re-aerosolized from the collection fluid. Hydrophobic particles tend to be excluded from liquid that is more hydrophilic by aggregating together, rather than aggregating with water molecules (Doyle Citation2000). Therefore, the particles are more likely to be enriched at the air-liquid interface (Blanchard and Syzdek Citation1970; Dickson and Koohmaraie Citation1989; Doyle Citation2000) and are more susceptible to being caught in bursting bubbles. Conversely, hydrophilic particles tend to be retained within the liquid phase (Dahlback et al. Citation1981). They are prone to being concentrated in the spiked collection fluid because of their affinity towards polar molecules present in the liquid (Doyle Citation2000). However, the cell surface hydrophobicity of a given bacterium is not a perfect predictor of its behavior in a liquid, as other membrane characteristics are surely also influential factors. It is possible that bacterial cells interact with each other resulting in aggregate formations, which may lead to modifications in their behavior. Since bacteria are able to modulate their features in response to their environment and their growth phase, which may lead to modification or alteration of their surface components, their cell surface hydrophobicity and aggregation properties could be affected and thus, their reaerosolization behavior (Kjelleberg and Hermansson Citation1984;Wagner Citation1994; Doyle Citation2000; Whitehead et al. Citation2001; Wilson et al. Citation2001; Nunan et al. Citation2003; Hamadi et al. Citation2005; Borecka-Melkusova and Bujdakova Citation2008; Lam et al. Citation2009; Bujdakova et al. Citation2013; Krasowska and Sigler Citation2014; Audrain et al. Citation2015; Di Ciccio et al. Citation2015). In this experiment, the condition (each strain or consortium) was considered to have a significant influence on the variation observed in the rearosolization behavior of the bacteria. Also, laboratory-grown microorganisms usually present intrinsic characteristics that are not always similar to microorganisms growing in natural environments, that are exposed to other various growth conditions.
Some liquid-based air sampling protocols include a process called “completion” which involves adding back the missing buffer to the final volume so that the volume of liquid used for subsequent analyses equals the original volume, compensating for the evaporated liquid (Thorne et al. Citation1992; Cayer et al. Citation2007; Letourneau et al. Citation2010a, Citation2010b; Brisebois et al. Citation2018). Knowing this completion and that some bacteria are lost and others are concentrated, the impact of this step on the eventual underestimation or overestimation of collected microbes could be considerable. Completing the volume when some species have been lost could lead to an underestimation of their real concentrations. For species concentrated in the collection fluid during sampling, completing the volume would be appropriate for bringing their concentrations back to their initial values. Despite the unpredictable aerosolization bacterial behavior, this study characterized the tendency of the Coriolisµ® and the BioSampler® to affect the re-aerosolization rates of total genome copy numbers (total bacteria). In the in vitro experiments, sampling with the Coriolisµ® led to a higher concentration of the total bacteria in the collection fluid. The centrifugal motion of the liquid might allow for less re-aerosolization of bioaerosols due to higher inertia. To avoid introducing an overestimation bias, the collection fluid of the Coriolisµ® should be completed after sampling in an attempt to reverse the concentration of bacteria. Sampling with the BioSampler® led to greater re-aerosolization of bacteria. The motion associated with impingement could result in more bubbles bursting and the re-aerosolization of more bioaerosols. In those cases, the collection fluid should not be completed after sampling because that dilution could lead to an underestimation in the final bacterial concentration. In fact, the overall bacterial concentration does not seem to be as affected by the choice of sampler type, which is not the case for single species. Even modifying the collection fluid composition with the addition of glycerol or sucrose, in an attempt to reduce evaporation and re-aerosolization of some strains, did not stabilize the variable behavior observed in some species (data not shown).
In order to evaluate how re-aerosolization occurs in liquid-based samplers in natural environments, high throughput sequencing methods were used. The taxonomic profiles obtained by filter samplers, in which no evaporation takes place, were compared to taxonomic profiles obtained by liquid samplers (Mbareche et al. Citation2018a). Microbiota of the BioSampler® cassette illustrated the important bias associated with liquid-based sampling that underestimates biomass diversity. The two liquid-based samplers used in this study use different capture mechanisms, cutoff sizes, flowrates, and sampling times. The two filter samplers are also very different in terms of operation. For example, the cassette filter (low flowrate) sampled for 20 min and the SASS 3100 (high flowrate) sampled for 7 min, leading to different volume of air collected. Despite these differences, the samples shared almost the exact same taxonomic profile. A few genera were collected by the Cassette filter but not by the SASS 3100. This could be due to the longer sampling time used with the Cassette filter, which allowed for the capture of more bioaerosols events. These results demonstrate that in characterization type studies, filter sampling is more reliable for examining the diversity of an environment without bias. The difference between liquid- and filter-based sampling has been previously demonstrated in other contexts (Mbareche et al. Citation2018a) but to our knowledge this is the first characterization of the loss associated with sampler choice.
The aim of this study was to highlight the occurrence of re-aerosolization or concentration along with liquid evaporation for future investigations. The in vitro results obtained with the bacteria consortium may be different if other bacteria, liquid-based samplers and experimental setups were used. Similarly, the field results may be different in other environments and for other microorganisms like molds or viruses. Those observations show the difficulty to extrapolate or generalize microbial species behavior in liquid-based samplers.
Conclusion
This study suggests that the re-aerosolization of bioaerosols occurring in liquid-based air samplers is significant and is associated with biases in the quantification of microorganisms and taxonomic analyses. Differential behavior was observed for the consortium of four bacteria, when added to the collection vessels of the Coriolisµ® and the BioSampler®. This behavior was not always consistent with expectations based on the cell surface hydrophobicity of the bacterium. However, the impingement and cyclonic motion of the collection fluids and the conditions tested had significant influences on the re-aerosolization rates. Moreover, taxonomic profiles from liquid-based samplers were different and emphasized the re-aerosolization of bioaerosols when compared to filter samplers. Several genera were partially or totally re-aerosolized from the collection vessel of the BioSampler®. The Coriolisµ® and the BioSampler® shared only a few genera while most of genera collected by the Cassette filter and the SASS 3100 were shared. The inability to identify certain microorganisms of interest, due to loss during liquid sampling is undesirable and could lead to erroneous conclusions. This study also highlights the complexity of re-aerosolization and its dependence on multiple factors extrinsic to the liquid sampler itself. It underlines the need to increase our knowledge about re-aerosolization in order to better understand bioaerosol behavior in liquid-based samplers and limit the associated biases.
Supplemental Material
Download MS Word (204.8 KB)Acknowledgments
The authors are thankful to Mrs. Amanda Toperoff and Michi Waygood from Blue-Pencil for English revision. Caroline Duchaine is head of the Bioaerosols and respiratory viruses strategic group of the Quebec Respiratory Health Network.
Additional information
Funding
References
- An, H. R., G. Mainelis, and L. White. 2006. Development and calibration of real-time PCR for quantification of airborne microorganisms in air samples. Atmos. Environ. 40 (40):7924–7939. doi: 10.1016/j.atmosenv.2006.07.020.
- Agranovski, I. E., V. Agranovski, S. A. Grinshpun, T. Reponen, and K. Willeke. 2002. Collection of airborne microorganisms into liquid by bubbling through porous medium. Aerosol Sci. Technol. 36 (4):502–509. doi: 10.1080/027868202753571322.
- Agranovski, I. E., A. S. Safatov, A. I. Borodulin, O. V. Pyankov, V. A. Petrishchenko, A. N. Sergeev, A. A. Sergeev, V. Agranovski, and S. A. Grinshpun. 2005. New personal sampler for viable airborne viruses: Feasibility study. J. Aerosol Sci. 36 (5–6):609–617. doi: 10.1016/j.jaerosci.2004.11.014.
- Ahmed, M. F. E., J. Schulz, and J. Hartung. 2013. Air samplings in a Campylobacter jejuni positive laying hen flock. Ann. Agric. Environ. Med. 20:16–20.
- Amato, P., M. Joly, C. Schaupp, E. Attard, O. Mohler, C. E. Morris, Y. Brunet, and A. M. Delort. 2015. Survival and ice nucleation activity of bacteria as aerosols in a cloud simulation chamber. Atmos. Chem. Phys. 15 (11):6455–6465. doi: 10.5194/acp-15-6455-2015.
- Audrain, B., M. A. Farag, C. M. Ryu, and J. M. Ghigo. 2015. Role of bacterial volatile compounds in bacterial biology. FEMS Microbiol. Rev. 39 (2):222–233. doi: 10.1093/femsre/fuu013.
- Bach, H. J., J. Tomanova, M. Schloter, and J. C. Munch. 2002. Enumeration of total bacteria and bacteria with genes for proteolytic activity in pure cultures and in environmental samples by quantitative PCR mediated amplification. J. Microbiol. Methods 49 (3):235–245. doi: 10.1016/S0167-7012(01)00370-0.
- Blanchard, D. C. 1978. Jet drop enrichment of bacteria, virus, and dissolved organic material. Pure Appl. Geophys. 116 (2–3):302–308. doi: 10.1007/BF01636887.
- Blanchard, D. C., and L. D. Syzdek. 1972. Concentration of bacteria in jet drops from bursting bubbles. J. Geophys. Res. 77 (27):5087. doi: 10.1029/JC077i027p05087.
- Blanchard, D. C., and L. Syzdek. 1970. Mechanism for the water-to-air transfer and concentration of bacteria. Science. 170 (3958):626. doi: 10.1126/science.170.3958.626.
- Bonifait, L., G. Marchand, M. Veillette, H. M’Bareche, M. E. Dubuis, C. Pepin, Y. Cloutier, Y. Bernard, and C. Duchaine. 2017. Workers’ exposure to bioaerosols from three different types of composting facilities. J. Occup. Environ. Hyg. 14 (10):815–822. doi: 10.1080/15459624.2017.1335054.
- Borecka-Melkusova, S., and H. Bujdakova. 2008. Variation of cell surface hydrophobicity and biofilm formation among genotypes of Candida albicans and Candida dubliniensis under antifungal treatment. Can. J. Microbiol. 54:718–724.
- Bouchez, T., A. L. Blieux, S. Dequiedt, I. Domaizon, A. Dufresne, S. Ferreira, J. J. Godon, J. Hellal, C. Joulian, A. Quaiser, F. Martin-Laurent, A. Mauffret, J. M. Monier, P. Peyret, P. Schmitt-Koplin, O. Sibourg, E. D’oiron, A. Bispo, I. Deportes, C. Grand, P. Cuny, P. A. Maron, and L. Ranjard. 2016. Molecular microbiology methods for environmental diagnosis. Environ. Chem. Lett. 14 (4):423–441. doi: 10.1007/s10311-016-0581-3.
- Brisebois, E., M. Veillette, V. Dion-Dupont, J. Lavoie, J. Corbeil, A. Culley, and C. Duchaine. 2018. Human viral pathogens are pervasive in wastewater treatment center aerosols. J. Environ. Sci. 67:45–53. doi: 10.1016/j.jes.2017.07.015.
- Bujdakova, H., M. Didiasova, H. Drahovska, and L. Cernakova. 2013. Role of cell surface hydrophobicity in Candida albicans biofilm. Central Eur. J. Biol. 8:259–262.
- Burrows, S. M., W. Elbert, M. G. Lawrence, and U. Poschl. 2009. Bacteria in the global atmosphere - Part 1: Review and synthesis of literature data for different ecosystems. Atmos. Chem. Phys. 9 (23):9263–9280. doi: 10.5194/acp-9-9263-2009.
- Caporaso, J. G., J. Kuczynski, J. Stombaugh, K. Bittinger, F. D. Bushman, E. K. Costello, N. Fierer, A. G. Peña, J. K. Goodrich, J. I. Gordon, G. A. Huttley, S. T. Kelley, D. Knights, J. E. Koenig, R. E. Ley, C. A. Lozupone, D. McDonald, B. D. Muegge, M. Pirrung, J. Reeder, J. R. Sevinsky, P. J. Turnbaugh, W. A. Walters, J. Widmann, T. Yatsunenko, J. Zaneveld, and R. Knight. 2010. QIIME allows analysis of high-throughput community sequencing data. Nat. Methods 7 (5):335–336. doi: 10.1038/nmeth.f.303.
- Carvalho, E., C. Sindt, A. Verdier, C. Galan, L. O’Donoghue, S. Parks, and M. Thibaudon. 2008. Performance of the coriolis air sampler, a high-volume aerosol-collection system for quantification of airborne spores and pollen grains. Aerobiologia 24 (4):191–201. doi: 10.1007/s10453-008-9098-y.
- Cayer, M. P., M. Veillette, P. Pageau, R. Hamelin, M. J. Bergeron, A. Meriaux, Y. Cormier, and C. Duchaine. 2007. Identification of mycobacteria in peat moss processing plants: Application of molecular biology approaches. Can. J. Microbiol. 53 (1):92–99. doi: 10.1139/w06-105.
- Coccia, A. M., P. M. B. Gucci, I. Lacchetti, R. Paradiso, and F. Scaini. 2010. Airborne microorganisms associated with waste management and recovery: Biomonitoring methodologies. Annali Dell Istituto Superiore Di Sanita 46:288–292.
- Comeau, A. M., W. K. W. Li, J. E. Tremblay, E. C. Carmack, and C. Lovejoy. 2011. Arctic ocean microbial community structure before and after the 2007 record sea ice minimum. PLos One 6 (11):e27492. doi: 10.1371/journal.pone.0027492.
- Dahlback, B., M. Hermansson, S. Kjelleberg, and B. Norkrans. 1981. The hydrophobicity of bacteria – an important factor in their initial adhesion at the air-water interface. Arch. Microbiol. 128:267–270. doi: 10.1007/BF00422527.
- Di Ciccio, P., A. Vergara, A. R. Festino, D. Paludi, E. Zanardi, S. Ghidini, and A. Ianieri. 2015. Biofilm formation by Staphylococcus aureus on food contact surfaces: Relationship with temperature and cell surface hydrophobicity. Food Control 50:930–936. doi: 10.1016/j.foodcont.2014.10.048.
- Dickson, J. S., and M. Koohmaraie. 1989. Cell-surface charge characteristics and their relationship to bacterial attachment to meat surfaces. Appl. Environ. Microbiol. 55:832–836.
- Doyle, R. J. 2000. Contribution of the hydrophobic effect to microbial infection. Microbes Infect. 2 (4):391–400. doi: 10.1016/S1286-4579(00)00328-2.
- Duchaine, C., P. S. Thorne, A. Meriaux, Y. Grimard, P. Whitten, and Y. Cormier. 2001. Comparison of endotoxin exposure assessment by bioaerosol impinger and filter-sampling methods. Appl. Environ. Microbiol. 67 (6):2775–2780. doi: 10.1128/AEM.67.6.2775-2780.2001.
- Dungan, R. S., and A. B. Leytem. 2016. Recovery of culturable Escherichia coli O157:H7 during operation of a liquid-based bioaerosol sampler. Aerosol Sci. Technol. 50 (1):71–75. doi: 10.1080/02786826.2015.1126666.
- Dybwad, M., G. Skogan, and J. M. Blatny. 2014. Comparative testing and evaluation of nine different air samplers: End-to-End sampling efficiencies as specific performance measurements for bioaerosol applications. Aerosol Sci. Technol. 48 (3):282–295. doi: 10.1080/02786826.2013.871501.
- Edgar, R. C., B. J. Haas, J. C. Clemente, C. Quince, and R. Knight. 2011. UCHIME improves sensitivity and speed of chimera detection. Bioinformatics 27 (16):2194–2200. doi: 10.1093/bioinformatics/btr381.
- Gomez-Domenech, M., H. Garcia-Mozo, P. Alcazar, R. Brandao, E. Caeiro, V. Munhoz, and C. Galan. 2010. Evaluation of the efficiency of the coriolis air sampler for pollen detection in South Europe. Aerobiologia 26:149–155. doi: 10.1007/s10453-009-9152-4.
- Greiner, O., P. J. R. Day, M. Altwegg, and D. Nadal. 2003. Quantitative detection of Moraxella catarrhalis in nasopharyngeal secretions by real-time PCR. J. Clin. Microbiol. 41 (4):1386–1390. doi: 10.1128/JCM.41.4.1386-1390.2003.
- Griffin, D. W., C. Gonzalez, N. Teigell, T. Petrosky, D. E. Northup, and M. Lyles. 2011. Observations on the use of membrane filtration and liquid impingement to collect airborne microorganisms in various atmospheric environments. Aerobiologia 27 (1):25–35. doi: 10.1007/s10453-010-9173-z.
- Grinshpun, S. A., K. Willeke, V. Ulevicius, A. Juozaitis, S. Terzieva, J. Donnelly, G. N. Stelma, and K. P. Brenner. 1997. Effect of impaction, bounce and reaerosolization on the collection efficiency of impingers. Aerosol Sci. Technol. 26 (4):326–342. doi: 10.1080/02786829708965434.
- Haarman, M., and J. Knol. 2006. Quantitative real-time PCR analysis of fecal lactobacillus species in infants receiving a prebiotic infant formula. Appl. Environ. Microbiol. 72 (4):2359–2365. doi: 10.1128/AEM.72.4.2359-2365.2006.
- Haig, C. W., W. G. Mackay, J. T. Walker, and C. Williams. 2016. Bioaerosol sampling: Sampling mechanisms, bioefficiency and field studies. J. Hospital Infect. 93 (3):242–255. doi: 10.1016/j.jhin.2016.03.017.
- Hamadi, F., H. Latrache, M. Mabrrouki, A. Elghmari, A. Outzourhit, M. Ellouali, and A. Chtaini. 2005. Effect of pH on distribution and adhesion of Staphylococcus aureus to glass. J. Adhes. Sci. Technol. 19 (1):73–85. doi: 10.1163/1568561053066891.
- Han, T. W., and G. Mainelis. 2012. Investigation of inherent and latent internal losses in liquid-based bioaerosol samplers. J. Aerosol Sci. 45:58–68. doi: 10.1016/j.jaerosci.2011.11.001.
- Henningson, E. W., and M. S. Ahlberg. 1994. Evaluation of microbiological aerosol samplers – a review. J. Aerosol Sci. 25 (8):1459–1492. doi: 10.1016/0021-8502(94)90219-4.
- Hermann, J. R., S. J. Hoff, K. J. Yoon, A. C. Burkhardt, R. B. Evans, and J. J. Zimmerman. 2006. Optimization of a sampling system for recovery and detection of airborne porcine reproductive and respiratory syndrome virus and swine influenza virus. Appl. Environ. Microbiol. 72 (7):4811–4818. doi: 10.1128/AEM.00472-06.
- Hogan, C. J., E. M. Kettleson, M. H. Lee, B. Ramaswami, L. T. Angenent, and P. Biswas. 2005. Sampling methodologies and dosage assessment techniques for submicrometre and ultrafine virus aerosol particles. J. Appl. Microbiol. 99 (6):1422–1434. doi: 10.1111/j.1365-2672.2005.02720.x.
- Hoisington, A. J., J. P. Maestre, M. D. King, J. A. Siegel, and K. A. Kinney. 2014. Impact of sampler selection on the characterization of the indoor microbiome via high-throughput sequencing. Build. Environ. 80:274–282.
- Juozaitis, A., K. Willeke, S. A. Grinshpun, and J. Donnelly. 1994. Impaction onto a glass slide or agar versus impingement into a liquid for the collection and recovery of airborne microorganisms. Appl. Environ. Microbiol. 60 (3):861–870.
- Kesavan, J., and J. L. Sagripanti. 2015. Evaluation criteria for bioaerosol samplers. Environ. Sci. Process. Impacts 17:638–645. doi: 10.1039/C4EM00510D.
- Kesavan, J., D. Schepers, and A. R. McFarland. 2010. Sampling and retention efficiencies of Batch-Type Liquid-Based bioaerosol samplers. Aerosol Sci. Technol. 44 (10):817–829. doi: 10.1080/02786826.2010.497513.
- Kim, S. Y., Z. Y. Kim, S. Lee, and G. Ko. 2011. Comparison of molecular and total ATP-based analytical methods with culture for the analysis of bioaerosols. Sci. Total Environ. 409 (9):1732–1737. doi: 10.1016/j.scitotenv.2011.01.035.
- King, M. D., and A. R. McFarland. 2012. Bioaerosol sampling with a wetted wall cyclone: Cell culturability and DNA integrity of Escherichia coli bacteria. Aerosol Sci. Technol. 46 (1):82–93. doi: 10.1080/02786826.2011.605400.
- Kjelleberg, S., and M. Hermansson. 1984. Starvation-induced effects of bacterial surface characteristics. Appl. Environ. Microbiol. 48:497–503.
- Krasowska, A., and K. Sigler. 2014. How microorganisms use hydrophobicity and what does this mean for human needs? Front. Cell Infect. Microbiol. 4:112.doi: 10.3389/fcimb.2014.00112.
- Lam, H., D. C. Oh, F. Cava, C. N. Takacs, J. Clardy, M. A. de Pedro, and M. K. Waldor. 2009. D-Amino acids govern stationary phase cell wall remodeling in bacteria. Science 325 (5947):1552–1555. doi: 10.1126/science.1178123.
- Langer, V., G. Hartmann, R. Niessner, and M. Seidel. 2012. Rapid quantification of bioaerosols containing L. pneumophila by coriolis®μ air sampler and chemiluminescence antibody microarrays. J. Aerosol Sci. 48:46–55. doi: 10.1016/j.jaerosci.2012.02.001.
- Lecours, P. B., M. Veillette, D. Marsolais, and C. Duchaine. 2012. Characterization of bioaerosols from dairy barns: Reconstructing the puzzle of occupational respiratory diseases by using molecular approaches. Appl. Environ. Microbiol. 78:3242–3248. doi: 10.1128/AEM.07661-11.
- Letourneau, V., A. Meriaux, N. Goyer, J. Chakir, Y. Cormier, and C. Duchaine. 2010a. Biological activities of respirable dust from Eastern Canadian peat moss factories. Toxicol. Vitro 24:1273–1278. doi: 10.1016/j.tiv.2010.03.019.
- Letourneau, V., B. Nehme, A. Meriaux, D. Masse, and C. Duchaine. 2010b. Impact of production systems on swine confinement buildings bioaerosols. J. Occup. Environ. Hyg. 7:94–102. doi: 10.1080/15459620903425642.
- Lin, X. J., T. A. Reponen, K. Willeke, S. A. Grinshpun, K. K. Foarde, and D. S. Ensor. 1999. Long-term sampling of airborne bacteria and fungi into a non-evaporating liquid. Atmos. Environ. 33 (26):4291–4298. doi: 10.1016/S1352-2310(99)00169-7.
- Lin, X. J., T. Reponen, K. Willeke, Z. Wang, S. A. Grinshpun, and M. Trunov. 2000. Survival of airborne microorganisms during swirling aerosol collection. Aerosol Sci. Technol. 32 (3):184–196. doi: 10.1080/027868200303722.
- Lin, X. J., K. Willeke, V. Ulevicius, and S. A. Grinshpun. 1997. Effect of sampling time on the collection efficiency of all-glass impingers. Am. Ind. Hygiene Assoc. J. 58 (7):480–488. doi: 10.1080/15428119791012577.
- Malik, A., M. Sakamoto, S. Hanazaki, M. Osawa, T. Suzuki, M. Tochigi, and K. Kakii. 2003. Coaggregation among nonflocculating bacteria isolated from activated sludge. Appl. Environ. Microbiol. 69 (10):6056–6063. doi: 10.1128/AEM.69.10.6056-6063.2003.
- Mbareche, H., E. Brisebois, M. Veillette, and C. Duchaine. 2017a. Bioaerosol sampling and detection methods based on molecular approaches: No pain no gain. Sci. Total Environ. 599:2095–2104. doi: 10.1016/j.scitotenv.2017.05.076.
- Mbareche, H., M. Veillette, L. Bonifait, M. E. Dubuis, Y. Benard, G. Marchand, G. J. Bilodeau, and C. Duchaine. 2017b. A next generation sequencing approach with a suitable bioinformatics workflow to study fungal diversity in bioaerosols released from two different types of composting plants. Sci. Total Environ. 601:1306–1314. doi: 10.1016/j.scitotenv.2017.05.235.
- Mbareche, H., M. Veillette, G. J. Bilodeau, and C. Duchaine. 2018a. Bioaerosol sampler choice should consider efficiency and ability of samplers to cover microbial diversity. Appl. Environ. Microbiol. 84 (23):e01589–18. doi: 10.1128/AEM.01589-18.
- Mbareche, H., M. Veillette, M. E. Dubuis, B. Bakhiyi, G. Marchand, J. Zayed, J. Lavoie, G. J. Bilodeau, and C. Duchaine. 2018b. Fungal bioaerosols in biomethanization facilities. J. Air Waste Manage. Assoc. 68:1198–1210. doi: 10.1080/10962247.2018.1492472.
- Nunan, N., K. J. Wu, I. M. Young, J. W. Crawford, and K. Ritz. 2003. Spatial distribution of bacterial communities and their relationships with the micro-architecture of soil. FEMS Microbiol. Ecol. 44 (2):203–215. doi: 10.1016/S0168-6496(03)00027-8.
- Pahl, O., V. R. Phillips, J. Lacey, J. Hartung, and C. M. Wathes. 1997. Comparison of commonly used samplers with a novel bioaerosol sampler with automatic plate exchange. J. Aerosol Sci. 28 (3):427–435. doi: 10.1016/S0021-8502(96)00445-4.
- Perrott, P., N. Turgeon, L. Gauthier-Levesque, and C. Duchaine. 2017. Preferential aerosolization of bacteria in bioaerosols generated in vitro. J. Appl. Microbiol. 123 (3):688–697. doi: 10.1111/jam.13514.
- Poulain, S., and L. Bourouiba. 2018. Biosurfactants change the thinning of contaminated bubbles at Bacteria-Laden water interfaces. Phys. Rev. Lett. 121 (20): 121. doi: 10.1103/PhysRevLett.121.204502.
- Ramette, A. 2007. Multivariate analyses in microbial ecology. FEMS Microbiol. Ecol. 62 (2):142–160. doi: 10.1111/j.1574-6941.2007.00375.x.
- Riemenschneider, L., M. H. Woo, C. Y. Wu, D. Lundgren, J. Wander, J. H. Lee, H. W. Li, and B. Heimbuch. 2010. Characterization of reaerosolization from impingers in an effort to improve airborne virus sampling. J. Appl. Microbiol. 108 (1):315–324. doi: 10.1111/j.1365-2672.2009.04425.x.
- Rognes, T., T. Flouri, B. Nichols, C. Quince, and F. Mahe. 2016. VSEARCH: A versatile open source tool for metagenomics. PeerJ 4:e2584. doi: 10.7717/peerj.2584.
- Rosenberg, M., D. Gutnick, and E. Rosenberg. 1980. Adherence of bacteria to hydrocarbons – a simple method for measuring cell-surface hydrophobicity. FEMS Microbiol. Lett. 9 (1):29–33. doi: 10.1111/j.1574-6968.1980.tb05599.x.
- Rule, A. M., J. Kesavan, K. J. Schwab, and T. J. Buckley. 2007. Application of flow cytometry for the assessment of preservation and recovery efficiency of bioaerosol samplers spiked with Pantoea agglomerans. Environ. Sci. Technol. 41:2467–2472. doi: 10.1021/es062394l.
- Sanchez-Munoz, M.,. M. Munoz-Vicente, G. Cobas, R. Portela, R. Amils, and B. Sanchez. 2012. Comparison of three high-flow single-stage impaction-based air samplers for bacteria quantification: DUO SAS SUPER 360, SAMPL’AIR and SPIN AIR. Anal Methods 4:399–405. doi: 10.1039/C1AY05562C.
- Schloss, P. D., S. L. Westcott, T. Ryabin, J. R. Hall, M. Hartmann, E. B. Hollister, R. A. Lesniewski, B. B. Oakley, D. H. Parks, C. J. Robinson, J. W. Sahl, B. Stres, G. G. Thallinger, D. J. Van Horn, and C. F. Weber. 2009. Introducing mothur: Open-source, platform-independent, community-supported software for describing and comparing microbial communities. Appl. Environ. Microbiol. 75 (23):7537–7541. doi: 10.1128/AEM.01541-09.
- Springorum, A. C., M. Clauß, and J. Hartung. 2011. A Temperature-Controlled AGI-30 impinger for sampling of bioaerosols. Aerosol Sci. Technol. 45 (10):1231–1239. doi: 10.1080/02786826.2011.588275.
- Su, W. C., A. D. Tolchinsky, B. T. Chen, V. I. Sigaev, and Y. S. Cheng. 2012. Evaluation of physical sampling efficiency for cyclone-based personal bioaerosol samplers in moving air environments. J. Environ. Monit. 14 (9):2430–2437. doi: 10.1039/c2em30299c.
- Terzieva, S., J. Donnelly, V. Ulevicius, S. A. Grinshpun, K. Willeke, G. N. Stelma, and K. P. Brenner. 1996. Comparison of methods for detection and enumeration of airborne microorganisms collected by liquid impingement. Appl. Environ. Microbiol. 62:2264–2272.
- Thorne, P. S., M. S. Kiekhaefer, P. Whitten, and K. J. Donham. 1992. Comparison of bioaerosol sampling methods in barns housing swine. Appl. Environ. Microbiol. 58:2543–2551. doi: 10.1128/AEM.67.6.2775-2780.2001.
- van der Heijden, M. G. A., R. D. Bardgett, and N. M. van Straalen. 2008. The unseen majority: Soil microbes as drivers of plant diversity and productivity in terrestrial ecosystems. Ecol. Lett. 11 (3):296–310. doi: 10.1111/j.1461-0248.2007.01139.x.
- Veillette, M., H. Mbareche, and V. Dion-Dupont. 2017. Dubuis, ME and Duchaine, C. 2017. Influence of bioareosols sampling procedure on airborne biodiversity assessment. Poster presented at the American Society for Microbiology General Meeting-Microbe 2017. New Orleans, LA June.
- Verreault, D., S. Moineau, and C. Duchaine. 2008. Methods for sampling of airborne viruses. Microbiol. Mol. Biol. Rev. 72 (3):413–444. doi: 10.1128/MMBR.00002-08.
- Wagner, R. 1994. The regulation of ribosomal-RNA synthesis and bacterial-cell growth. Arch. Microbiol. 161 (2):100–109.
- West, J. S., and R. B. E. Kimber. 2015. Innovations in air sampling to detect plant pathogens. Ann. Appl. Biol. 166 (1):4–17. doi: 10.1111/aab.12191.
- Whitehead, N. A., A. M. L. Barnard, H. Slater, N. J. L. Simpson, and G. P. C. Salmond. 2001. Quorum-sensing in gram-negative bacteria. FEMS Microbiol. Rev. 25 (4):365–404. doi: 10.1111/j.1574-6976.2001.tb00583.x.
- Whitman, W. B., D. C. Coleman, and W. J. Wiebe. 1998. Prokaryotes: The unseen majority. Proc. Natl. Acad. Sci. U. S. A. 95 (12):6578–6583. doi: 10.1073/pnas.95.12.6578.
- Willeke, K., X. J. Lin, and S. A. Grinshpun. 1998. Improved aerosol collection by combined impaction and centrifugal motion. Aerosol Sci. Technol. 28 (5):439–456. doi: 10.1080/02786829808965536.
- Wilson, W. W., M. M. Wade, S. C. Holman, and F. R. Champlin. 2001. Status of methods for assessing bacterial cell surface charge properties based on zeta potential measurements. J. Microbiol. Methods 43 (3):153–164. doi: 10.1016/S0167-7012(00)00224-4.
- Wubulihairen, M., X. Y. Lu, P. K. H. Lee, and Z. Ning. 2015. Development and laboratory evaluation of a compact swirling aerosol sampler (SAS) for collection of atmospheric bioaerosols. Atmos. Pollut. Res. 6 (4):556–561. doi: 10.5094/APR.2015.062.
- Yamamoto, N., D. Schmechel, B. T. Chen, W. G. Lindsley, and J. Peccia. 2011. Comparison of quantitative airborne fungi measurements by active and passive sampling methods. J. Aerosol Sci. 42 (8):499–507. doi: 10.1016/j.jaerosci.2011.05.004.
- Yao, M. S., H. L. Zhang, S. F. Dong, S. Q. Zhen, and X. D. Chen. 2009. Comparison of electrostatic collection and liquid impinging methods when collecting airborne house dust allergens, endotoxin and (1,3)-beta-d-glucans. J. Aerosol Sci. 40 (6):492–502. doi: 10.1016/j.jaerosci.2009.02.002.
- Yooseph, S., C. Andrews-Pfannkoch, A. Tenney, J. McQuaid, S. Williamson, M. Thiagarajan, D. Brami, L. Zeigler-Allen, J. Hoffman, J. B. Goll, D. Fadrosh, J. Glass, M. D. Adams, R. Friedman, and J. C. Venter. 2013. A metagenomic framework for the study of airborne microbial communities. PloS One 8 (12):e81862. doi: 10.1371/journal.pone.0081862.
- Yu, K. P., Y. P. Chen, J. Y. Gong, Y. C. Chen, and C. C. Cheng. 2016. Improving the collection efficiency of the liquid impinger for ultrafine particles and viral aerosols by applying granular bed filtration. J. Aerosol Sci. 101:133–143.
- Zheng, Y. H., and M. S. Yao. 2017. Liquid impinger BioSampler’s performance for size-resolved viable bioaerosol particles. J. Aerosol Sci. 106:34–42. doi: 10.1016/j.jaerosci.2017.01.003.
- Zhen, H. J., V. Krumins, D. E. Fennell, and G. Mainelis. 2018. Analysis of airborne microbial communities using 16S ribosomal RNA: Potential bias due to air sampling stress. Sci. Total Environ. 621:939–947. doi: 10.1016/j.scitotenv.2017.10.154.
- Zhen, S. Q., K. J. Li, L. H. Yin, M. S. Yao, H. L. Zhang, L. S. Chen, M. H. Zhou, and X. D. Chen. 2009. A comparison of the efficiencies of a portable BioStage impactor and a Reuter centrifugal sampler (RCS) high flow for measuring airborne bacteria and fungi concentrations. J. Aerosol Sci. 40 (6):503–513. doi: 10.1016/j.jaerosci.2009.02.003.