
 ?Mathematical formulae have been encoded as MathML and are displayed in this HTML version using MathJax in order to improve their display. Uncheck the box to turn MathJax off. This feature requires Javascript. Click on a formula to zoom.
Abstract
Aerodynamic behavior of airborne fibers including high-aspect ratio particles plays an important role in aerosol filtration and lung deposition. Fiber length is considered to be an important parameter in causing toxicological responses of elongate mineral particles, including asbestos, as well as one of the factors affecting lung deposition. In order to estimate the toxicity of fibers as a function of fiber length, it is required to separate fibers by length and understand mechanisms related to fiber separation for use in toxicology studies. In this study, we used nylon mesh screens with different pore sizes as a separation method to remove long fibers and measured screen collection efficiency of glass fibers (a surrogate for asbestos) as a function of aerodynamic diameter with the aim to prepare toxicology samples free of long fibers and/or harvest long fibers from the screen. Two screen configurations ([i] without a laminar flow entrance length, and [ii] with the entrance length) were tested to investigate the effect of screen pore size (10, 20, and 60 µm) and screen configuration on collection efficiency of fibers. Screen collection efficiency (η) was obtained based on measurements of downstream concentrations of a test chamber either without or with a screen. The results showed that screen collection efficiency increases as screen pore size decreases from 60 to 10 µm for both cases with and without entrance lengths. For the screen configuration without entrance length, higher collection efficiency was obtained than the case with entrance length probably due to increased impaction caused by the close proximity of inlet to screen. In addition, the difference between the collection efficiencies for the different configurations was small in the aerodynamic size range below 3 µm while it increased in the size range from 3 to about 7 µm, indicating that as large aerodynamic diameter is associated with longer fibers, some differential selection of fibers is possible. Modified model collection efficiency for 10 and 20 µm screens based on the interception predicts well the measured data for the case with entrance length, indicating that the fiber deposition on these screens occurs dominantly through the interception mechanism in the micrometer size range under a given flow condition.
EDITOR:
1. Introduction
During the past decades, the inhalation of airborne fibers such as asbestos and their sampling was a main issue in the occupational environment from a health perspective (Timbrell Citation1982; Baron Citation2001). Fiber is defined as a particle having one dimension significantly larger than the other two dimensions (Baron Citation2001). Aerodynamic behavior of airborne fibers including high-aspect ratio particles plays an important role in aerosol filtration and lung deposition. Separation of airborne fibers by length is also important in fiber filtration and toxicology studies. In particular, removing long fibers such as asbestos from an aerosol stream has been of great interest because fiber length is considered as being a crucial factor which causes toxicological responses such as fibrosis and mesothelioma when the asbestos is deposited in the lung (Stanton et al. Citation1981; Dodson, Atkinson, and Levin Citation2003). Recently, a new concern about the potential toxicity of elongate mineral particles (EMPs) being generated in both ambient and workplace environments, including asbestiform and non-asbestiform mineral fibers, has been raised (NIOSH Citation2011; Wylie and Candela Citation2015). In addition, recent toxicological studies have shown that pulmonary exposure to fibrous particles (i.e., cellulose nanofibrils [CNF] and cellulose nanocrystal [CNC]; emerging materials) in mice led discrete local immune cell polarization patterns in the lungs, and that human lung cell exposed to CNC caused an inflammatory response with significantly elevated inflammatory cytokines/chemokines (Yanamala et al. Citation2014; Menas et al. Citation2017; Park et al. Citation2018).
In this context, Ku, Deye, and Turkevich (Citation2014) studied the use of nylon mesh screens (housed in asbestos sampling cassettes) as a length separation method of airborne fibers and evaluated how feasible the method would be to classify fibers in the micrometer size range. They showed that mesh screens with a different pore size can separate long fibers from the aerosol stream. Several studies on using screens as collection media of airborne particles were reported in the literature: Yamamoto et al. (Citation2005) studied the collection efficiency of airborne supermicron (∼10–50 µm) soil particles on different mesh screens, and Lam and Finlay (Citation2009) examined the changes in collection efficiency in the nylon net filter by magnetic alignment of elongated particles. Although these studies measured or estimated the collection efficiency of the screens for airborne particles, they did not directly measure aerodynamic diameters, but either used light-scattering-based optical diameters or calculated aerodynamic diameters based on measured fiber diameter and length, which may have brought somewhat uncertainty for estimating aerodynamic collections on the screens, especially for curved or branched fibers. Myojo (Citation1999) determined length distributions of fibrous aerosols using a numerical simulation through a set of mesh screens with a lot of assumptions simplifying the simulation, some of which are not reasonable in penetration through a screen. Considering that the mesh screens are useful for collection of long fibers, and that they have a regular structure of woven fibers and high porosity, compared to other sampling filters such as membrane filters, and even that nylon mesh screen can be used as a disposable collection substrate when ashed or digested for mass spectrometry (Northington Citation1987; Tuchman, Volkwein, and Vinson Citation2008), further investigation of collection characteristics of these screens for fibrous aerosols would be valuable. In the previous study (Ku, Deye, and Turkevich Citation2017), we proposed a method for estimating average fiber length collected on the screen based on measured collection efficiency of monodisperse fibers to harvest longer fibers. To do this, we first classified fibers with monodisperse length (four different lengths) using the Baron’s fiber classifier, and then, measured screen collection efficiency vs aerodynamic diameter for the classified fibers with different fiber length. This study showed that the mean fiber length can be estimated using collection efficiency of monodisperse length fibers, without analyzing the fibers collected on the screen.
To better understand mechanisms related to airborne fiber collection on a nylon mesh screen, the aerodynamic characteristics of the fibers which may affect collection efficiency of the mesh screen needs to be investigated. For this purpose, in the present study, we characterized deposition of fibrous particles on screens with two different screen configurations ([i] without a laminar flow entrance length and [ii] with the laminar flow entrance length [about 23 cm]) and investigated the effect of screen configuration (i.e., sampling inlet design) on collection efficiency of airborne fibers as a function of aerodynamic diameter for different screen pore sizes (10, 20, and 60 µm). Also, we provided some insight into a dominant collection mechanism of fibers on a screen by comparing the measured collection efficiency to theoretical values based on single-fiber model efficiency theory.
2. Experimental
2.1. Conceptual design for fiber collection with a screen
The key idea of using a screen for collection of airborne fibers is based on fiber fundamental mechanisms (i.e., interception by a screen and fiber alignment parallel to the plane of a screen. Collection of fibers by interception is expected to be dominant compared to impaction if fibers are aligned parallel to the plane of a screen.) The schematic diagram for this concept is shown in Supplementary Figure S1. The charge state of airborne fibers is conditioned first. Then, in an electrical field, the fibers are allowed to align parallel to the electric field. When the aligned fibers pass through a screen, fibers with a length longer than a critical length (probably close to screen pore size) are collected on the screen, and long fibers are separated from the aerosol stream and short fibers penetrate the screen. Particle charge condition is neutralized and the electric field is not used in this study, and the overall concept described in Supplementary Figure S1 is considered for future application of fiber alignment. A recent study showed that airborne charged glass fibers can be aligned somewhat in a DC electrical field (∼ 6 kV/cm) in dry air and be better aligned in humid air (Ku, Deye, and Turkevich Citation2018). For the potential future application of fiber alignment parallel to the screen surface, as reported in the recent study (Ku, Deye, and Turkevich Citation2018), we considered two configurations of the screen because the two configurations might show the effect of aerosol flow condition on collection efficiency and/or fiber alignment. The schematic diagram of the configurations is shown in .
Figure 1. Experimental setup (a) and two configurations of sampling with a screen ((b) sampling with no entrance length, and (c) sampling with entrance length). A fully developed velocity profile is included in (c).
The distance from the inlet of sampling chamber (i.e., conducting tube) to a screen is short (about 1 cm) as shown in we call this configuration “sampling without a laminar flow entrance length.”
The distance from the inlet of sampling tube to a screen is long (about 23 cm) as shown in we call this configuration “sampling with the laminar flow entrance length.”
This configuration provides a fully developed flow in the tube. The motivation of testing fiber collection on a screen in a fully developed flow is to minimize the effect of fiber random orientation or fiber alignment to the flow direction by a non-developed flow. Also, it would allow us to apply an electric field before a screen using a test unit for future study, which consists of two electrodes to which high DC voltage is applied as shown in the previous study (Ku, Deye, and Turkevich Citation2018) to improve fiber alignment in an electric field. In case of a laminar flow in a circular tube, which meets the requirement that the Reynold’s number ReD is less than about 2000, the entrance length Llaminar is given by the following equation (Bergman et al. Citation2011):
(1)
(1)
where, ReD is the Reynold’s number and D is the diameter of the tube. The flows throughout this experiment are laminar: the mean flow velocity is about U = 6.6 cm/s at sampling flow rate Q = 1.5 lpm, in a 25 mm sampling cassette (with effective diameter D∼22 mm), corresponding to Reynolds number, ReD = UD/ν = 100, where ν = 0.15 cm2/s is the kinematic viscosity for air. For this laminar flow condition, the entrance length is 6 D (∼13 cm). So the experimental distance (23 cm) we use is far behind the entrance of the sampling tube cassette and the fully developed flow arrives upstream the screen.
2.2. Experimental setup and test tube chamber configurations
Test material was glass fiber powder used as a surrogate of asbestos, supplied by the Japan Fibrous Material Research Association (JFMRA) (Kohyama et al. Citation1997). This same material has been used in our recent studies for aerosolization of airborne fibers (Ku, Deye, and Turkevich Citation2013), fiber alignment in electric field (Ku, Deye, and Turkevich Citation2018), and removing long fibers from an aerosol stream using screens (Ku, Deye, and Turkevich Citation2014; Ku and Deye Citation2018). Experimental setup is shown in . Briefly, a weighed amount of the glass fiber powder (i.e., 0.2–0.3 g) was loaded into a vortex shaker tube as received and then was pre-shaked for about 20 min by a vortex shaking (Ku, Deye, and Turkevich Citation2013) to fully disperse the powder. Then, airborne fibers were provided through a neutralizer (Po-210, 2 µCi) to a test chamber where a screen with a different pore size was put. Screen collection efficiency was measured under the different screen configurations for different screen pore sizes, as shown in c.
The aerodynamic size distribution was measured by the TSI 3321 Aerodynamic Particle Sizer (APS: TSI, MN, USA). Nylon net screens (Millipore Corp., Billerica, MA, USA) with different screen pore sizes (10, 20, and 60 µm) under exam are loaded in one of the laminar flow chambers while the other remains empty. Screen pore shape is square and screen mesh fiber is uniform and woven perpendicular to each other, as shown in the work (Ku, Deye, and Turkevich Citation2014). Identical aerosol paths through the chambers avoid systematic errors due to particle losses that occur in the chambers to measure particle concentrations with/without a screen. Screen collection efficiency (η) was obtained based on measurements of downstream concentrations of the chamber either without or with a screen under exam, i.e.:
(2)
(2)
where, Cwo and Cw are particle concentrations of the chamber without a screen and with, respectively. The mean collection efficiency for each screen was calculated based on three to five duplicate concentration measurements under the same condition. The uncertainty of the measurements was expressed with one standard deviation. A new screen was used for each collection experiment (∼5–10 min test) to minimize the effect of fiber loading on screen collection efficiency. In addition, the unobstructed particle concentration (without a screen) was low, i.e., of the order of 100–200 particles cm−3, and so the fiber particles deposited on the screen may not affect significantly screen collection efficiency during the experiment. Our justification for not much fiber mass loading on each screen is the use of a new screen for each screen test, and the fact that aerosolized fiber concentration is relatively low and collection time is relatively short. Quantitative justification for this statement can be obtained from our experimental data (see Supplementary Figure S2 in the supplementary information [SI]). We analyzed the collection efficiency data in Supplementary Figure S2 for the first three consecutive runs. It was found that the difference of collection efficiency between the consecutive runs was in the range of ∼10–15% for most data except those at aerodynamic diameters of 0.5–0.7 µm.
The aerodynamic diameter of a fiber is defined with expressions Cox (Citation1970) derived for a cylinder in motion parallel () and perpendicular (
) to the long axis, and Cox’s expressions are described in the SI. According to Cox’s expressions, as fiber length increases, its aerodynamic diameter will increase (see Supplementary Figure S3 for details in the SI).
Airborne fibers were collected on a mixed cellulose ester (MCE) filter and taken pictures of by optical phase contrast microscopy (PCM), typically at 400 magnification; 300–400 fibers were analyzed to obtain length distributions (see Supplementary Figure S5 in the SI).
3. Results and discussion
3.1. Size distributions of aerosol fibers
shows a typical image of fibers aerosolized by vortex shaking and collected on a filter.
Figure 2. Typical image of fibers aerosolized by vortex shaking and collected on a filter taken by an optical phase contract microscope.
The unobstructed collected fibers have a broad length distribution ranging from several micrometers up to about 100 µm with a mean length of 18–20 µm and broad diameter distribution ranging from 0.2 µm to 4.7 µm with a mean diameter of ∼0.8 (Kohyama et al. Citation1997; Ku, Deye, and Turkevich Citation2014). Most of the fibers seem to be straight and well distributed.
shows typical size distributions of airborne fibers as a function of aerodynamic diameter for cases without a screen and with 20 µm screen under no entrance length. The unobstructed aerosol size distribution has a modal diameter of 1.5 µm, and the aerosol through the screen has slightly small modal diameter and reduced number concentration in the size range of aerodynamic diameter larger than 1 µm. The aerosol smaller than 1.0 µm seems to show little difference in number concentration for the two cases, indicating that the screen has little effect on collection efficiency in this size range. shows collection efficiency of 20 µm screen with no entrance length. Under the same condition, concentrations with and without the screen were measured for five times and the collection efficiency was obtained by averaging these measurement and the uncertainty was shown with a standard deviation. The collection efficiency seems to be flat for the aerosol less than 1 µm and then increases with increasing size.
Figure 3. Typical measurements of particle concentrations upstream and downstream screen 20 µm. (a) Number concentration for condition without entrance length; (b) collection efficiency of screen 20 µm for five runs under the same condition. Neutralized fibers, dry air, and aerosol flow rate 1.5 L min−1. The two solid lines in represent two consecutive aerodynamic size distributions of airborne fibers measured by the APS without a screen, and the two solid squares are corresponding to two consecutive aerodynamic size distributions of airborne fibers with a screen. The sampling time for each line and symbol data is 30 s.
3.2. Effect of screen pore size on collection efficiency of fibers
shows collection efficiency of screens with different pore sizes as a function of aerodynamic diameter. For screens with entrance length in the distance from aerosol inlet to the screen surface is about 23 cm), screen collection efficiency increases as aerodynamic diameter increases for all three screen pore sizes. The collection efficiency of screen 10 µm is higher than those of screen 20 and 60 µm. The cutoff aerodynamic diameter at 50% collection efficiency is about 3, 5.1 and 5.4 µm for screen 10, 20, and 60 µm, respectively. It is worth noting that the collection efficiencies of screen 20 and 60 are similar in the size range from 0.5 to 10 µm except 2–5 µm in aerodynamic diameter where the collection efficiency of screen 20 is slightly higher than that of screen 60.
Figure 4. Collection efficiency of airborne fibers for different screen pore sizes (a) condition with entrance length and (b) condition without entrance length. Neutralized fibers, dry air, and aerosol flow rate 1.5 L min−1.
For screens with no entrance length in in this case, the distance from aerosol inlet to the screen surface is about 1 cm), collection efficiency of screen 10 is slightly higher than those of screen 20 and 60. The collection efficiencies of screen 20 and 60 with no entrance length are almost identical in the size range below 4 µm while that of screen 20 is higher in aerodynamic diameter larger than 4 µm. The screens with no entrance length have smaller 50% cutoff sizes (2.5, 2.9, and 3.1 µm for screen 10, 20, and 60, respectively) with a narrow distribution compared to the screens with entrance length.
3.3. Effect of screen configuration on collection efficiency of fibers
also shows collection efficiencies of three screens for different screen configurations. For 60 µm screen (), collection efficiency is similar up to 2.0 µm for both configurations, but the collection efficiency without entrance length is larger than the case with entrance length in the size ranging from 2.0 to 9, showing that different collection mechanism is involved in this size range. For 20 µm screen, the collection efficiency without entrance length is higher than that with entrance length in the whole size range (i.e., 0.5–10 µm). The difference between the two collection efficiencies is small (∼0.05) in the size range of 0.5–1.0 µm, while it increases (∼0.3) as the aerodynamic size increases; 10-µm screen shows a similar tendency to the 20 µm screen, but the collection efficiency difference (∼0.15) for the two configurations is small relative to the case of 20 µm screen.
shows collection efficiency of 20 µm screen for different screen configurations.
Figure 5. Comparison of collection efficiency of 20 µm screen for airborne fibers and Polystyrene Latex (PSL) spheres (Ku et al. Citation2017). Neutralized fibers, dry air, and aerosol flow rate 1.5 L min−1.
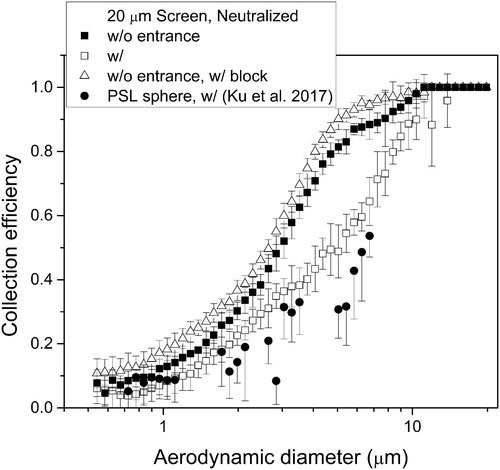
Centrally blocked configuration is included in : we introduced a blocking disk at the center of the screen, as shown in our recent study (Ku, Deye, and Turkevich Citation2014). Briefly, for the centrally blocked configuration, the flow is diverted radially outward, and the fibers are aligned with the flow. When the flow redirects around the blockage to go through the screen, fibers that were parallel to the screen, due to their inertia, cannot respond to the change in flow direction, and are thus intercepted by the screen. The more aligned the fibers are parallel to the plane of the screen, the greater their potential for interception by the screen (Ku, Deye, and Turkevich Citation2014). With no entrance length, collection efficiency of screen 20 is higher than that of screen 20 with entrance length. Collection efficiency of screen with a block configuration is higher than the other configurations. This may be due to higher impaction of the airborne fibers approaching the blocking disk. The increased collection efficiency with the block configuration seems to be the same in the whole size range, which is about 0.05. also shows comparison of collection efficiency of fibers with spherical particles. Polystyrene Latex (PSL) spheres were generated by electrospraying PSL suspensions of 1, 2, 3, and 6 µm, and the collection efficiency for PSL was obtained in the previous study (Ku, Deye, and Turkevich Citation2017). With entrance length, both fibers and spherical particles have similar collection efficiency for sizes smaller than 2 µm and the collection efficiency of the fibers becomes larger than that of spherical particles for sizes larger than 2 µm. This may be due to the fact that small or short fibers has more potential to randomly rotate than longer fibers when they approach the screen, and that longer fibers may be intercepted easily by the screen, which makes their collection efficiency higher.
3.4. Single-fiber collection efficiency theory
According to single-fiber collection efficiency theory, mechanisms by which particles are removed from an aerosol stream include interception, inertial impaction, diffusion, and gravitational settling (Hinds Citation1999). For the micrometered size ranges of the glass fibers used in this study, particle collection due to diffusion and gravitational settling was found to be negligible relative to interception and inertial impaction. So only single-fiber collection efficiency for impaction and interception was considered. The single-fiber efficiency for impaction (EI) is expressed by Yeh and Liu (Citation1974) and Hinds (1999) as:
(3)
(3)
where,
(4)
(4)
(5)
(5)
(6)
(6)
where, Stk is the Stokes number, ρp is particle density, da is particle aerodynamic diameter, Cc Cunningham slip correction factor (which is close to 1.0 for micron-sized particles), µ is gas dynamic viscosity, Ku is the Kuwabara hydrodynamic factor, R = da/df, dimensionless parameter, df screen fiber diameter, α solid volume fraction, and ε pore opening area fraction of a screen. The factor of 1-ε in EI, the projected fraction of screen fibers, was multiplied to obtain an entire screen efficiency based on the approach of Yamamoto et al. (Citation2005).
The single-fiber collection efficiency for interception (ER_Ku) is given by Lee and Ramamurthi (Citation2001) as:
(7)
(7)
The modified single-fiber efficiency for interception (ER) is given by Yamamoto et al. (Citation2005) by considering the ratio of particle-penetrating area to screen pore area based on the Natanson expression (Spurny et al. Citation1969), which is called “a hole model,” as:
(8)
(8)
where, l is the length of screen pore. In this modified model, the configuration (in the direction of projection into mesh screen pore) and physical dimensions (fiber diameter and pore size) of the screen are incorporated, not the single fiber of the screen.
The overall fiber collection efficiency EΣ was obtained:
(9)
(9)
Then, the overall filter efficiency of screen with thickness t (Wang and Otani Citation2012) is given as:
(10)
(10)
The ε and α for screens 10 µm, 20 µm, and 60 µm were obtained from the manufacturer and measuring screen mass and volume, respectively. α is 0.78, 0.54, and 0.32, and ε is 4, 14, and 41% for screens 10 µm, 20 µm, and 60 µm, respectively. Physical properties for screens used in the study are summarized in .
Table 1. Physical properties of nylon mesh screens used in this study.
shows measured collections efficiency of screens compared to single-fiber efficiency models. The single-fiber efficiency was converted to comparable screen collection efficiency using EquationEquation (3)(3)
(3) in the paper of Wang and Otani (Citation2012). For 10 µm screen, theoretical single-fiber efficiency for impaction and overall collection overestimates the measured collection efficiency for the two screen configurations. Interestingly, both single-fiber efficiencies for interception (based on EquationEquations (7)
(7)
(7) and Equation(8)
(8)
(8) ) are somewhat different from to the measured one: EquationEquation (7)
(7)
(7) overestimates the collection efficiency in the size range of 0.5–3 µm, and EquationEquation (8)
(8)
(8) overestimates it (as shown in . The modified single-fiber efficiency (EquationEquation (8)
(8)
(8) ) predicts well for sizes larger than 3 µm for the case with entrance length. shows the collection efficiency for screen 20 µm. The single-fiber efficiency models for impaction and interception underestimate the measured collection efficiency for the two configurations below 2 µm, but the model for impaction overestimates for particles larger than 2 µm. The model for overall collection (EquationEquation (9)
(9)
(9) ) for screen 20 µm predicts reasonably well the collection in the smaller sizes (less than 1 µm), and then overestimates it for the screen without entrance length, while the model for screen 10 µm overestimates significantly the collection efficiency in the entire size range. The modified single-fiber efficiency model for interception shows a reasonable agreement with the measured collection efficiency for the screen with entrance length.
Figure 6. Comparison of collection efficiency of screens (a) 10 µm, (b) 20 µm, and (c) 60 µm for airborne fibers with theoretical models based on single-fiber efficiency. The single-fiber efficiency was converted to comparable screen collection efficiency using EquationEquation (3)(3)
(3) in the paper of Wang and Otani (Citation2012). ER is the modified collection efficiency for interception (EquationEquation (8)
(8)
(8) ), ER_Ku is the single-fiber efficiency for interception (EquationEquation (7)
(7)
(7) ), EI is the single-fiber efficiency for impaction (EquationEquation (3)
(3)
(3) ), and Etot is the overall screen filter efficiency (EquationEquation (10)
(10)
(10) ). Neutralized fibers, dry air and aerosol flow rate 1.5 L min−1.
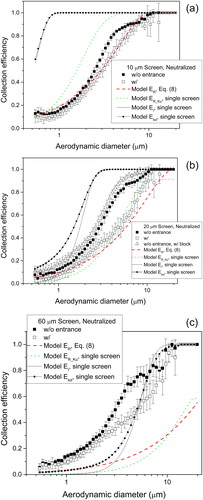
Unlike 10 µm and 20 µm screens, for 60 µm screen the single-fiber efficiency models for interception, impaction and overall collection underestimate for the two screen configurations. Even the modified collection efficiency for interception significantly deviates from the measured value for the screen with entrance length.
summarizes cutoff diameter at 50% collection efficiency for different screens with different configurations. The screens without entrance length have lower cutoffs as well as steep slopes than the screens with entrance length, regardless of screen pore sizes. Because the distance from the inlet of test chamber to the screen is short (i.e., 1 cm) and this configuration is similar to nozzle-to-substrate structure in an impactor, the aerosol flow from the inlet does not have enough time to be fully developed in the test chamber, which means that the flow approaching the center of the screen has higher velocity than near the wall of the test chamber.
Table 2. Cutoff diameter at 50% collection efficiency and sharpness for different screen configurations.
The flow condition in the test chamber is laminar because ReD (=UD/ν) is about 100, as shown in Section 2.1. The results on the cutoff diameter at 50% collection efficiency show that flow condition affects aerodynamic characteristics of the fibers and fully developed flow may make the fibers randomly oriented, which reduces collection efficiency.
The comparison of measured collection efficiency with the predicted single-fiber model efficiency for overall deposition showed some discrepancy between the two. This discrepancy may be due to fiber alignment parallel to the air flow when fibers penetrate the screen pore. The air velocity through the screen pore is calculated based on pore open area fraction; U ∼ 165 cm/s, 47 cm/s, and 16 cm/s, for screens 10, 20, and 60 µm, respectively. The largest discrepancy between measured and modeled ones occurs for screen 10 µm. The chance for fibers to align to the flow into the screen pore would increase with increasing air velocity through it. With 10 µm screen, theoretically all fibers longer than 10 µm (strictly speaking, about 14 µm; diagonal length of a square 10 µm) would be collected on the screen, assuming that the fibers are aligned to the plane of the screen. According to Cox’s (Citation1970) expressions, a randomly oriented glass fiber with a diameter of 1 µm and length of 10 µm would have an aerodynamic diameter of 3.2 µm. Experimental data show the collection efficiency is about 0.5–0.6 at 3.2 µm. As aerodynamic diameter increases with fiber length, a large fraction of fibers longer than the pore size still penetrate at the aerodynamic diameter larger than 3.2 µm for the screen 10 µm, probably due to the fiber alignment to the flow streamline, which reduces the collection efficiency. It is worth noting that we used the interception parameter R, which is defined as the ratio of aerodynamic diameter (dae) to screen fiber diameter (df). The parameter R predicts well the fiber collection efficiency for interception in this study when the hole model equation is used (EquationEquation (8)(8)
(8) ). Although physical diameter was used traditionally in the single-fiber efficiency theory, several studies showed that fiber length or aerodynamic diameter instead of physical diameter in the calculation of the interception parameter R for non-spherical particles well predicted the experimental collection efficiency: Wang, Kim, and Pui (Citation2011) compared the measured collection efficiency with the predicted single-fiber model efficiency for carbon nanotubes (CNTs) less than 300 nm in mobility diameter where the interception parameter was based on aerodynamic diameter multiplying a scaling factor and showed a reasonable agreement between experimental and model data. Seto et al. (Citation2010) showed that interception with a rotation of fibrous particles relative to flow direction may be the dominant capturing mechanism for CNT particles in mobility diameter of 100–300 nm. Our results show that the measured collection efficiency for the case with entrance length agrees well with the modified collection efficiency (EquationEquation (8)
(8)
(8) ) for interception based on the hole model at aerodynamic diameter larger than 3 µm, as shown in , confirming that the dominant collection mechanism of long fibers in this size range is an interception.
For screen 20 µm, the deviation of the predicted overall collection efficiency from the measured ones for overall was reduced compared to that of screen 10 µm. The predicted modified collection efficiency for interception (dash line in ) is a little bit lower than the measured one, particularly in the large size range while the collection efficiency based on ER_Ku (dotted line) is a little bit higher in the large size range. However, these two collection efficiencies are still in reasonable agreement with the measured ones, confirming again that the dominant collection efficiency is the interception for screen 20 µm with entrance length. Interestingly, the predicted collection efficiency for overall (Etot) overestimates the measured one for both the cases with and without entrance length in the whole size range. Considering that corresponding Stk number ranges for the fibers is 0.01 to 1.0 and Reynolds number based on particle size and flow is much less than 1, the effect of inertia and flow on collection efficiency seems to be small relative to interception.
As a final remark, for potential application of screens to separation of airborne fibers by length in large quantity, the effect of fiber accumulation on the screen collection efficiency needs to be considered, as Kasper et al. (Citation2009) studied for a single-fiber efficiency with a parallel array of fibers as a function of accumulated particle mass. In addition, a further study may be informative to investigate the effect of high Stokes and Reynolds numbers on screen collection efficiency.
4. Conclusion
In this study, collection efficiency of airborne fibers on the screens with different configurations was investigated. Three different screen pore sizes were used to measure screen collection efficiency of glass fibers as a function of aerodynamic diameter, and their cutoff aerodynamic diameter at 50% collection efficiency was obtained, and the measured collection efficiency for different screen configurations was compared to the single-fiber efficiency theory. The key conclusions could be summarized based on the findings in the study.
Screen collection efficiency increased as screen pore size decreased from 60 to 10 µm for both cases with and without entrance lengths: the collection efficiency for both cases increased from 0.1 to almost 1.0 as aerodynamic diameter increased from 0.5 to 10 µm.
For the screen configuration without entrance length, higher collection efficiency was obtained than in the case with entrance length probably due to increased impaction caused by the close proximity of inlet to screen.
The difference between the collection efficiencies for the different configurations was small in the aerodynamic size range below 3 µm while it increased in the size range from 3 to about 7 µm, indicating that as large da is associated with longer fibers, some differential selection of fibers is possible.
Modified collection efficiency for 10 and 20 µm screens based on the interception predicts well the measured data for the case with entrance length, indicating that the fiber deposition on these screens occurs dominantly through the interception mechanism in the micrometer size range under the fully developed flow at a given flow rate.
Disclaimer
The mention of any company or product does not constitute an endorsement by the Centers for Disease Control and Prevention. The findings and conclusions in this article are those of the authors and do not necessarily represent the views of the National Institute for Occupational Safety and Health.
Supplemental Material
Download PDF (215.1 KB)Acknowledgments
The authors would like to thank Drs. Chaolong Qi and Seungkoo Kang for their helpful comments on this work, and thank Mariko Ono-Ogasawara (Japan NIOSH) for the samples of the glass fibers. We thank the reviewers for the initial version of our manuscript for prompting the discussion contained in the online SI.
Additional information
Funding
Related Research Data
References
- Baron, P. A. 2001. Measurement of airborne fibers: A review. Ind. Health. 39 (2):39–50. doi:10.2486/indhealth.39.39.
- Bergman, T. L., A. S. Lavine, F. P. Incropera, and D. P. DeWitt. 2011. Fundamentals of heat and mass transfer. Hoboken, NJ: Wiley.
- Cena, L. G., B. K. Ku, and T. M. Peters. (2012). Particle collection efficiency for nylon mesh screens. Aerosol. Sci. Technol. 46 (2):214–221.
- Cox, R. G. 1970. The motion of long slender bodies in a viscous fluid I: General theory. J. Fluid. Mech. 44 (04):791–810. doi:10.1017/S002211207000215X.
- Dodson, R. F., M. A. Atkinson, and J. L. Levin. 2003. Asbestos fiber length as related to potential pathogenicity: A critical review. Am. J. Ind. Med. 44 (3):291–297. doi:10.1002/ajim.10263.
- Hinds, W. C. 1999. Aerosol technology: Properties behavior and measurement of airborne particles. 2nd ed. New York, NY: Wiley.
- Kasper, G., S. Schollmeier, J. Meyer, and J. Hoferer. 2009. The collection efficiency of a particle-loaded single filter fiber. J. Aerosol. Sci. 40 (12):993–1009. doi:10.1016/j.jaerosci.2009.09.005.
- Kohyama, N., I. Tanaka, M. Tomita, M. Kudo, and Y. Shinohara. 1997. Preparation and characteristics of standard reference samples of fibrous minerals for biological experiments. Ind. Health. 35 (3):415–432. doi:10.2486/indhealth.35.415.
- Ku, B. K., and G. Deye. 2018. Characterization of airborne fibrous particle deposition on screens with different configurations. Abstract of International Aerosol Conference, St. Louis, MO, September 2–7.
- Ku, B. K., G. Deye, and L. A. Turkevich. 2013. Characterization of a vortex shaking method for aerosolizing fibers. Aerosol. Sci. Technol. 47 (12):1293–1301. doi:10.1080/02786826.2013.836588.
- Ku, B. K., G. J. Deye, and L. A. Turkevich. 2014. Efficacy of screens in removing long fibers from an aerosol stream – Sample preparation technique for toxicology studies. Inhal. Toxicol. 26 (2):70–83. doi:10.3109/08958378.2013.854851.
- Ku, B. K., G. Deye, and L. A. Turkevich. 2017. Screen collection efficiency of airborne fibers with monodisperse length. J. Aerosol. Sci. 114:250–262. doi:10.1016/j.jaerosci.2017.09.006.
- Ku, B. K., G. Deye, and L. A. Turkevich. 2018. Direct measurement of aerosol glass fiber alignment in a DC electric field. Aerosol. Sci. Technol. 52 (2):123–135. doi:10.1080/02786826.2017.1387640.
- Lam, C. O., and W. H. Finlay. 2009. Changes in collection efficiency in nylon net filter media through magnetic alignment of elongated aerosol particles. J. Occup. Environ. Hyg. 6 (10):648–657. doi:10.1080/15459620903139136.
- Lee, K. W., and M. Ramamurthi. 2001. Filter collection. In Aerosol measurement: Principles, techniques, and applications, eds. P. A. Baron and K. Willeke., 197–228. 2nd ed. New York: John Wiley & Sons, Inc.
- Menas, A. L., N. Yanamala, M. T. Farcas, M. Russo, S. Friend, P. M. Fournier, A. Star, I. Iavicoli, G. V. Shurin, U. B. Vogel, et al. 2017. Fibrillar vs crystalline nanocellulose pulmonary epithelial cell responses: Cytotoxicity or inflammation?. Chemosphere. 171:671–680. doi:10.1016/j.chemosphere.2016.12.105.
- Myojo, T. 1999. A simple method to determine the length distribution of fibrous aerosols. Aerosol. Sci. Technol. 30 (1):30–39. doi:10.1080/027868299304868.
- NIOSH. 2011. Asbestos fibers and other elongate mineral particles: State of the Science and Roadmap for Research [DHHS (NIOSH) Publication No. 2011-159] Accessed January 2013. http://www.cdc.gov/niosh/docs/2011-159/pdfs/2011-159.pdf
- Northington, D. J. 1987. Inductively coupled plasma-mass spectrometry for the analysis of metals in membrane filters. Am. Ind. Hyg. Assoc. J. 48 (12):977–979. doi:10.1202/0002-8894(1987)048<0977:ICPSFT > 2.0.CO;2.
- Park, E. J., T. O. Khaliullin, M. R. Shurin, E. R. Kisin, N. Yanamala, B. Fadeel, J. Chang, and A. A. Shvedova. 2018. Fibrous nanocellulose, crystalline nanocellulose, carbon nanotubes, and crocidolite asbestos elicit disparate immune responses upon pharyngeal aspiration in mice. J. Immunotoxicol. 15 (1):12–23. doi:10.1080/1547691X.2017.1414339.
- Seto, T., T. Furukawa, Y. Otani, K. Uchida, and S. Endo. 2010. Filtration of Multi-Walled carbon nanotube aerosol by fibrous filters. Aerosol. Sci. Technol. 44 (9):734–740. doi:10.1080/02786826.2010.487881.
- Spurny, K. R., J. P. Lodge, E. R. Frank, and D. C. Sheesley. 1969. Aerosol filtration by means of nuclepore filters. Environ. Sci. Technol. 3 (5):453–464. doi:10.1021/es60028a004.
- Stanton, M. F., M. Layard, A. Tegeris, E. Miller, M. May, E. Morgan, and A. Smith. 1981. Relation of particle dimension to carcinogenicity in amphibole asbestoses and other fibrous minerals. J Natl. Cancer. Inst. 67 (5):965–975. doi:10.1093/jnci/67.5.965.
- Timbrell, V. 1982. Deposition and retention of fibres in the human lung. Ann. Occup. Hyg. 26 (1–4):347–369. doi:10.1093/annhyg/26.2.347.
- Tuchman, D. P., J. C. Volkwein, and R. P. Vinson. 2008. Implementing infrared determination of quartz particulates on novel filters for a prototype dust monitor. J. Environ. Monit. 10(5):671–678. doi:10.1039/b803804j.
- Wang, C.-S., and Y. Otani. 2012. Removal of nanoparticles from gas streams by fibrous filters: a review. Ind. Eng. Chem. Res. 52 (1):5–17. doi:10.1021/ie300574m.
- Wang, J., Kim, S. C., and Pui, D. Y. H. (2011). Measurement of multi-wall carbon nanotube penetration through a screen filter and single-fiber analysis. J. Nanoparticle Res. 13:4565–4573.
- Wylie, A. G., and P. A. Candela. 2015. Methodologies for determining the sources, characteristics, distribution, and abundance of asbestiform and nonasbestiform amphibole and serpentine in ambient air and water. J. Toxicol. Environ. Health. B. 18 (1):1–42. doi:10.1080/10937404.2014.997945.
- Yamamoto, N., K. Kumagai, M. Fujii, D. G. Shendell, O. Endo, and Y. Yanagisawa. 2005. Size-dependent collection of micrometer-sized particles using nylon mesh. Atmos. Environ. 39 (20):3675–3685. doi:10.1016/j.atmosenv.2005.03.001.
- Yanamala, N., M. T. Farcas, M. K. Hatfield, E. R. Kisin, V. E. Kagan, C. L. Geraci, and A. A. Shvedova. 2014. In vivo evaluation of the pulmonary toxicity of cellulose nanocrystals: A renewable and sustainable nanomaterial of the future. ACS Sustain. Chem. Eng. 2 (7):1691–1698. doi:10.1021/sc500153k.
- Yeh, H. C., and B. Y. H. Liu. 1974. Aerosol filtration by fibrous filters. J. Aerosol. Sci. 5 (2):191–217. doi:10.1016/0021-8502(74)90049-4.