
 ?Mathematical formulae have been encoded as MathML and are displayed in this HTML version using MathJax in order to improve their display. Uncheck the box to turn MathJax off. This feature requires Javascript. Click on a formula to zoom.
Abstract
An experimental setup to determine the particle size distribution (PSD) of a pressurized oil aerosol ( was validated. The combination of optical particle counter (OPC) and scanning mobility particle sizer (SMPS) measurements allowed for the evaluation of PSDs in the size range
. The raw gas oil emissions of two oil injected screw compressors were determined and compared to a test aerosol generated by a Laskin Nozzle aerosol generator. While the screw compressors showed considerable differences in gravimetric oil load, the normalized PSDs of both compressors were found to be similar, exhibiting main mass fractions in the particle size range between 0.1 and 2 µm.
The influence of operating conditions on the fractional separation efficiency of fibrous oil mist filters was also studied in this work using a conventional air/oil separator filter. An increase of either pressure, temperature, filter face velocity or oil loading rate led to a deterioration of separation efficiency emphasizing the need for filter testing under realistic operating conditions.
Copyright © 2019 American Association for Aerosol Research
EDITOR:
Introduction
Oil injected screw compressors are widely used in industry to provide compressed air. The compression process leads to the formation of an oil aerosol that needs to be separated from the gas phase in order to comply with purity requirements for compressed air (ISO 8573-1 2010). In general, fibrous glass filters are used as air/oil separators to remove the liquid oil content. Mead-Hunter, King, and Mullins (Citation2014) give a good overview of the extensive investigations that have been carried out regarding this type of filter. Current research by Wurster et al. (Citation2015) and Wurster, Meyer, and Kasper Citation2017) focuses to a large extend on the re-entrainment of droplets from oil mist coalescing filters. Bubbling was found to be the most likely mechanism for re-entrainment. As a model for the liquid transport through fibrous filter media, the jump and channel model (J&C) was proposed by Kampa et al. (Citation2014) and Kolb, Meyer, and Kasper (Citation2017). Penner et al. (Citation2019) showed recently that the penetration of oil mist filters was strongly correlated to the liquid transport through the media as described by the J&C model. According to their experimental results, the residual oil content under steady state operating conditions was significantly dependent on the operating conditions of the filter. Re-entrainment of droplets was found to dominate the clean gas concentration of highly efficient oleophilic filters.
The aforementioned investigations involved the determination of particle number and size by shadowgraphy, OPC as well as SMPS measurements, whereby pressures were kept close to ambient conditions. Many of the 121 journal papers reviewed by Mead-Hunter, King, and Mullins (2014) were also scanned by the authors in search for measurement at elevated pressure, yet none was found. Mead-Hunter, King, and Mullins (2014) stated that most of the models used to describe the filtration process in oil mist coalescing filters developed to date, were empirically derived, and therefore, only applicable to a narrow range of filter media and operating conditions. Therefore, investigations at elevated pressures are needed to further characterize the influence of operating conditions on the separation efficiency of highly efficient fibrous filter media.
The pressure-dependence of separation processes has indeed been studied in literature related to (electrical) low pressure impactors. These devices use the fact that the particle settling velocity increases significantly in low-pressure environment allowing the capture of very small particles (Berner, Citation1972). Keskinen, Pietarinen, and Lehtimäki (Citation1992) reported an impactor cut-size diameter down to
for a DOP aerosol
at operating pressure
. The calculation procedure of the cut-size diameter has been described in detail by Hillamo and Kauppinen (Citation1991). Accordingly, the key parameter characterizing inertial separation in an impactor was the Stokes number
(1)
(1)
with particle density
, particle diameter
, jet velocity
, nozzle diameter w and Cunningham slip correction factor
. While the gas viscosity
is mainly a function of temperature, the slip correction
is a function of particle diameter and mean free path of air molecules
which is a function of pressure
and temperature
(Allen and Raabe, Citation1982; Hillamo and Kauppinen, Citation1991). According to these findings, a deterioration of separation efficiency towards higher pressures compared to ambient pressure is to be expected.
In order to determine the fractional separation efficiency of the oil mist filters, particle size distributions (PSDs) need to be measured accurately. An OPC based on white-light scattering suitable to operate at a pressure of up to 10 bar is commercially available (Palas Welas 2000P). However, the lower limit of its measurement range (0.2 µm–40 µm) is larger than the most penetrating particle size (MPPS) as determined by Mullins et al. (Citation2014). Lyko (Citation2015) theoretically addressed the problem of compressed air filter testing in the MPPS-range at elevated pressures and recommended the depressurization of the aerosol prior to droplet size measurement. However, he emphasized the need for careful validation of the depressurization process in order to avoid particle losses. Mölter-Siemens, Korczyk, and Blattner (Citation2014) investigated the depressurization of an oil aerosol using different devices such as pressure regulator, micro valve and critical nozzle. A significant particle loss in the size range
was determined by a comparative OPC measurement, while the expansion in the critical nozzle yielded the most promising result.
High droplet concentrations require aerosol dilution to avoid coincident measurement with the OPC. An ejector dilution system suitable for aerosol dilution at a pressure of up to 10 bar is commercially available (Palas VKL 10 ED). The system requires the supply of additional dilution air (Hueglin, Scherrer, and Burtscher Citation1997). This is a major drawback since small pressure fluctuations in the plant can affect the dilution ratio. Moreover, the total flowrate in the test rig is increased by the dilution air which can make the flow and pressure control of the test rig quite challenging. In contrast, the bypass dilution principle promises easier applicability since no additional air needs to be supplied. Collins (Citation2010) studied the size dependent particle loss of a TSI 3302 bypass dilution at ambient pressure and found a uniform aerosol dilution even for very small particles in the size range . To the author’s knowledge, the bypass principle has not been applied at elevated pressures yet.
In this article, we present an experimental setup allowing to determine the PSD of an oil aerosol in the size range from to
at a pressure of up to
combining OPC and SMPS measurements. Although, the authors believe that the measurement setup is also valid for particle size measurement up to 5 µm, the test aerosol used so far did not allow validation of the method within the size range
due to the very low number of particles detected in this range. After validation of the setup, the influence of operating conditions such as pressure, temperature, filter face velocity and oil loading rate on the separation efficiency of a conventional air/oil separator are investigated. Moreover, the PSD and gravimetric oil load emitted from two different oil injected screw compressors are determined. To our knowledge, a representative PSD of screw compressors has not been published so far, even though this information would help to allow a targeted optimization of the oil mist separator. For example, a suitable multistage concept consisting of inertial separator and fibrous glass filter may have advantages over a single-stage glass fiber filter, such as a reduced residual oil content due to re-entrainment or an extended lifetime of the filter.
Experimental section
shows a schematic of the experimental setup. The aerosol is either generated by a screw compressor or an aerosol generator (AG). Two screw compressors have been investigated: A new Atlas Copco GA 7 VSD + and a Boge S10 that has been purchased secondhand (year of construction: 2004). The GA 7 has a vertical air/oil separator vessel with tangential inlet promising good pre-separation upstream of an air/oil separating filter. The rotor speed is adjustable, thus, different volumetric flow rates at constant pressure level can be obtained. The S10 has a rather compact setup including a horizontal air/oil separator vessel with a centric inlet, potentially providing a less efficient pre-separation. The rotor speed is fixed, consequently, the volumetric flow rate is a function of pressure with
The compressors were filled with suitable compressor oil Atlas Copco RIF Ndurance and Boge 3000 plus, respectively. Relevant material properties of the oils are shown in . While dynamic viscosity
and density
of the oils are very similar, the surface tension
differs by about 10%. The temperature dependence, particularly of the dynamic viscosity is pronounced.
Figure 1. Experimental setup.
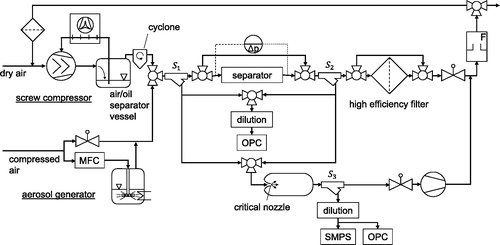
Table 1. Density , surface tension
and dynamic viscosity
of the compressor oil at distinct temperatures
.
The air/oil separator filter of the compressors was removed and the test rig was directly connected to the outlet of the respective air/oil separator vessel. A cyclone separator was connected to that vessel in order to separate the coarse oil fraction from the fine aerosol. The cyclone cut-size was between 6 and 10 µm depending on the flow conditions. The measurements were carried out under steady state conditions after a period of warm-up. Typical temperatures at the compression unit outlet were between 75 °C and 80 °C.
The aerosol generator as an alternative aerosol source was used to provide a highly reproducible and time-stable aerosol for filter testing and validation purposes. A Laskin Nozzle with 20 holes (from a Palas PLG 2100) was immersed in the oil to be atomized (Atlas Copco RIF Ndurance). The volumetric flow rate was controlled by a mass flow controller (MFC) and held constant at 45 l/min for all pressure levels. The oil temperature was kept at a constant temperature of 60 °C, since the physical properties of the oil relevant for atomization, such as surface tension and in particular dynamic viscosity, strongly depend on temperature. The aerosol was mixed with additional clean air supplied through a control valve.
Flow measurement was conducted according to DIN EN ISO 5167-2 using a measuring orifice. The volumetric flow rate was between 75 and 200 l/min. A needle valve served to regulate the pressure level in the test rig between 3 and 10 bar. The individual components of the test rig (except for the aerosol generator) were neither thermally insulated nor heated. In order to avoid condensation of moisture, the aerosol generator was operated with dry air. When using a screw compressor for aerosol generation, filtered air was recirculated and mixed with additional dry air, gradually reducing the moisture content in the system below the prevailing saturation pressure.
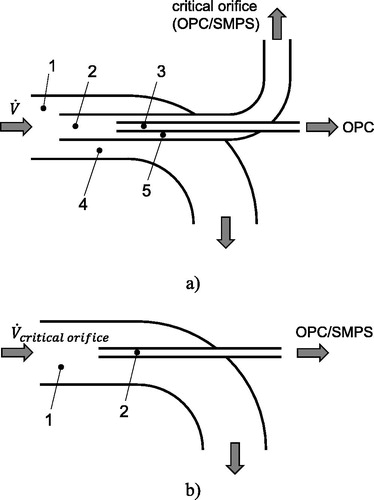
Sampling for online PSD measurements of raw and clean gas ( and
) was obtained by a pipe in pipe setup, as shown in . The pipe diameters were sized to achieve isokinetic sampling at
(see Table S2 in online Supplementary Information [SI]). Following the investigations carried out by Bohnet (Citation1973) and Zenker (Citation1971), the error due to non-isokinetic sampling for other flow rates was assessed and found to be negligible in the entire particle size range considered. Yet some validation experiments were carried out as shown in the SI.
Figure 2. Setup for near-isokinetic sampling. Sampling positions ,
,
with respect to : (a) pipe-in-pipe setup for high-pressure sampling of raw (
) and clean gas (
); (b) isokinetic sampling at ambient pressure (
).
The sample flow of 5 l/min from the smallest pipe was used for isobaric optical measurement of the PSD with an OPC (Palas Welas 2000 HP; Sensor 2070 HP) and was controlled by the MFC integrated in the OPC. In order to avoid measurement errors due to coincidence, dilution of the aerosol was necessary. A cascade of up to two bypass dilution stages was used to realize dilution factors between 20 and 2000. shows the bypass dilution setup schematically. The main flow was lead over a high efficiency filter while a small fraction of the flow (1/20 or 1/100) was lead through a capillary tube (purchased from TSI: or
). The flow ratio was controlled by a needle valve according to the pressure difference measured across the pipe length
. For laminar flow conditions in the pipe, the pressure difference
is correlated to the flow rate
(TSI, 2003),that is,
(2)
(2)
Figure 3. Schematic of the bypass dilution setup.
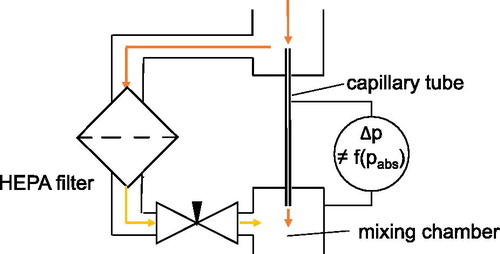
Since the dynamic gas viscosity is only a weak function of pressure, the calibrated target pressure difference
or
, respectively, is independent of pressure for laminar flow conditions. Further analysis regarding the Capillary Reynolds numbers
is presented in the SI. Apart from the pressure-independent calibration, the main advantage of the prescribed bypass dilution over ejector dilution systems is the fact that no extra dilution air needs to be supplied.
For SMPS and OPC measurements at ambient pressure, a sample flow of approximately 28 l/min was expanded to ambient pressure into a large cylindrical tank ( through a toroidal critical nozzle (
). In order to avoid droplet impingement on the walls, the flow entered the tank axially. The pressure in the tank was kept constant at
slightly below ambient pressure by a control valve and a suction pump. From the expanded flow, a small sample flow of 5.3 l/min was taken at position
() using the elbow shown in . The pipe diameters were sized to achieve isokinetic sampling at
which equals the flow rate for a working pressure upstream the critical nozzle of
. The sample was diluted using bypass dilution and split between OPC and SMPS (TSI: Classifier 3082; Neutralizer 3088; DMA 3081; CPC 3775). Sampling flow rate for the SMPS was
, sheath flow rate was
. The ratio between sheath and sampling flow rate was chosen smaller than the default value of the measuring device, which is 10 in order to allow the measurement of larger droplets up to
. Since the pressure at the sampling position was kept constant, the flow conditions for OPC and SMPS were stable. From raw and clean gas PSDs, the separation efficiency
of the investigated oil mist separators was calculated by
(3)
(3)
where
and
denote particle number concentrations in the clean and raw gas samples, respectively. Since the PSD was measured sequentially by switching between raw and clean gas sampling, steady state operating conditions were to be assured.
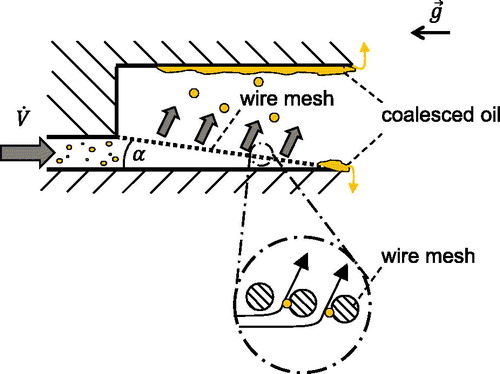
Two different oil mist separators were studied: A conventional air/oil separator consisting of 14 wound layers of glass fiber material with a filter face area (Atlas Copco #2202 9294 00) and a wire mesh inertial separator. The separation principle of the wire mesh separator was described by Kaiser, Rief, and Piesche (Citation2018). The employed wire mesh separator is shown in . It has an angle of attack of
and uses a square mesh (Sefar Petex 07-33/21) with an integrated area of
2. In the schematic, the wire mesh is represented by a set of aligned parallel cylinders. The flow experiences a sharp deflection on the wire mesh, leading to high streamline curvature in vicinity of the wires. Due to their inertia, droplets impinge on the wires forming larger droplets as a result of coalescence. The coalesced oil is either transported downstream along the mesh or blown off the wire mesh forming a liquid film on the opposing wall. The separator was placed in a large vessel allowing phase separation of the coalesced oil and the clean gas due to gravitational settling.
Figure 4. Schematic of the wire mesh inertial separator.
For gravimetric measurements of the fine fraction in raw and clean gas, high efficiency flat filter media with a diameter of 125 mm were used (Whatman GF/D or GF/F).
Results
Validation bypass dilution method
Validation of the bypass dilution setup has been conducted by comparing the measured PSD with and without the respective dilution stage. The dilution factor is calculated as a function of the particle size
by dividing the respective concentrations
(4)
(4)
An ideal dilution stage would provide in the entire particle size range. illustrates that a uniform dilution of the aerosol close to the target dilution factor
for the larger capillary and
for the smaller capillary is achieved in a wide particle size range. The increased variance for larger particle diameters is attributed to the low number of particles of the calibration aerosol in this size range (see ) leading to poor statistics. Towards the lower limit of the measurement range, poor counting efficiency results in a low number of detected particles. The calibrated target pressure losses
and
agree well with the theoretical values
and
, respectively.
Figure 5. Normalized aerosol dilution as function of the particle diameter
measured with the OPC
. Aerosol source: AG;
.
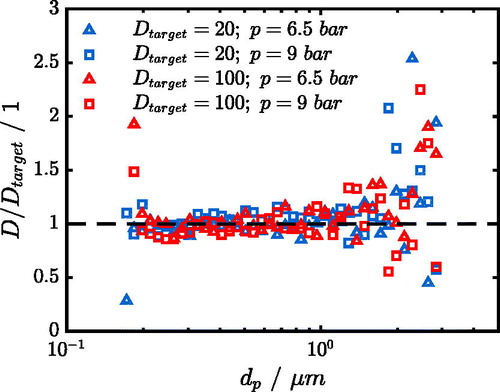
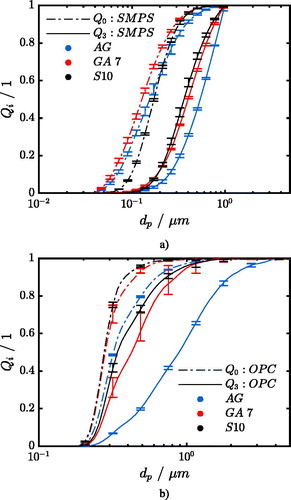
Figure 6. Mean cumulative number and mass distribution and
as a function of particle diameter
at varying operating conditions; (a) SMPS measurement (b) OPC measurement
. Aerosol sources: AG:
;
; GA 7:
;
; S10:
;
Measured value ranges indicated by range bars (I).
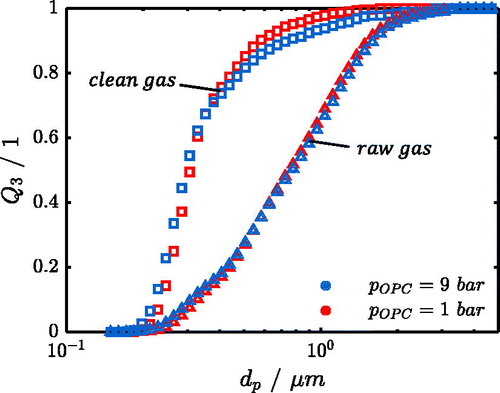
Validation measurement after expansion to ambient pressure
Expansion of the aerosol in the critical nozzle is essential to be able to measure the PSD in the size range below the lower measurement limit of the OPC ( using a conventional SMPS. In the critical nozzle, the fluid is accelerated to the speed of sound with a discontinuity in pressure at the nozzle outlet. This can potentially cause a change of the aerosol properties due to coalescence or atomization.
An alteration of the aerosol within the measurement range of the OPC can be examined by comparing the OPC measurement at operating pressure with the measurement after expansion to ambient pressure. shows the cumulative mass distribution for raw and clean gas at both pressures in case of the wire mesh inertial separator. Mass based
was chosen instead of number based
for better visualization of larger particle sizes that appear only in small numbers. After Stieß (Citation2009),
and
can be calculated discreetly from the number density distribution
for each measurement interval
with particle size range
by
(5)
(5)
(6)
(6)
where N denotes the total number of measurement intervals.
Figure 7. Cumulative mass distribution for raw and clean gas of the wire mesh separator as a function of particle diameter
obtained from OPC measurement at operating and ambient pressure. Aerosol source: AG;
.
For the raw gas measurement, the distributions at both pressures are almost identical. The measurement of the clean gas distribution shows slightly more particles for
at ambient pressure. This is likely due to droplet coalescence.
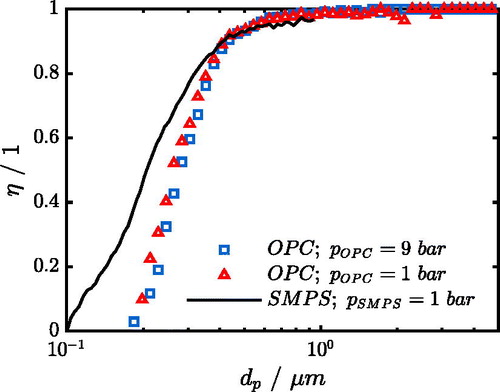
For further validation, the separation efficiency of the wire mesh inertial separator was determined at both OPC pressure levels. shows good agreement between both results. Only for larger droplet diameters, a slight deviation of the fractional separation efficiency can be observed due to the aforementioned droplet coalescence rate. The separation efficiency curve measured with the SMPS is also shown in . It exhibits a deviation from the separation efficiency curves determined with the OPC which is attributed to the different measuring principles of the devices (electrodynamic vs. optical).
Figure 8. Fractional efficiency of the wire mesh separator as a function of particle diameter
obtained from OPC-measurements at operating and ambient pressure and SMPS measurements at ambient pressure. Aerosol source: AG;
;
The accuracy of the OPC measurement at ambient pressure was considered sufficient to determine a representative PSD of the prescribed screw compressors and to evaluate the influence of operating conditions on the separation efficiency of oil mist separators. For the SMPS measurement it was assumed that the alteration of the aerosol in the size range below the measurement range of the OPC was not more severe than within that measurement range.
Particle size distribution and oil load of screw compressors
compares the PSD of the aerosol generator (AG) and the screw compressors (GA 7 and S10) for SMPS and OPC measurements. The curves show the mean value of the normalized cumulative number and mass distributions and
determined from the measurements within the respective operating range. Minimum and maximum values of
and
are expressed by the range bars. They indicate that the normalized cumulative number and mass distributions
and
depend only weakly on the operating conditions. The highest variation is observed for the OPC measurement of the GA 7. The PSDs for both screw compressors are quite similar, only for the aerosol generator larger particles were measured.
The distributions of the compressors as determined with the SMPS show that more than 60% of the particles are smaller than the lower measurement limit of the OPC (
). Since smaller particles carry little mass, the
distributions are shifted towards larger particle diameters. The information from SMPS and OPC measurement can be combined in order to define the particle size range carrying the major mass fraction (
: lower limit;
: upper limit). It is found that after pre-separation of their oil aerosol emissions by a cyclone separator (see ), the major mass fraction of the remaining emissions of both screw compressors is carried by particles in the size range between
. This information allows for the targeted design of a multistage oil-mist separator incorporating an inertial pre-separator.
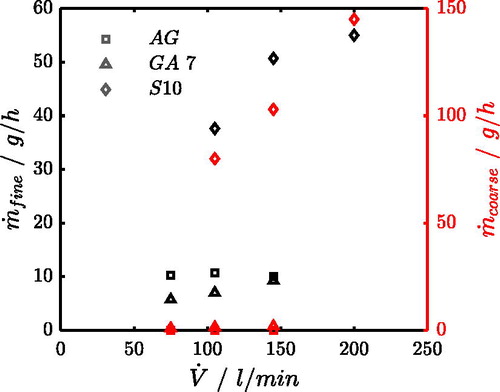
Gravimetric measurements of coarse and fine fractions of the aerosol are presented in . The emission of coarse oil of the S10 exceeds the emission of the GA 7 by about two magnitudes, the latter featuring better pre-separation in the air/oil separator vessel. The fine fractions
of the aerosol generator and the GA 7 are of the same order of magnitude while the respective oil load of the S10 is higher by about half a magnitude. This may either be due to differences in design and manufacturing technology or due to the high number of operating hours already performed by the S10 compressor.
Figure 9. Gravimetric oil load of fine and coarse fractions as a function of flow rate . Aerosol sources: AG:
; GA 7:
; S10:
;
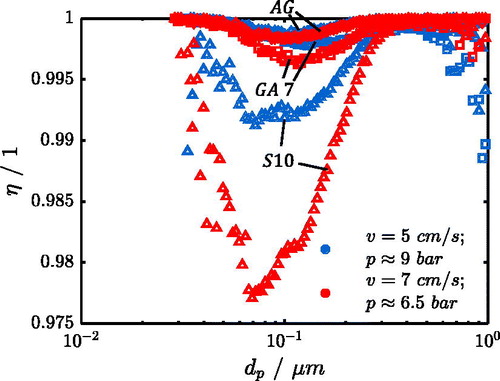
Separation efficiency of a conventional air/oil separator
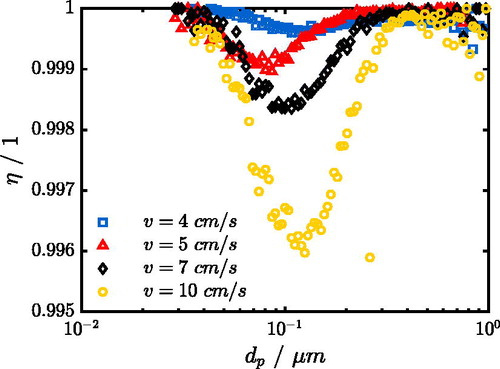
Influence of filter face velocity
Penner et al. (2019) reported recently that the fractional separation efficiency of oleophobic glass fiber filter media at ambient pressure was strongly dependent on the filter face velocity. shows a shift of the MPPS towards smaller particle diameters for a moderate increase of filter face velocity from to
due to enhanced inertial separation when investigating the conventional air/oil separator. Further increase of the filter face velocity leads to a significant deterioration in fractional separation efficiency in accordance with the findings of Penner et al. (2019). The separation efficiency for large particle diameters (
in ) is subject to strong statistical deviations due to the small number of particles in the raw gas in this size range (see ).
Figure 10. Fractional separation efficiency of the conventional air/oil separator as a function of particle diameter
for different filter face velocities
. Aerosol source: AG;
.
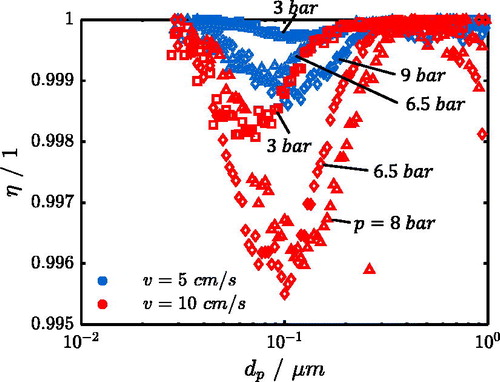
Influence of pressure
illustrates the fractional separation efficiency for two distinct filter face velocities at different pressures. Separation efficiency is significantly impacted by a rise in pressure from to
. With a further increase in pressure to
and
, respectively, the deterioration of separation efficiency is less pronounced. We argue that this can be mainly attributed to the pressure-dependency of the Cunningham slip correction factor
which influences the dominant separation mechanisms inertia and diffusion. This will be discussed in more detail in the following.
Figure 11. Fractional separation efficiency of the conventional air/oil separator as a function of particle diameter
for different pressures
and filter face velocities
. Aerosol source: AG.
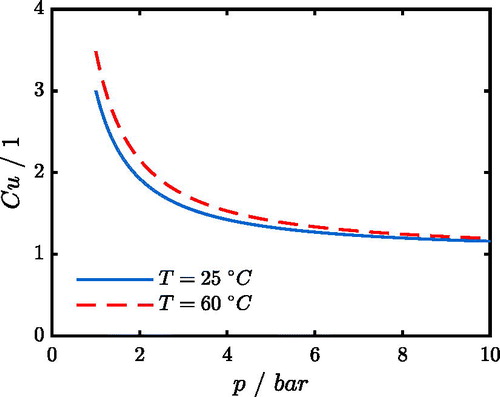
shows as a function of pressure for a
particle, calculated after Allen and Raabe (Citation1982). The calculation procedure is documented in the SI. The value of
decreases with pressure. According to Mead-Hunter, King, and Mullins (2014), the Stokes number
(7)
(7)
characterizes inertial separation on a fiber with diameter
. The single fiber efficiency due to impaction
can be determined by the equation developed by Stechkina, Kirsch, and Fuchs (Citation1969)
(8)
(8)
with the Kuwabara hydrodynamic factor
that is a function of the packing density of the filter
.
denotes the ratio between droplet and fiber diameter. Assuming that EquationEquation (8)
(8)
(8) is valid, the single fiber efficiency due to inertial separation is directly proportional to the Cunningham slip factor and hence decreases with pressure
(9)
(9)
Figure 12. Cunningham slip correction factor for a particle with as a function of pressure and temperature.
The Peclet number is the corresponding identifier for diffusional separation (Mead-Hunter, King, and Mullins Citation2014)
(10)
(10)
with
(11)
(11)
The single fiber efficiency by diffusion can generally be expressed by
(12)
(12)
with a filter-specific constant
(Cheng, Yamada, and Yeh Citation1990). Provided that EquationEquation (12)
(12)
(12) is valid, the single fiber efficiency by diffusion is related to
by
(13)
(13)
and therefore, also decreases with pressure. Yet a quantitative analysis of the influence of the Cunningham slip correction factor on the separation efficiency of an entire oil mist filter is extremely difficult. First, the individual effects on the single fiber efficiency would need to be combined in order to obtain the single fiber efficiency
. For this purpose, various empirical nonlinear formulas have been proposed (Hinds, Citation1999; Raynor and Leith, Citation2000). To apply these formulas, single fiber efficiency by interception
would also have to be evaluated correctly. Second, the total efficiency of the filter
would need to be calculated from the single fiber efficiency
. Again, various empirical nonlinear formulas are available as shown by Mead-Hunter, King, and Mullins et al. (Citation2014). The empirical nature of the models and the related high uncertainty impedes further reliable quantitative analysis regarding the influence of the Cunningham slip correction factor on the measured separation efficiency to date. Further investigations are required.
Influence of temperature
To investigate the influence of temperature, the fractional separation efficiency was measured using different aerosol sources. Analysis of the oil loading rates of the aerosol generator AG and the compressor GA 7 yielded comparable results (see ). Hence, the main difference between the respective operating conditions was the temperature at the separator (AG: ; GA 7:
. indicates a certain deterioration of the fractional separation efficiency for the higher temperature. This can partly be explained by an increase of the temperature-dependent dynamic air viscosity by around 10% in the given temperature range. However, the difference in separation efficiency between the aerosol sources is more pronounced than expected, especially since particle diffusion is stronger at higher temperatures and the Cunningham slip correction increases with temperature. One possible explanation is a higher re-entrainment rate of fine droplets at higher temperature because the physical oil properties are temperature dependent. Dynamic viscosity η at 60 °C is about 5 times lower than at 25 °C (see ). According to the findings by Wurster, Meyer, and Kasper (Citation2017), the disintegration process of bubbles, that is, the number of fragments generated per bursting bubble rises with decreasing dynamic viscosity potentially leading to an increase in re-entrainment.
Figure 13. Fractional separation efficiency of the air/oil separator as a function of particle diameter
for different aerosol sources at characteristic operating conditions.
Moreover, surface tension decreases by about 10% within the temperature range given. A strong influence of surface tension on the pressure drop of oil mist filters was reported by Contal et al. (2004). Reduced surface tension may enhance spreading of the liquid within the filter media leading to larger drainage channels and higher interstitial velocity which can intensify re-entrainment of collected oil. This assumption is supported by findings of Penner et al. (2019) according to which filter penetration is directly correlated to the liquid transport through the filter.
Influence of oil loading rate
The screw compressor S10 exhibits the highest oil aerosol emission (see ). The temperature at the separator was the same as for the GA 7 (around 60 °C), so the influence of the oil loading rate on the separation efficiency can be evaluated by comparing the results of the GA 7 with those of the S10 in . One observes that especially for the high face velocity, separation efficiency at the MPPS drops considerably with loading rate, that is, from 99.6% (GA 7) to 97.5% (S10). This may either be due to an enhanced re-entrainment rate or to a poorer separation efficiency of the filter as a result of an increased interstitial velocity when the filter is heavily loaded.
Summary and conclusions
An experimental setup to determine the particle size distribution of screw compressors and the separation efficiency of air/oil separators at pressure levels up to 10 bar has been validated. The employed bypass dilution method was found to be suitable for simple and reliable aerosol dilution at elevated pressure levels. Through expansion of the aerosol in a critical nozzle to ambient pressure, it was possible to measure the PSD using a conventional SMPS. A severe change of the aerosol size distribution due to the expansion was ruled out by means of a comparative OPC measurement.
The gravimetric oil loading rate emitted by two different screw compressors varied by half a magnitude for the fine fraction and two magnitudes for the coarse fraction while the normalized PSD in the particle size range was quite similar. The PSD showed a fine aerosol with a high mass fraction in the particle size range between
and
. This information can be used to design multistage air/oil separators, for example, incorporating an inertial pre-separator aiming to reduce the oil load on a downstream air/oil separator, potentially leading to a reduced residual oil content as well as an extended lifetime of the latter.
The fractional separation efficiency of a conventional glass fiber air/oil separator exhibited a strong dependence on the operating conditions. An increase of either pressure, temperature, filter face velocity and especially oil loading rate led to a deterioration of its separation efficiency. Of the aforementioned effects, the temperature dependence was the least pronounced.
Based on the above, filter testing under realistic operating conditions is strongly recommended. In addition, for further specific analysis of the individual influencing factors on the separation efficiency of fibrous filters, the Laskin Nozzle aerosol generator can be employed since the PSD of the test aerosol matches a real compressor aerosol quite well.
Supplemental Material
Download PDF (313.8 KB)Disclosure statement
No potential conflict of interest was reported by the authors.
Additional information
Funding
References
- Allen, M. D., and O. G. Raabe. 1982. Re-evaluation of Millikan's oil drop data for the motion of small particles in air. J. Aerosol. Sci. 13 (6):537–547. doi: 10.1016/0021-8502(82)90019-2.
- Berner, A. 1972. Praktische erfahrungen mit einem 20-Stufen-Impaktor. Staub-Reinhaltung Der Luft 32:315–320.
- Bohnet, M. 1973. Staubgehaltsbestimmung in strömenden gasen. Chem. Ing. Tech. 45 (1):18–24. doi: 10.1002/cite.330450104.
- Cheng, Y. S., Y. Yamada, and H. C. Yeh. 1990. Diffusion deposition on model fibrous filters with intermediate porosity. Aerosol Sci. Technol. 12 (2):286–299. doi: 10.1080/02786829008959347.
- Collins, A. M. 2010. Ultrafine particle loss in aerosol diluters. University of Minnesota. http://hdl.handle.net/11299/103245.
- Contal, P., J. Simao, D. Thomas, T. Frising, S. Callé, J. C. Appert-Collin, and D. Bémer. 2004. Clogging of fibre filters by submicron droplets. Phenomena and influence of operating conditions. J. Aerosol Sci. 35 (2):263–278. doi: 10.1016/j.jaerosci.2003.07.003.
- Hillamo, R. E., and E. I. Kauppinen. 1991. On the performance of the Berner low pressure impactor. Aerosol Sci. Technol. 14 (1):33–47. doi: 10.1080/02786829108959469.
- Hinds, W. C. 1999. Aerosol technology: Properties, behavior, and measurement of airborne particles. New York: Wiley.
- Hueglin, C., L. Scherrer, and H. Burtscher. 1997. An accurate, continuously adjustable dilution system (1: 10 to 1: 104) for submicron aerosols. J. Aerosol Sci. 28 (6):1049–1055. doi: 10.1016/S0021-8502(96)00485-5.
- ISO 8573-1. 2010. Compressed air - Part 1: Contaminants and purity classes. https://www.beuth.de/de/norm/iso-8573-1/129017461.
- Kaiser, S., C. Rief, and M. Piesche. 2018. Droplet separation using woven wire mesh in cross-flow. Proceedings of FILTECH, Köln. ISBN: 3941655159
- Kampa, D., S. Wurster, J. Buzengeiger, J. Meyer, and G. Kasper. 2014. Pressure drop and liquid transport through coalescence filter media used for oil mist filtration. Int. J. Multiphase Flow 58:313–324. doi: 10.1016/j.ijmultiphaseflow.2013.10.007.
- Keskinen, J., K. Pietarinen, and M. Lehtimäki. 1992. Electrical low pressure impactor. J. Aerosol Sci. 23 (4):353–360. doi: 10.1016/0021-8502(92)90004-F.
- Kolb, H. E., J. Meyer, and G. Kasper. 2017. Flow velocity dependence of the pressure drop of oil mist filters. Chem. Eng. Sci. 166:107–114. doi: 10.1016/j.ces.2017.03.028.
- Lyko, H. 2015. Particle measuring technology and filter testing according to the latest state of the art. 15, 14–20. F&S International Edition. http://www.fs-journal.de/Schwerpunktthemen/2015/english/03-Particle-measuring-technology-and-filter-testing-according-to-the-latest-state-of-the-art.pdf.
- Mead-Hunter, R., A. J. King, and B. J. Mullins. 2014. Aerosol-mist coalescing filters – a review. Sep. Purif. Technol. 133:484–506. doi: 10.1016/j.seppur.2014.06.057.
- Mölter-Siemens, W., B. Korczyk, and J. Blattner. 2014. Ändert sich die Partikel- oder Tröpfchengrößenverteilung bei der Entspannung von komprimierten Aerosolen? Experimentelle untersuchungen am fallbeispiel „druckluftfiltertest”. 28. Karlsruhe: Aerosol Technologie Seminar.
- Mullins, B. J., R. Mead-Hunter, R. N. Pitta, G. Kasper, and W. Heikamp. 2014. Comparative performance of philic and phobic oil-mist filters. AIChE J. 60 (8):2976–2984. doi: 10.1002/aic.14479.
- Penner, T., J. Meyer, G. Kasper, and A. Dittler. 2019. Impact of operating conditions on the evolution of droplet penetration in oil mist filters. Sep. Purif. Technol. 211:697–703. doi: 10.1016/j.seppur.2018.10.037.
- Raynor, P. C., and D. Leith. 2000. The influence of accumulated liquid on fibrous filter performance. J. Aerosol Sci. 31 (1):19–34. doi: 10.1016/S0021-8502(99)00029-4.
- Stechkina, I. B., A. A. Kirsch, and N. A. Fuchs. 1969. Studies on fibrous aerosol filters—IV calculation of aerosol deposition in model filters in the range of maximum penetration. Ann. Occup. Hyg. 12 (1):1–8. doi: 10.1093/annhyg/12.1.1.
- Stieß, M. 2009. Mechanische Verfahrenstechnik-Partikeltechnologie 1. Springer-Verlag. ISBN 978-3-540-32552-9. doi: 10.1007/978/3-540-32552-9.
- TSI Inc. 2003. Model 3302A Diluter, Instruction Manual. Revision B. St Paul, MN.
- Wurster, S., J. Meyer, and G. Kasper. 2017. On the relationship of drop entrainment with bubble formation rates in oil mist filters. Sep. Purif. Technol. 179:542–549. doi: 10.1016/j.seppur.2017.02.036.
- Wurster, S., J. Meyer, H. E. Kolb, and G. Kasper. 2015. Bubbling vs. blow-off – on the relevant mechanism(s) of drop entrainment from oil mist filter media. Sep. Purif. Technol. 152:70–79. doi: 10.1016/j.seppur.2015.08.012.
- Zenker, P. 1971. Untersuchungen zur frage der nichtgeschwindigkeitsgleichen teilstromentnahme bei der staubgehaltsbestimmung in strömenden gasen. Staub Reinhalt. Luft. 31 (6):252–256.