
 ?Mathematical formulae have been encoded as MathML and are displayed in this HTML version using MathJax in order to improve their display. Uncheck the box to turn MathJax off. This feature requires Javascript. Click on a formula to zoom.
Abstract
Direct ultraviolet photoionization electrically charges particles using a mechanism distinct from diffusion charging. The purpose of this study is to evaluate aerosol photoemission theory as a function of aerosol particle size, concentration, material, and morphology. Particles are classified using an aerodynamic aerosol classifier (AAC) and subsequently measured with a scanning mobility particle sizer (SMPS) and photoionization measurement system in parallel. This configuration allows direct comparison of photo-emission from high concentrations of initially neutral, monodisperse aerosols with different morphologies or materials. Under all examined conditions, the overall photoelectric yields of particles of self-similar material (silver and unconditioned soot) and morphology (sintered spheres and agglomerates) are each linearly proportional to the second moment of the mobility-equivalent diameter distribution, even in the transition regime (mobility diameter 30–200 nm), with agglomerate silver particles resulting in 5× higher photoelectric yield than unconditioned soot from a propane flame. It is shown for the first time that the photoelectric yield is significantly higher (2.6×) for fractal-like agglomerate silver particles than sintered, close-packed spherical particles of the same material and mobility-equivalent diameter, which is inferred to be due to the larger material surface area exposed externally to the particle surroundings. It is demonstrated that photoelectric measurements of aerosols reflect the photoelectrically active surface area which depends on the particle morphology and therefore the state of sintering.
Copyright © 2019 American Association for Aerosol Research
EDITOR:
1. Introduction
Direct ultraviolet (UV) photoionization is a method for electrically charging aerosols which enables measurements distinct to those from diffusion charging. Direct UV photoionization can yield higher electrical charge states than diffusion charging methods for some nanoparticle materials (Jung, Burtscher, and Schmidt-Ott Citation1988; Matter et al. Citation1995; Mohr, Matter, and Burtscher Citation1996; Jung and Kittelson Citation2005; Li and Chen Citation2011) and the process is material and surface-dependent (Burtscher et al. Citation1982, Citation1984; Niessner Citation1986; Burtscher Citation1992; Matter et al. Citation1995; Mohr, Matter, and Burtscher Citation1996; Burtscher, Künzel, and Hüglin Citation1998; Matter, Siegmann, and Burtscher Citation1999; Keller et al. Citation2001; Bukowiecki et al. Citation2002; Burtscher Citation2005; Jung and Kittelson Citation2005; Kittelson et al. Citation2005; Ott and Siegmann Citation2006). The dependence on particle material and increased charging efficiency, particularly at low particle sizes ( nm), is of interest for emissions measurement (Jung and Kittelson Citation2005), particle classification (Hontañón and Kruis Citation2008), capture (Kulkarni et al. Citation2002; Hogan, Lee, and Biswas Citation2004; Jiang, Lee, and Biswas Citation2007b), controlled deposition (Byeon and Roberts Citation2014), and fundamental studies of nanoparticle material and surface properties (Burtscher et al. Citation1982; Weber et al. Citation1999; Weber, Seipenbusch, and Kasper Citation2001; Röhrbein and Weber Citation2018).
The dependence of photoelectric yield on material or surface properties introduces the opportunity for sensing aerosol material type when particle size and concentration information is known. For example, it has been demonstrated that by combining material-dependent (photoemission) and material-independent (unipolar diffusion charging) measurements adjusted for particle size and concentration, a chemical fingerprint of the surface properties of an aerosol may be determined (Burtscher Citation1992; Keller et al. Citation2001). The photocharging (PC) to diffusion charging (DC) ratio was used to investigate a range of indoor and outdoor aerosols demonstrating its applicability for apportionment of specific aerosol sources (Matter, Siegmann, and Burtscher Citation1999; Bukowiecki et al. Citation2002; Burtscher Citation2005; Kittelson et al. Citation2005; Ott and Siegmann Citation2006). However, to detect a strictly material-dependent chemical fingerprint, the aerosol must have a homogeneous surface material composition, both the PC and DC signal must be dominated by the aerosol material of interest, and the DC signal must scale with the same particle geometric and concentration parameters as the PC signal. Alternatively, in a heterogeneous aerosol mixture, samples with high concentrations of nuclei mode particles may be identified by using the PC to DC ratio (Bukowiecki et al. Citation2002). Corona-charged DC sensors yield signals approximately linear in both particle concentration (N) and particle diameter (),
(Jung and Kittelson Citation2005; Marra, Voetz, and Kiesling Citation2010; Fierz et al. Citation2011; Asbach et al. Citation2012) for particles with diameters between 20 and 200 nm. For polydispersed aerosols, the relation
may be used, where
is the first moment average (arithmetic mean) diameter of a mobility-equivalent diameter distribution (Nishida et al. Citation2019).
In the case of PC devices, however, the photoemission yield is considered proportional to photoelectrically active surface area () (Burtscher Citation1992). The latter is defined only as the part of the surface which contributes to photoemission. In the free molecular regime, the inverse of particle mobility is largely proportional to the square of mobility diameter,
. The dependence of photoemission yield on the inverse of particle mobility has been demonstrated in the free molecular and transition regimes (
nm) for sintered spheres and fractal-like silver agglomerates (Schmidt-Ott Citation1988; Schmidt-Ott et al. Citation1990; Zhou et al. Citation2013), recrystallized Ag and Au (Keller et al. Citation2001), poly-aromatic hydrocarbon (PAH) coated graphite aerosols (measured by diffusion battery) (Niessner Citation1986), carbon agglomerates (Burtscher Citation1992; Nishida, Boies, and Hochgreb Citation2018), and diesel soot (Burtscher, Künzel, and Hüglin Citation1998; Kittelson et al. Citation2005).
The photoemission quantum yield can be measured from the slope of total photoelectric yield as a function of photoelectrically active surface area (). Quantum yields are found to be a strong function of material type, with relatively large values for silver, polycyclic aromatic hydrocarbons (PAHs) and elemental carbon, whereas aerosols such as NaCl (Jung and Kittelson Citation2005), di-octyl sebacate (DOS), and secondary organic aerosols are weak photoemitters in the UV spectrum. Conversely, the presence of adsorbates such as water on photoemitting particles are found to reduce or eliminate photoemission (Zhiqiang et al. Citation2000; Bukowiecki et al. Citation2002).
The photoelectric quantum yield has also been found to vary between different morphologies of the same homogeneous material type. Three studies which discuss morphology effects on aerosol photoemission in detail seemingly contradict one another (Schmidt-Ott Citation1988; Keller et al. Citation2001; Zhou et al. Citation2013). Zhou et al. (Citation2013) found the overall charging efficiency of silver aggregates to be 0.4–0.8 times that of silver spheres of the same mobility diameter. This result disagrees with an existing photocharging theory which suggests that particles of the same material type and mobility should have the same photoelectric charging efficiency regardless of their morphology (Keller et al. Citation2001). Further, Schmidt-Ott (Citation1988) demonstrated that sintering reduced the photoelectric charging efficiency of silver agglomerates, though the effects of changes in particle mobility and morphology were treated together as a function of sintering temperature. The author explained that the reduced photoelectric efficiency of the sintered particles was due to the reduced number of primary particles exposed to the surrounding gas molecules. Schmidt-Ott (Citation1988) proposed photoelectric charging as an in situ measure of particle shape factors. The analysis suggests the charging efficiency of agglomerates should be higher than that of spheres with the same mobility diameter, but such results have not been directly compared.
Since direct UV photoelectric charging yield depends on material type and the charging rate depends on the photoelectrically active particle surface area, photoelectric charging could be valuable for source-apportionment studies and/or studies of exposure to specific, harmful aerosols within heterogeneous aerosol mixtures. Any practical measurement device or diagnostic technique must be accompanied by sufficient understanding and interpretation of measurements using validated particle photoemission theory.
In this work, a fixed-wavelength UV light source and detection system are used to measure photoemission from silver agglomerates and sintered spheres to determine the effects of particle size and morphology on photo-emission yield. Unconditioned soot particles from a propane flame are measured to demonstrate the effect on photoemission of different particle material types when compared with silver agglomerates. The photoelectrically active area is evaluated to determine the effect of particle morphology on total photoelectric yield.
2. Theory
There are three steps involved in photoemission from surfaces in a vacuum (Spicer Citation1967) and a fourth step is included for particles in a carrier gas (Burtscher Citation1992):
absorption of a photon and excitation of an electron;
movement of the electron to the surface;
overcoming of the surface potential; and
removal of the electron from the vicinity of the particle.
After photoemission, the remaining particle develops a positively charged electrostatic field which reduces the probability of further release of electrons. Step 1 requires that the photoemitting material be exposed to the photon flux, and step 4 requires that photoemitting material be located externally-to the particle rather than shielded inside the same. Electrons emitted from the particle interior may be reabsorbed by material within the same particle and never escape the particle exterior (Weber et al. Citation1999).
The rate of photoemission for a particle, , leading to particle charging from charge level q to q + 1, can be written as (Cardona and Ley Citation1978; Maisels, Jordan, and Fissan Citation2002)
(1)
(1)
where
(2)
(2)
in which I is the radiative energy flux,
is the photoelectrically active area,
is the specific photon energy, ν is the wavelength of light and h is Planck’s constant (
). The non-dimensional quantum yield (Yq) is a function of the charge state (q) and the proportionality constant (Kc). The latter is material dependent and empirically determined. Previous studies have determined an empirical exponent value (m) of approximately two for both metals and a few nonmetals (Schmidt-Ott and Federer Citation1981; Müller, Schmidt-Ott, and Burtscher Citation1988b; Jiang et al. Citation2007a). The factor of 4 in the denominator of EquationEquation (1)
(1)
(1) represents the difference between the total surface area and cross-sectional area of a sphere, and is included here for consistency.
Photoemission occurs under conditions in which the specific photon energy is higher than the work function (), which increases with each emitted charge due to the resulting stronger electrostatic field until a maximum photoelectric charge state is reached. The charge-dependent work function (
) is a function of the particle electrical capacitance, or ability to hold charge, which is in turn a function of particle size and morphology (Cao et al. Citation2015). It has been demonstrated that the effect of the particle capacitance, along with differences in modeled or roughly estimated geometric surface area, account for a 17–30% increase in unipolar diffusion charging efficiency of agglomerates over spheres of the same material (Oh, Park, and Kim Citation2004; Shin et al. Citation2010; Wang et al. Citation2010; Cao et al. Citation2015).
The electrons released via photoemission from particles in a carrier gas collide with neutral gas molecules, forming gaseous ions. It has been previously shown that under conditions where the recombination rate of ions with charged particles is not dominant, the total photoelectric activity generated over the total irradiation time () can be measured by collecting the total current of photoemitted electrons (
), or the remaining positively charged particles (
) (Nishida, Boies, and Hochgreb Citation2017, Citation2018). For polydispersed particle size distributions over a range of conditions, the contribution of each photoemission event to the net photoelectric current may be assumed to be independent (Nishida et al. Citation2019). The photoelectric current can be determined as follows
(3a)
(3a)
(3b)
(3b)
(3c)
(3c)
where c is an operation constant which depends on the volumetric flow rate of the gas carrying the particles (Q), and the electron charge (e). The total photoelectrically active area (
) is the integral sum of the photoelectrically active area (
) for the probability density function (
) of particle diameter (
) multiplied by the total number concentration (N). For a monodisperse particle distribution,
where N is total number concentration. For the sufficiently large difference between the specific photon energy (
) and the work functions (
) considered in this work, the quantum yield, Y, of Equation (3) may be considered constant for a given material and morphology; an assumption which is valid for charge states sufficiently below the photoelectric charging limit (Maisels, Jordan, and Fissan Citation2002; Nishida, Boies, and Hochgreb Citation2017).
The photoelectrically active area of a particle () accounts for the total area of material active in the process of photoemission; the area which is exposed to the particle surroundings rather than shielded inside the particle. The sizes of particles under consideration are smaller than the wavelength of incident light such that absorption and electron excitation occurs throughout the whole particle volume (Schmidt-Ott Citation1988; Müller, Burtscher, and Schmidt-Ott Citation1988a; Burtscher Citation1992). For agglomerates, the primary particles’ size is the relevant size for absorption (Dobbins, Mulholland, and Bryner Citation1994) and is estimated to be below 30 nm in each case of the current study following the methodology developed by Eggersdorfer et al. (Citation2012). The diameters of sintered particles considered are below 60 nm, also well below the wavelength of incident light. The electrons must be excited sufficiently close to the surface of the particle to escape (Schmidt-Ott Citation1988) and there is a higher likelihood of escape for electrons excited near the particle surface.
For monodispersed spheres of homogeneous material, assuming photoemission takes place over the whole particle surface area, , which brings Equation (3) in line with the photoemission equations as presented for modeling purposes (Maisels, Jordan, and Fissan Citation2002; Jiang et al. Citation2007a; Jiang, Lee, and Biswas Citation2007b; Nishida, Boies, and Hochgreb Citation2017). For a polydispersed size distribution of spheres,
in EquationEquation (3c)
(3c)
(3c) is equal to the area (
), defined here as the second moment of the mobility-equivalent diameter (
) distribution multiplied by the total number concentration and π,
(4)
(4)
where
is the second moment average diameter of the mobility distribution.
Mobility diameter and mobility size distributions can be easily measured and are widely utilized in aerosol science (Flagan Citation1998). Mobility diameter has also been utilized by others to characterize aerosol surface area instruments. Jung and Kittelson (Citation2005) measured the size and composition-dependent responses of two unipolar charging-based instruments and one photoelectric instrument as a function of Fuchs surface area, which is directly proportional to the particle mobility diameter and measurement regime. Therefore, the mobility diameter may be used in the photoelectric charging equations by neglecting the effect of particle morphology (Nishida, Boies, and Hochgreb Citation2018). However, total photoelectric yield, as measured by electrical current in EquationEquation (3)(3a)
(3a) , is proportional to the photoelectrically active surface, which can be conflated with geometric surface area or an equivalent surface area based on mobility measurements. In the following sections, we test the hypothesis that the photoelectric current is proportional to the second moment of the mobility-equivalent diameter distribution:
for different particle morphologies and materials.
3. Experimental method
The experimental method allowed measurements of photoelectric yield for a range of known concentrations, sizes, and morphologies of monodisperse, initially neutral particles. The experimental apparatus is shown in . The aerosol source was either carbonaceous soot or silver (Ag) particles. Carbonaceous soot particles were produced, as described in section 2.1 of Stettler et al. (Citation2013), by burning propane (flow rate of 105 std cm3 min−1) with air (1.2 std L min−1) in a co-flow inverse diffusion flame using N2 (3 std L min−1) as a sheath flow, followed by ageing in an aging chamber. A vacuum pump (Edwards, Burgess Hill, UK: Model Speedivac 2) and mass flow controller (Alicat Scientific, Tucson, AZ, USA) were used to draw the sample flow through the aging chamber at a constant flow rate of 1.5 std L min−1. Silver agglomerate particles were produced by evaporation and subsequent condensation using a tube furnace operated at 1200 °C (Lenton, Hope, UK: Model LTF 12/25/500). Inside the furnace, a flow of HEPA-filtered, dry N2 at 2 std L min−1 carried evaporated silver from three evenly distributed combustion boats containing pure silver. The aerosol sample flow either bypassed or passed through a second furnace (Elite Thermal Systems Ltd., Market Harborough, UK: Model THH12/90/305) operated at 600 °C to sinter the agglomerate particles into close-packed structures (Schmidt-Ott Citation1988; Zhou et al. Citation2013).
Figure 1. Schematic of experimental apparatus.
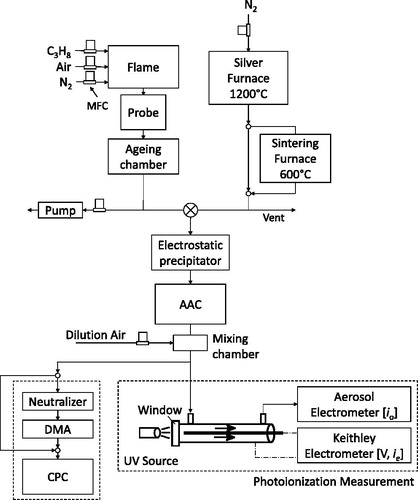
The sample was drawn through an electrostatic precipitator operated at 8 kV from either aerosol source to capture particles with any residual charge from generation, as confirmed using an aerosol electrometer (TSI Inc., Shoreview, MN, USA: Model 3068B). The neutral particles were then passed through an Aerodynamic Aerosol Classifier (AAC; Cambustion Ltd., Cambridge, UK) which classifies particles based on aerodynamic diameter. The AAC selects particles of a given aerodynamic diameter by inducing a centrifugal force using rotating concentric cylinders, while controlling the particle residence time using a sheath flow. Only particles with the selected terminal velocity or particle relaxation time follow the correct trajectory to pass through the classifier. The AAC thus produces a monodisperse aerosol independent of the particle charge state, thereby providing relatively high concentrations of monodisperse, neutral particlesFootnote1 compared with particle classification via a Differential Mobility Analyzer (DMA) and subsequent charge conditioning (Johnson et al. Citation2018b).
To control the sample flow rate through the AAC and resulting dilution ratio, HEPA filtered air was added downstream of the AAC to balance the flows. Three dilution ratios (0.3, 1.65, and 4.4) were used for both aerosol sources to provide a range of particle concentrations at each classified size, which was determined by the AAC setpoint. A mixing chamber was used to ensure the dilution air and sample flow were thoroughly mixed before entering the parallel measurement equipment.
The number-weighted particle mobility diameter distribution, allowing the particle Count Median Diameter (CMD) to be estimated, was measured with a Scanning Mobility Particle Sizer (SMPS; TSI Inc.: 3080 Electrostatic Classifier, Kr-85 Neutralizer, 3081 DMA, 3776 Condensation Particle Counter [CPC]) with two scans per AAC setpoint. Before and after the SMPS scans at each AAC setpoint, the neutralizer-DMA was bypassed and the total particle number concentration (N) was measured using the CPC.
In parallel to the SMPS, a portion of the aerosol sample was passed through a UV photoionization chamber and irradiated with UV light while simultaneously being exposed to a constant electric field between two concentric electrodes. A 3 W UV lamp (Dinies Technologies GmbH, Germany: Model Mini3W-52ozon) provided ultraviolet light through a UV-extended fused silica optical window at wavelengths of 185 and 254 nm. A DC voltage in series with an amperometer was applied to the electrodes using a Keithley electrometer (Keithley Instruments Inc., Cleveland, OH, USA: Model 6517B). A constant applied voltage of 30 V (24 V cm−1) was chosen to capture the highly mobile ions created from the photoemission process without significantly capturing the charged particles (Nishida, Boies, and Hochgreb Citation2017, Citation2018). The electrometer measured the electrode current dominated by the photoemitted electrons () with a noise level lower than ±1 fA (Keithley Instruments Inc. Citation2009). However, significant electrical noise from other sources increased the signal uncertainty and the results from the electrode current (
) were not included in this work. A flow rate of 1.5 std L min−1 through the photoionization chamber was provided by the aerosol electrometer which measured the electrical current due to particle filtration in a Faraday cup electrometer (
) with a noise level lower than 1 fA at one second averaging time (TSI Inc. Citation2006a). Further specifications of the photoionization chamber and photoelectric current measurement may be found in Nishida, Boies, and Hochgreb (Citation2018).
Throughout the experimental set-up, stainless steel and conductive silicon tubing were used to minimize particle electrostatic losses in the sampling lines. System flow rates were verified using a bubble flow meter (Gilibrator 2, Sensidyne, LP, Clearwater, FL, USA).
3.1. Measurement uncertainty
Uncertainty in aerodynamic diameter for an AAC set-point was considered to be 4.7% based on the maximum average disagreement for spherical particles (Johnson et al. Citation2018a). Uncertainty of the count median (mobility) diameter (CMD) from the SMPS was considered to be 3% (Kinney et al. Citation1991). Concentrations were measured using the CPC with an uncertainty of 10% (TSI Inc. Citation2006b). For data points where the direct CPC measurement was in photometric mode, the number concentration from the SMPS was used with an uncertainty of 10%, consistent with published values (Wiedensohler et al. Citation2012). Vertical error bars were not included in the figures as the standard error in current measurements were less than 1.5% for all but two data points using 30 s averages of measurements collected at 1 Hz.
3.2. Particle characterization
The particle aerodynamic diameter () classified by the AAC in tandem with the mobility diameter (
) classified by the downstream DMA provided the ability to determine several particle geometrical parameters by assuming the bulk density of the particle material, and that the mobility and aerodynamic measurements were collected in approximately the same gas conditions. Average volume equivalent diameter,
(Tavakoli, Symonds, and Olfert Citation2014), effective density,
, and particle mass,
(McMurry et al. Citation2002) were estimated. The bulk density of silver of
kg m−3 was used for the calculation of
for silver agglomerates. The relationship between particle mobility and effective density was measured and described using the mass-mobility exponent,
, and pre-factor,
(DeCarlo et al. Citation2004).
While the AAC generates an aerosol source that is monodispersed in aerodynamic diameter (Tavakoli, Symonds, and Olfert Citation2014), the range of equivalent mobility diameters of the classified particles depends on their effective density (DeCarlo et al. Citation2004). Spherical particles with a constant effective density that are monodispersed in aerodynamic diameter are also monodispersed in mobility. However, particles are often agglomerates, which results in their effective density decreasing with increasing particle mobility diameter (Olfert and Rogak Citation2019). For example, a small particle with low drag and mass, and a large particle with high drag and mass will have the same aerodynamic diameter, but different mobility diameters. Since the AAC classified particles have broader distributions of mobility diameters due to their morphology (i.e., changing effective density with size), the mobility distributions were quantified by the downstream SMPS measurements. The geometric standard deviation (GSD) of the mobility size distribution of the AAC classified particles varied from 1.20 to 1.30 for the sintered silver, 1.28 to 1.35 for the silver agglomerates, and 1.18 to 1.35 and 1.53 to 1.59 for the unconditioned soot at small (<140 nm) and large (>140 nm) mobility CMDs, respectively. These GSDs are broader than their aerodynamic GSD (<1.1) (Johnson et al. Citation2018b), and agree with the physical understanding that as particles become less spherical and larger, the range of mobility diameters at the same aerodynamic diameter becomes wider.
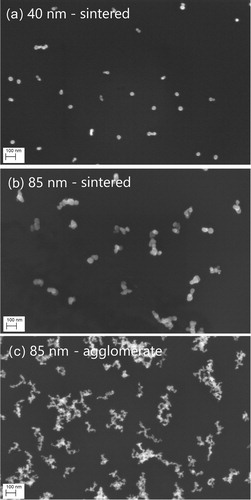
To verify the effects of sintering on particle morphology, samples of raw and sintered silver particles were mobility size selected with a DMA and deposited on a silicon substrate using an electrostatic precipitator. Scanning electron microscope (SEM: LEO GEMINI 1530VP FEG-SEM) images were captured under a 10 kV acceleration voltage and are shown in . shows that the sintered silver particles captured at nm are largely sintered into spheres. shows sintered silver particles with mobility diameter
nm approximate close-packed spheres and have a significantly different morphology from the raw agglomerate silver particles at the same mobility size shown in . The mass-mobility exponent (
) and prefactor (
) were calculated from the tandem AAC-DMA measurements (Tavakoli and Olfert Citation2014) for silver agglomerates (
) and close-packed spheres (
), respectively, further demonstrating that the particles changed morphology due to sintering (DeCarlo et al. Citation2004).
Figure 2. SEM images of mobility selected silver nanoparticles: (a) sintered spheres, nm, (b) sintered, close-packed spheres,
nm, (c) raw agglomerates, and
nm.
4. Results
4.1. Photoelectric yield as a function of particle size, concentration, and material
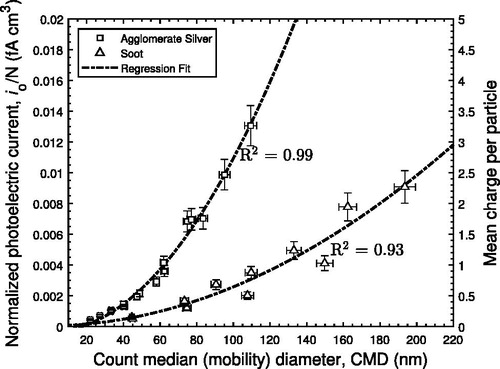
The electrical currents resulting from photoemission from aerodynamically monodisperse, silver and soot agglomerates were measured across a range of particle mobility CMDs (Ag, 20-110 nm, Soot, 40–200 nm), and total number concentrations (Ag, –
cm−3, soot,
–
cm−3). The high coefficient of determination demonstrates that number concentration and particle mobility are suitable measurements for comparison. Using a similar evaluation methodology, other available particle parameters such as aerodynamic diameter and mass were not suitable. The near linearity with number concentration demonstrates that photoelectric measurements may be investigated on a per particle basis. Electrical currents resulting from photoemission (
) are shown on a per particle basis as a function of mobility CMD measured by the SMPS in parallel in . The current normalized by number concentration (
) corresponds to a mean charge per particle when divided by volumetric flow rate (Q) and electron charge (e), i.e., charge per particle
. A linear regression fit yields
for silver agglomerates and
for soot particles, with coefficients of determination of 0.99 and 0.93, respectively, where
is taken to be particle mobility CMD. Both fit exponents are approximately 2, thereby confirming that the second moment of the mobility size distribution of both spherical and nonspherical particles is a suitable measurement for comparison as described in EquationEquation (4)
(4)
(4) .
Figure 3. Photoelectric current normalized by number concentration () as a function of particle count median diameter (CMD) using a 30 V (24 V/cm) ion capture voltage. A regression fit yields
for silver and
for soot, with coefficients of determination of 0.99 and 0.93, respectively.
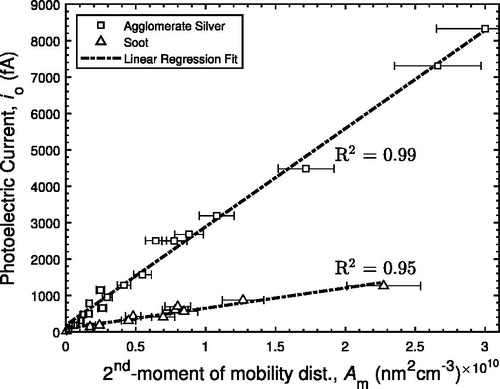
shows the photoelectric current as a function of defined in EquationEquation (4)
(4)
(4) as proportional to the second moment of the mobility diameter distribution. Agglomerate silver shows a photoelectric yield approximately five times higher than the propane flame soot when based on the same calculation of
. Carbon has a higher work function than silver (for soot,
4.95 eV, Ag, 4.25–4.75 eV; Michaelson Citation1977). Calculating the expected enhancement due the difference in work functions of soot and silver agglomerates (4.95 eV and 4.33 eV for soot [Michaelson Citation1977] and Ag [Zhou and Zachariah Citation2012], respectively), using EquationEquation (2)
(2)
(2) with a constant value for Kc, results in an expected enhanced yield of approximately 1.8 times. The fivefold enhancement in photoelectric yield of silver agglomerates over soot agglomerates is not fully explained by the difference in the work functions, and a further material or surface dependence must be considered.
Figure 4. Photoelectric current, , as a function of
(EquationEquation (4)
(4)
(4) ), defined as proportional to the second moment of a mobility diameter distribution, for agglomerate silver and unconditioned soot from a propane flame. Coefficients of determination for agglomerate silver and unconditioned soot are 0.99 and 0.95, respectively.
4.2. Effects of particle morphology on photoelectric yield
shows that the measured photoelectric current () is an approximately linear function of
as defined in EquationEquation (4)
(4)
(4) for both agglomerate and sintered silver particles. For
nm2 cm−3, linear coefficients of determination for silver agglomerates and spheres are 0.96 and 0.98, respectively. The corresponding slopes of the curves indicate that agglomerate silver has a photoelectric yield approximately 2.6 times higher than sintered silver when normalized by
. This result contradicts previous research which suggests silver agglomerates have a lower photoelectric yield than sintered silver particles of the same mobility diameter (Zhou et al. Citation2013), or that the photoelectric yield for particles of the same material and mobility diameter should be the same regardless of their morphology (Keller et al. Citation2001). However, the findings of the current study agree with Schmidt-Ott (Citation1988) which found agglomerate silver offers more material exposed to the particle surroundings compared with a close-packed structure of the same mobility size that results from particle sintering (Schmidt-Ott Citation1988). In a close-packed structure, more constituent material is shielded inside the particle such that some photoemitted electrons may be reabsorbed by material within the same particle and never escape the particle exterior (Weber et al. Citation1999). A factor of 2.6 increase in photoelectric current from agglomerates over spheres of the same material type and mobility diameter is significantly higher than the 17–30% demonstrated by unipolar diffusion charging (Oh, Park, and Kim Citation2004; Shin et al. Citation2010; Wang et al. Citation2010; Cao et al. Citation2015). With measurements of particle concentration, mobility diameter, and photoelectric yield, the active area multiplier of photoelectric yield may be calculated, thereby giving a measure of the state of sintering.
Figure 5. Photoelectric current as a function of (a) (EquationEquation (4)
(4)
(4) ), defined as proportional to the second moment of a mobility diameter distribution, and (b) photoelectrically active area (
) derived from EquationEquation (A3)
(A3)
(A3) (Schmidt-Ott Citation1988).
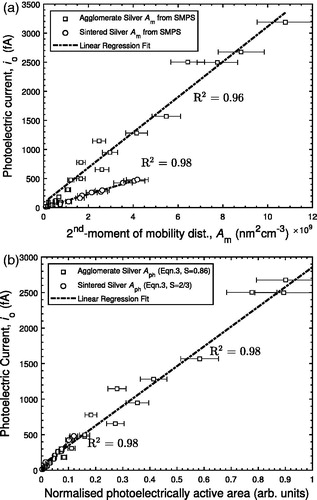
shows photoelectric current () as a function of a photoelectrically active area (
) using a shape factor (S) defined in Schmidt-Ott (Citation1988) and the Appendix (EquationEquation (A3)
(A3)
(A3) ). The shape factor, S = 2/3, was selected for the sintered silver particles based on the close-packed particle morphology identified by the SEM images (i.e.,
). For the agglomerate silver particles, it was assumed that the volume equivalent diameter (
) represents the diameter of the equivalent close-packed particle of EquationEquation (A3)
(A3)
(A3) , i.e.,
. The silver agglomerate shape factor (S) of 0.86 was determined based on regression using the coefficient of determination and is comparable to previous values of S = 0.92 and S = 0.74, for diffusion grown agglomerates determined by experiments and simulation, respectively (Schmidt-Ott Citation1988; Meakin and Witten Citation1983). This result also agrees with our physical understanding that shape factor increases as the particle radius of gyration increases as discussed in the Appendix. This fitting parameter (S) is affected by, but does not explicitly consider, the area of particles exposed to the particle surroundings. The photoelectrically active area calculated using the fitting parameter (S) requires arbitrary units which makes physical interpretation difficult.
The amount of particle material exposed to its surroundings may not fully account for the factor of 2.6 difference in photoelectric yield for silver agglomerates compared with sintered spheres for the same and material. The effect of morphology on particle electrical capacitance (Cao et al. Citation2015) has some small, but significant effect limited conservatively to 30% (Oh, Park, and Kim Citation2004; Shin et al. Citation2010; Wang et al. Citation2010; Cao et al. Citation2015). Furthermore, some oxidation or other changes in surface properties might have occurred during either the particle formation or sintering processes, which could affect the particle work function or proportionality constant (Kc) even though both processes take place in the same N2 environment. Similarly, changes in the material structure at the atomic level could have occurred during sintering which might affect Kc. Zhou and Zachariah (Citation2012) measured small changes in work function after sintering of silver particles conservatively between 4.25 and 4.35 eV, with values for agglomerates showing a slightly higher work function than spheres. This change in work function could explain up to a 10% change in photoelectric yield, though favoring spheres to have higher photoelectric yield than agglomerates. Electrons excited internally in a particle are less likely to escape than those excited near the surface (Schmidt-Ott, Schurtenberger, and Siegmann Citation1980). For that reason, electrons are more likely to escape particles of the same mass as the particle radius of gyration increases. This provides a qualitative explanation for a higher quantum yield for aerosols with smaller primary particles. The depth through which electrons must travel within a primary particle to escape is not considered explicitly in this work. Further work is required to determine the fundamental definition of photoelectrically active area, which may be related to geometric surface area or other particle properties.
5. Conclusions
Photoelectric currents were measured to determine the effects of particle size, concentration, material and morphology on photo-emission yield using a fixed-wavelength UV light source. An aerodynamic aerosol classifier was used in series with an electrostatic precipitator to select neutral, monodispersed agglomerate or sintered silver particles to determine the photoelectric yield from particles of the same material and different morphologies. Unconditioned soot particles from a propane flame are measured to demonstrate the effect of different particle material types when compared with silver agglomerates. Each of the measured photoelectric currents was shown to be linearly proportional to the second moment of the particle mobility size distribution for a range of particle sizes and concentrations of self-similar particle material type and morphologies. Photoelectric yields of agglomerate silver particles were shown to be 5× higher than soot from a propane flame. In this work, it is shown that agglomerate silver particles offer a significantly higher photoelectric yields (2.6×) than sintered, close-packed spheres of the same material and equivalent mobility size, directly contradicting two of the most recent previous studies which discuss the subject in detail.
A sintered, close-packed sphere has less active surface area of material located adjacent to the particle surrounding, compared to an agglomerate of the same particle mobility diameter. The mechanisms of photoemission include electron removal from the vicinity of the particle, which occurs for photoemitting material exposed to the particle surroundings rather than for material shielded inside each particle. Therefore, the photoelectrically active area must account for the effect of particle morphology and cannot be assumed to be the same as that of a mobility-equivalent sphere. Finally, the observed morphology dependency of aerosol photoelectric current measurements may enable measurements of the particle active surface area and therefore the state of sintering when the particle mobility size and concentration are known.
| Nomenclature Roman symbols | ||
| A | = | area concentration, nm2 cm–3 |
| c | = | operation constant |
| d | = | particle diameter, nm |
| = | mass-mobility exponent | |
| e | = | electron charge, |
| h | = | Planck’s constant, |
| = | photon energy, eV | |
| I | = | radiative energy flux, W m–2 |
| i | = | current, A |
| Kc | = | photoemission constant, J–2 |
| = | mass-mobility prefactor | |
| m | = | mass, kg; empirically determined constant |
| N | = | particle number concentration, cm–3 |
| n | = | number of primary particles |
| p(d) | = | probability density function |
| Q | = | volumetric flow rate, std L/min |
| q | = | particle charge level |
| S | = | shape factor |
| t | = | time, s |
| ν | = | photon frequency, s–1 |
| Y | = | quantum yield per incident photon |
| Greek symbols | ||
| = | combination coefficient for photoionization, s–1 | |
| = | work function, eV | |
| ρ | = | density, kg m–3 |
| = | photoelectrically active surface area, nm2 | |
| Subscripts | ||
| 2 | = | second moment average |
| ae | = | aerodynamic equivalent |
| cl | = | close packed |
| e | = | electrode; exposed |
| eff | = | effective |
| irr | = | irradiation |
| m | = | mobility |
| o | = | outlet |
| p | = | particle |
| ph | = | photoelectric |
| pp | = | primary particle |
| q | = | charge level index |
| s | = | charge saturation; surface |
| ε | = | photoelectric activity |
| ve | = | volume equivalent |
| Acronyms/Abbreviations | ||
| AAC | = | Aerodynamic Aerosol Classifier |
| CMD | = | Count Median Diameter |
| CPC | = | Condensation Particle Counter |
| DC | = | Diffusion Charging; Direct Current |
| DMA | = | Differential Mobility Analyzer |
| DOS | = | Di-Octyl Sebacate |
| HEPA | = | High Efficiency Particulate Air |
| PAH | = | Polycyclic Aromatic Hydrocarbon |
| PC | = | Photoelectric Charging |
| SMPS | = | Scanning Mobility Particle Size Spectrometer |
| UV | = | Ultraviolet |
Acknowledgments
The authors gratefully acknowledge Alphasense Ltd., Cambridge Trust, and the Natural Sciences and Engineering Research Council of Canada (NSERC) for financial support. The authors thank Cambustion Ltd. for providing the AAC and Xiao Zhang for capturing the SEM images.
Notes
1 When used in series with a electrostatic precipitator.
References
- Asbach, C., H. Kaminski, D. von Barany, T. A. J. Kuhlbusch, C. Monz, N. Dziurowitz, J. Pelzer, K. Vossen, K. Berlin, S. Dietrich, et al. 2012. Comparability of portable nanoparticle exposure monitors. Ann. Occup. Hyg. 56 (5):606–621.
- Bukowiecki, N., D. B. Kittelson, W. F. Watts, H. Burtscher, E. Weingartner, and U. Baltensperger. 2002. Real-time characterization of ultrafine and accumulation mode particles in ambient combustion aerosols. J. Aerosol. Sci. 33 (8):1139–1154. doi: 10.1016/S0021-8502(02)00063-0.
- Burtscher, H. 1992. Measurement and characteristics of combustion aerosols with special consideration of photoelectric charging and charging by flame ions. J. Aerosol. Sci. 23 (6):549–595. doi: 10.1016/0021-8502(92)90026-R.
- Burtscher, H. 2005. Physical characterization of particulate emissions from diesel engines: A review. J. Aerosol. Sci. 36 (7):896–932. doi: 10.1016/j.jaerosci.2004.12.001.
- Burtscher, H., S. Künzel, and C. Hüglin. 1998. Characterization of particles in combustion engine exhaust. J. Aerosol Sci. 29 (4):389–396. doi: 10.1016/S0021-8502(97)10001-5.
- Burtscher, H., L. Scherrer, H. C. Siegmann, A. Schmidt-Ott, and B. Federer. 1982. Probing aerosols by photoelectric charging. J. Appl. Phys. 53 (5):3787–3791. doi: 10.1063/1.331120.
- Burtscher, H., A. Schmidt-Ott, and H. C. Siegmann. 1984. Photoelectron yield of small silver and gold particles suspended in gas up to a photon energy of 10 eV. Z. Für Phys. B: Condens. Matter 56 (3):197–199. doi: 10.1007/BF01304172.
- Byeon, J. H., and J. T. Roberts. 2014. Photoionization of nanosized aerosol gold agglomerates and their deposition to form nanoscale islands on substrates. Langmuir 30 (29):8770–8775. doi: 10.1021/la501410z.
- Cao, L. N. Y., J. Wang, H. Fissan, S. E. Pratsinis, M. L. Eggersdorfer, and D. Y. Pui. 2015. The capacitance and charge of agglomerated nanoparticles during sintering. J. Aerosol Sci. 83:1–11. doi: 10.1016/j.jaerosci.2015.01.002.
- Cardona, M., and L. Ley. 1978. Photoemission in solids I. Berlin: Springer-Verlag.
- DeCarlo, P. F., J. G. Slowik, D. R. Worsnop, P. Davidovits, and J. L. Jimenez. 2004. Particle morphology and density characterization by combined mobility and aerodynamic diameter measurements. Part 1: Theory. Aerosol. Sci. Technol. 38 (12):1185–1205. doi: 10.1080/027868290903907.
- Dobbins, R. A., G. W. Mulholland, and N. P. Bryner. 1994. Comparison of a fractal smoke optics model with light extinction measurements. Atmos. Environ. 28 (5):889–897. doi: 10.1016/1352-2310(94)90247-X.
- Eggersdorfer, M. L., D. Kadau, H. J. Herrmann, and S. E. Pratsinis. 2012. Aggregate morphology evolution by sintering: Number and diameter of primary particles. J. Aerosol. Sci. 46:7–19. doi: 10.1016/j.jaerosci.2011.11.005.
- Fierz, M., C. Houle, P. Steigmeier, and H. Burtscher. 2011. Design, calibration, and field performance of a miniature diffusion size classifier. Aerosol. Sci. Technol. 45 (1):1–10. doi: 10.1080/02786826.2010.516283.
- Flagan, R. C. 1998. History of electrical aerosol measurements. Aerosol. Sci. Technol. 28 (4):301–380. doi: 10.1080/02786829808965530.
- Hogan, C. J., M.-H. Lee, and P. Biswas. 2004. Capture of viral particles in soft X-ray–enhanced corona systems: Charge distribution and transport characteristics. Aerosol. Sci. Technol. 38 (5):475–486. doi: 10.1080/02786820490462183.
- Hontañón, E., and F. E. Kruis. 2008. Single charging of nanoparticles by UV photoionization at high flow rates. Aerosol. Sci. Technol. 42 (4):310–323. doi: 10.1080/02786820802054244.
- Jiang, J., C. J. Hogan, Jr, D.-R. Chen, and P. Biswas. 2007a. Aerosol charging and capture in the nanoparticle size range (6–15 nm) by direct photoionization and diffusion mechanisms. J. Appl. Phys. 102 (3):034904. doi: 10.1063/1.2768061.
- Jiang, J., M.-H. Lee, and P. Biswas. 2007b. Model for nanoparticle charging by diffusion, direct photoionization, and thermionization mechanisms. J. Electrostat. 65 (4):209–220. doi: 10.1016/j.elstat.2006.07.017.
- Johnson, T., R. Nishida, M. Irwin, J. Symonds, S. J. Olfert, and A. Boies. 2018a. Agreement between different aerosol classifiers using spherical particles. Paper presented at Cambridge Particle Meeting, Cambridge, UK, June 15.
- Johnson, T. J., M. Irwin, J. P. Symonds, J. S. Olfert, and A. M. Boies. 2018b. Measuring aerosol size distributions with the aerodynamic aerosol classifier. Aerosol. Sci. Technol. 52 (6):655–665. doi: 10.1080/02786826.2018.1440063.
- Jung, H., and D. B. Kittelson. 2005. Characterization of aerosol surface instruments in transition regime. Aerosol Sci. Technol. 39 (9):902–911. doi: 10.1080/02786820500295701.
- Jung, T., H. Burtscher, and A. Schmidt-Ott. 1988. Multiple charging of ultrafine aerosol particles by aerosol photoemission (ape). J. Aerosol. Sci. 19 (4):485–490. doi: 10.1016/0021-8502(88)90023-7.
- Keithley Instruments Inc. 2009. Model 6517B reference manual, revision B. Cleveland: Keithley Instruments Inc.
- Keller, A., M. Fierz, K. Siegmann, H. C. Siegmann, and A. Filippov. 2001. Surface science with nanosized particles in a carrier gas. J. Vacuum Sci. Technol. A: Vacuum, Surfaces, Films 19 (1):1–8. doi: 10.1116/1.1339832.
- Kinney, P. D., D. Y. H. Pui, G. W. Mulholland, and N. P. Bryner. 1991. Use of the electrostatic classification method to size 0.1 μm srm particles—a feasibility study. J. Res. Nat. Inst. Stand. Technol. 96 (2):147. doi: 10.6028/jres.096.006.
- Kittelson, D., W. Watts, J. Savstrom, and J. Johnson. 2005. Influence of a catalytic stripper on the response of real time aerosol instruments to diesel exhaust aerosol. J. Aerosol. Sci. 36 (9):1089–1107. doi: 10.1016/j.jaerosci.2004.11.021.
- Kulkarni, P., N. Namiki, Y. Otani, and P. Biswas. 2002. Charging of particles in unipolar coronas irradiated by in-situ soft X-rays: enhancement of capture efficiency of ultrafine particles. J. Aerosol. Sci. 33 (9):1279–1296. doi: 10.1016/S0021-8502(02)00067-8.
- Li, L., and D.-R. Chen. 2011. Aerosol charging using pen-type UV lamps. Aerosol. Air Quality Res. 11 (7):791–801. doi: 10.4209/aaqr.2011.07.0103.
- Maisels, A., F. Jordan, and H. Fissan. 2002. Dynamics of the aerosol particle photocharging process. J. Appl. Phys. 91 (5):3377–3383. doi: 10.1063/1.1446237.
- Marra, J., M. Voetz, and H.-J. Kiesling. 2010. Monitor for detecting and assessing exposure to airborne nanoparticles. J. Nanoparticle Res. 12 (1):21–37. doi: 10.1007/s11051-009-9695-x.
- Matter, D., M. Mohr, W. Fendel, A. Schmidt-Ott, and H. Burtscher. 1995. Multiple wavelength aerosol photoemission by excimer lamps. J. Aerosol. Sci. 26 (7):1101–1115. doi: 10.1016/0021-8502(95)00040-J.
- Matter, U., H. C. Siegmann, and H. Burtscher. 1999. Dynamic field measurements of submicron particles from diesel engines. Environ. Sci. Technol. 33 (11):1946–1952. doi: 10.1021/es981095w.
- McMurry, P. H., X. Wang, K. Park, and K. Ehara. 2002. The relationship between mass and mobility for atmospheric particles: A new technique for measuring particle density. Aerosol Sci. Technol. 36 (2):227–238. doi: 10.1080/027868202753504083.
- Meakin, P., and T. A. Witten, Jr. 1983. Growing interface in diffusion-limited aggregation. Phys. Rev. A 28 (5):2985. doi: 10.1103/PhysRevA.28.2985.
- Michaelson, H. B. 1977. The work function of the elements and its periodicity. J. Appl. Phys. 48 (11):4729–4733. doi: 10.1063/1.323539.
- Mohr, M., D. Matter, and H. Burtscher. 1996. Efficient multiple charging of diesel particles by photoemission. Aerosol. Sci. Technol. 24 (1):14–20. doi: 10.1080/02786829608965348.
- Müller, U., H. Burtscher, and A. Schmidt-Ott. 1988a. Photoemission from small metal spheres: A model calculation using an enhanced three-step model. Phys. Rev. B. 38 (11):7814. doi: 10.1103/PhysRevB.38.7814.
- Müller, U., A. Schmidt-Ott, and H. Burtscher. 1988b. Photoelectric quantum yield of free silver particles near threshold. Z. Für. Phys. B: Condens. Matter 73 (1):103–106. doi: 10.1007/BF01312160.
- Niessner, R. 1986. The chemical response of the photo-electric aerosol sensor (pas) to different aerosol systems. J. Aerosol. Sci. 17 (4):705–714. doi: 10.1016/0021-8502(86)90050-9.
- Nishida, R., N. Yamasaki, M. Schriefl, A. Boies, and S. Hochgreb. 2019. Modelling the effect of aerosol polydispersity on unipolar charging and measurement in low-cost sensors. J. Aerosol. Sci. 130:10. doi: 10.1016/j.jaerosci.2019.01.003.
- Nishida, R. T., A. M. Boies, and S. Hochgreb. 2017. Modelling of direct ultraviolet photoionization and charge recombination of aerosol nanoparticles in continuous flow. J. Appl. Phys. 121 (2):023104. doi: 10.1063/1.4972335.
- Nishida, R. T., A. M. Boies, and S. Hochgreb. 2018. Measuring ultrafine aerosols by direct photoionization and charge capture in continuous flow. Aerosol. Sci. Technol. 52 (5):546–556. doi: 10.1080/02786826.2018.1430350.
- Oh, H., H. Park, and S. Kim. 2004. Effects of particle shape on the unipolar diffusion charging of nonspherical particles. Aerosol. Sci. Technol. 38 (11):1045–1053. doi: 10.1080/027868290883324.
- Olfert, J., and S. Rogak. 2019. Universal relations between soot effective density and primary particle size for common combustion sources. Aerosol. Sci. Technol. 53 (5):485–492. doi: 10.1080/02786826.2019.1577949.
- Ott, W. R., and H. C. Siegmann. 2006. Using multiple continuous fine particle monitors to characterize tobacco, incense, candle, cooking, wood burning, and vehicular sources in indoor, outdoor, and in-transit settings. Atmos. Environ. 40 (5):821–843. doi: 10.1016/j.atmosenv.2005.08.020.
- Röhrbein, J., and A. P. Weber. 2018. A system for on-line characterization of gas-borne particle surface properties based on their photoemission. J. Aerosol. Sci. 120:82. doi: 10.1016/j.jaerosci.2018.03.002.
- Schmidt-Ott, A. 1988. New approaches to in situ characterization of ultrafine agglomerates. J. Aerosol. Sci. 19 (5):553–563. doi: 10.1016/0021-8502(88)90207-8.
- Schmidt-Ott, A., U. Baltensperger, H. W. Gäggeler, and D. T. Jost. 1990. Scaling behaviour of physical parameters describing agglomerates. J. Aerosol. Sci. 21 (6):711–717. doi: 10.1016/0021-8502(90)90037-X.
- Schmidt-Ott, A., and B. Federer. 1981. Photoelectron emission from small particles suspended in a gas. Surf. Sci. 106 (1–3):538–543. doi: 10.1016/0039-6028(81)90248-X.
- Schmidt-Ott, A., P. Schurtenberger, and H. C. Siegmann. 1980. Enormous yield of photoelectrons from small particles. Phys. Rev. Lett. 45 (15):1284. doi: 10.1103/PhysRevLett.45.1284.
- Shin, W. G., J. Wang, M. Mertler, B. Sachweh, H. Fissan, and D. Y. H. Pui. 2010. The effect of particle morphology on unipolar diffusion charging of nanoparticle agglomerates in the transition regime. J. Aerosol. Sci. 41 (11):975–986. doi: 10.1016/j.jaerosci.2010.07.004.
- Spicer, W. E. 1967. Possible non-one-electron effects in the fundamental optical excitation spectra of certain crystalline solids and their effect on photoemission. Phys. Rev. 154 (2):385. doi: 10.1103/PhysRev.154.385.
- Stettler, M. E. J., J. J. Swanson, S. R. H. Barrett, and A. M. Boies. 2013. Updated correlation between aircraft smoke number and black carbon concentration. Aerosol. Sci. Technol. 47 (11):1205–1214. doi: 10.1080/02786826.2013.829908.
- Tavakoli, F., and J. S. Olfert. 2014. Determination of particle mass, effective density, mass–mobility exponent, and dynamic shape factor using an aerodynamic aerosol classifier and a differential mobility analyzer in tandem. J. Aerosol. Sci. 75:35–42. doi: 10.1016/j.jaerosci.2014.04.010.
- Tavakoli, F., J. P. R. Symonds, and J. S. Olfert. 2014. Generation of a monodisperse size-classified aerosol independent of particle charge. Aerosol. Sci. Technol. 48 (3):i–iv. doi: 10.1080/02786826.2013.877121.
- TSI Inc. 2006a. Model 3068B aerosol electrometer, user’s manual, revision A. Shoreview: TSI Inc.
- TSI Inc. 2006b. Model 3776 ultrafine condensation particle counter: Operation and service manual, revision B. Shoreview: TSI Inc.
- Wang, J., W. G. Shin, M. Mertler, B. Sachweh, H. Fissan, and D. Y. H. Pui. 2010. Measurement of nanoparticle agglomerates by combined measurement of electrical mobility and unipolar charging properties. Aerosol. Sci. Technol. 44 (2):97–108. doi: 10.1080/02786820903401427.
- Weber, A. P., M. Seipenbusch, and G. Kasper. 2001. Application of aerosol techniques to study the catalytic formation of methane on gasborne nickel nanoparticles. J. Phys. Chem. A 105 (39):8958–8963. doi: 10.1021/jp0115594.
- Weber, A. P., M. Seipenbusch, C. Thanner, and G. Kasper. 1999. Aerosol catalysis on nickel nanoparticles. J. Nanoparticle Res. 1 (2):253–265. doi: 10.1023/A:1010016919254.
- Wiedensohler, A., W. Birmili, A. Nowak, A. Sonntag, K. Weinhold, M. Merkel, B. Wehner, T. Tuch, S. Pfeifer, M. Fiebig, et al. 2012. Mobility particle size spectrometers: harmonization of technical standards and data structure to facilitate high quality long-term observations of atmospheric particle number size distributions. Atmos. Meas. Tech. 5 (3):657–685. doi: 10.5194/amt-5-657-2012.
- Zhiqiang, Q., K. Siegmann, A. Keller, U. Matter, L. Scherrer, and H. C. Siegmann. 2000. Nanoparticle air pollution in major cities and its origin. Atmos. Environ. 34 (3):443–451. doi: 10.1016/S1352-2310(99)00252-6.
- Zhou, L., R. You, J. Tan, and M. R. Zachariah. 2013. Wavelength-resolved UV photoelectric charging dynamics of nanoparticles: comparison of spheres and aggregates. Aerosol. Sci. Technol. 47 (6):672–680. doi: 10.1080/02786826.2013.779630.
- Zhou, L., and M. R. Zachariah. 2012. Size resolved particle work function measurement of free nanoparticles: Aggregates vs. spheres. Chem. Phys. Lett. 525:77–81. doi: 10.1016/j.cplett.2011.11.045.
Appendix: Exposed surface shape factor
Schmidt-Ott (Citation1988) introduced an in situ method for measurement of particle shape factors by comparing mobility and photoelectric activity of particles in a carrier gas before and after sintering silver agglomerates into close-packed spheres. The author defined a shape factor (S) which accounts for the proportion of primary particles exposed to the gas surrounding the agglomerate, and quantified S using measurements of photoelectric activity. The method for relating the exposed surface to photoelectric activity is presented and applied here to provide context for the analysis of photoelectrically active area.
For structures grown by diffusion-limited aggregation, the number of primary particles exposed to the surrounding gas molecules () is assumed to be proportional to the total number of primary particles (
) raised to a power (S)
(A1)
(A1)
where S is defined as a shape factor. Only primary particles exposed to the surrounding gas experience collisions with gas molecules, thus acting as a shield for the interior primary particles.
The total number of primary particles () in a close-packed sphere of diameter (
) is given by
(A2)
(A2)
where
is primary particle diameter and the ratio of
is large.
Following Schmidt-Ott (Citation1988), by combining EquationEquations (A1)(A1)
(A1) and Equation(A2)
(A2)
(A2) , and assuming that the photoelectric activity is linearly proportional to the number of exposed primary particles
, the photoelectric activity, ε (defined as the number of electrons emitted from an agglomerate particle), is proportional to the number of particles exposed to the surroundings, and therefore its equivalent close-packed sphere diameter after sintering (
) raised to a power 3S, according to:
(A3)
(A3)
The case where all of the primary particles are exposed in an idealized straight-chain morphology leads to a shape factor limit S near unity. Conversely, the highest shielding configuration of primary particles occurs for a close-packed sphere, where S approaches 2/3 for a large ratio of . A value of S = 0.92 was found for silver agglomerates generated with an evaporation/condensation process (Schmidt-Ott Citation1988).