
 ?Mathematical formulae have been encoded as MathML and are displayed in this HTML version using MathJax in order to improve their display. Uncheck the box to turn MathJax off. This feature requires Javascript. Click on a formula to zoom.
Abstract
Aerosols and dust particles as a main component of atmospheric composition are of different shapes and sizes and affect the human health. Over the recent decades, the sampling, analysis and characterization of aerosol and dust particles have been a significant challenge. Finding a relationship between the location of particle deposition on impaction plate and its size and shape is very important for mineralogical and geochemical analysis. Hence, in this investigation, a common multi-nozzle impactor was taken and the arrangement of collected particles with different shapes and diameters on impaction plate was analyzed. Because of the highly priced geochemical and mineralogical analysis of atmospheric particles collected by the impactor, the results of this study can be used as a preliminary classifier for analyzing the accumulated atmospheric particles. In this study, a multi-nozzle impactor was three-dimensionally simulated. The simulation was carried out by applying Eulerian-Lagrangian approach. The experimental tests were also accomplished for sampling of the atmospheric particles. As the results of this study, the collection efficiency curve for the atmospheric particles with different shape factors was numerically obtained. As the most important result of this study, the location of particles deposited with diameters 2.5 µm and 5 µm and with shape factor of 1, 0.5 and 0.3 on impaction plate was numerically calculated. Due to these results, on one hand the central/outer parts of primary deposits mostly contain relatively coarse/fine-sized particles with high sphericity. On the other hand, the linear/low-cumulative deposits between adjacent jets mostly contain relatively fine/coarse-sized particles with low sphericity and angular shapes. Three-dimensional simulation results matched well with experimental sampling data.
Copyright © 2019 American Association for Aerosol Research
EDITOR:
1. Introduction
Impactors, which have been routinely used over a hundred years to separate atmospheric particles according to their size, are considered as the perfect devices for investigating the behavior of particles in aerosol science. Inertial impactors, which include one or more nozzles with properties such as simple function and transportability, are the most commonly used types.
As the name suggests, the function of inertial impactors is based on inertia. An inertial impactor includes one or more nozzles, through which the air flow with particle matter is accelerated and impinges on impaction plate (). With an abrupt change in the aerosol flow direction, particles with diameter greater than a critical diameter, due to having enough inertia are unable to follow the streamlines and are collected on impaction plate, but smaller particles with less inertia follow the air flow and exit the impactor.
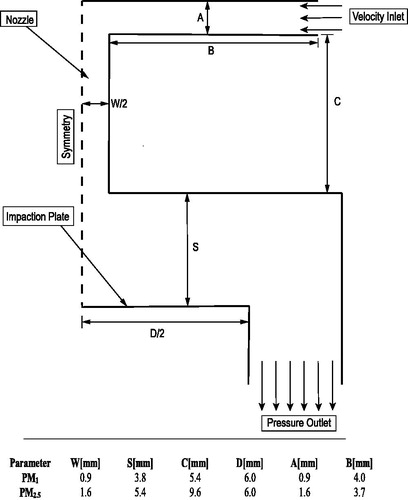
Figure 1. Schematic and dimensions of simulated single-nozzle impactor.
Many experimental and numerical investigations have been performed to study the effective parameters on collection efficiency or performance of single and multi-nozzle inertial impactors. Marple (Citation1970) performed a basic study about inertial impactor numerically and analytically so that most of the issues related to the topic of inertial impactors originate from him. These studies presented several criteria for the design of inertial impactors leading to a better and sharper collection efficiency diagram. Huang and Tsai (Citation2001) in a numerical and experimental study, investigated the effect of gravitational force on collection efficiency of inertial impactors and as the result of this investigation, it was concluded that when the Reynolds is smaller than 1500 the gravitational force increases collection efficiency. In an experimental study on multi-nozzle inertial impactors, Kwon, Kim, and Lee (Citation2002) tested five nozzle arrangement models and investigated the effect of each model on collection efficiency. Lee and Kim (Citation2002) by cooling and heating impaction plate studied the effect of its temperature on collection efficiency and found that cooling impaction plate increases adhesion of particles and accordingly impactor efficiency. Huang and Tsai (Citation2002) investigated the influence of impaction plate diameter and particle density on collection efficiency. In a study conducted by Vinchurkar, Longest and Peart (Citation2009) on Anderson cascade impactors, by presenting a valid numerical model for simulation of these impactors, as a result of this investigation the effect of particle charge on its absorption on impaction plate was investigated. Kim and Yook (Citation2011) with the aim of enhancing impactor efficiency replaced an elliptical concave impaction plate instead of a flat plate. This replacement resulted in an increase in collection efficiency. A numerical and experimental investigation was performed on multi-nozzle impactor by Rocklage, Marple, and Olson (Citation2013). In this study, by taking into account variable values for distance between two nozzles, the shape of particles deposition was analyzed, three types of particle deposition were defined and the impact of each deposition type on impactor collection efficiency was studied. Kim et al. (Citation2014) in an experimental and numerical investigation on round-nozzle impactors, concluded that by replacing a horizontal inlet instead of a vertical inlet, collection efficiency of impactor increases by about 30%. Mahmoudi, Tavakoli, and Salehi (2016) performed a numerical study and investigated the effect of different aspect ratios of the elliptical impaction plate.
The subject of impactors has a particular importance in the field of aerosol analysis. Several studies have been conducted by many researchers who tried to improve efficiency of impactor by changing the geometry or the flow field parameters. But investigations on non-spherical particles and their collection by inertial impactors are vague yet. This present study aims to understand the arrangement of particle deposition on impaction plate of multi-nozzle impactors. The morphology, shape and size of the particles collected on the impaction plate studied from inner to the outer distance of the nozzles is also investigated.
2. Material and methods
2.1. Numerical simulation of single and multi-nozzle impactor
In order to validate the simulation method, a single round nozzle impactor with horizontal inlet, employed by Kim et al. (Citation2014), was studied. A cross section view of simulated single-nozzle inertial impactor and its dimensions are shown in . In this study, the ANSYS FLUENT software version 17.2, as a commercial computational fluid dynamics code, was used to simulate the single-nozzle inertial impactor. In cases related to the validation, the flow field was considered two-dimensional, axisymmetric, steady. The Reynolds number of PM1 and PM2.5 are both smaller than 3000, so the flow field was considered to be laminar (Huang and Tsai Citation2002). The operating pressure and operating temperature were 1 atm and 20 respectively. Gravity force was also considered due to the smaller Reynolds than 1500 (Huang and Tsai Citation2002). The flow rate inside both cases was 1.1 L/min. The following boundary conditions were applied: The Velocity Inlet at the inlet of impactor, the Pressure Outlet at the outlet of impactor, the Axis at the center of the impactor and the No-Slip condition at walls. A grid independency test of results was investigated and an optimum number of meshes were determined as 10,106 for PM1 and 10,176 for PM2.5 impactors.
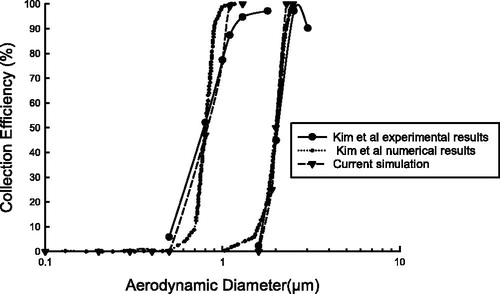
The Discrete Phase Model (DPM) based on Euler-Lagrange approach, incorporated in FLUENT software, was used to simulate the particle trajectories. From the comparison of the results of collection efficiency of the current work and the study of Kim et al. (Citation2014), it is evident that they are fully compatible with each other, especially at cutoff points (). It should be noted that the present simulation has more accurate results than the previous numerical simulation; while the current work has fewer mesh numbers.
Figure 2. Validation of current simulation results with numerical and experimental results of (Kim et al. Citation2014) for PM1 and PM2.5 impactors.
By employing the above-mentioned method, a three dimensional study on a multi-nozzle impactor was performed to investigate the flow field and particle dispersion and trajectory.
The impactor simulated in this study is a commercial eight-nozzle impactor used to carry out studies on aerosols. The impactor consists of eight nozzles of the same size, which are located uniformly on the nozzle plate. shows an intersection plane, which crosses the center of a nozzle and the center of the impactor (outlet), as well as dimensions. Important impactor geometric parameters such as the ratio of nozzle-impaction plate distance (S) to nozzle outlet diameter (W) and cross-flow parameter are 2.8 and 0.33, respectively, which are within a reasonable range (Rader and Marple Citation1985; Fang, Marple, and Rubow Citation1991; Kwon, Kim, and Lee Citation2002).
Figure 3. Schematic diagram and dimensions of (a) the simulated section of multi-nozzle impactor and (b) plus a cross section view of the simulated section.
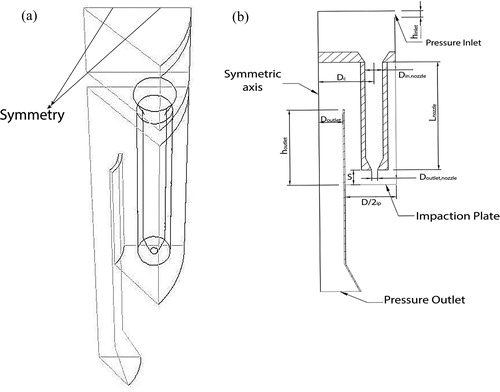
In order to reduce simulation time, due to the symmetric geometry of multi-nozzle impactor, just one-eighth of the impactor was considered. Since flow conditions at entrance were not time-dependent, the flow is considered to be steady. The SST-k-□ model was chosen to simulate the flow field. This selection was due to the existence of adverse pressure gradient boundary layer and separation from impaction plate surface. Pressure-based solver was adopted, because Mach number (Ma) was lower than 0.3 and the fluid density was constant through the whole interior space. The SIMPLE algorithm was selected for coupling of pressure and velocity, since the pressure-correction under relaxation factor was assumed to be smaller than 0.7. Pressure at the entrance (Pin) was considered equal to Patm and the amount of vacuum pressure was 101,175 Pa set at the outlet of flow to reach the intended flow rate. Aerosol flow rate (Qin) was considered as 2.3 m3/h. For solving the continuity and the momentum equations, convergence criteria were set at 10−6. Boundary conditions are supposed to be pressure-inlet at the entrance and pressure-outlet at the exhaust of aerosol flow, symmetry at symmetric planes and no-slip condition at walls, as illustrated in . In this section, the optimum mesh number was 303,674 within 9000–1,700,000 cells, which were investigated. Because of the significant importance of the flow field at the top of the impaction plate, the mesh generated for this area was finer and of a better quality to reach more accurate results; therefore, the final number of cells reached 526,748.
Similar to the previous section, particle trajectory was simulated by DPM. DPM follows the Euler-Lagrange approach. Volume fraction was 0.46 10−5%; so the particle-particle interactions were neglected. The trajectory of each particle was predicted by integrating a force-balancing equation, which is written in a Lagrangian reference frame as follows (ANSYS Fluent Theory Guide Citation2013, chapter 16):
(1)
(1)
Here, is the velocity of fluid,
is the velocity of particle,
is the density of fluid,
is the density of particle and
is an additional accelerating force, which here contains the virtual mass force, the force required to accelerate the fluid surrounding the particle and pressure gradient force. It also considered to include Gravity and Brownian motion for particles with smaller than 1 µm in diameter.
is drag force which is defined as:
(2)
(2)
where is the molecular viscosity of fluid,
is relative Reynolds defined as:
(3)
(3)
The drag coefficient for non-spherical particles was defined as (Haider and Levenspiel Citation1989):
(4)
(4)
where
The shape factor, or more precisely the sphericity, is defined as follows:
(5)
(5)
where s is the surface area of a sphere having the same volume as the particle, and S is the actual surface area of the particle. Particles of high sphericity are almost spherical-like, whereas elongated or disk-like particles have lower sphericity. In order to calculate particle mass, and drag force, the
is the diameter of a sphere with the same volume.
Since the simulated multi-nozzle impactor is a tool which has been designed for sampling aerosol particles in ambient conditions, physical properties of the injected particles are considered to be similar to the particles existing in the Urmia city atmosphere. According to studies by Ahmady-Birgani, McQueen, and Mirnejad (Citation2018) and Ahmady-Birgani et al. (Citation2015), due to high amount of silica-type particles over the collection campaign, the average density was assumed to be 2.1 g/cm3. Particles with the same size were injected with the same velocity of the air flow at inlet. The particle size distribution and particle size range were considered as uniform and 0.1 µm to 5 µm, respectively. Also the particle shape factor range varies from 0.4 to 1. Particles are considered to be reflected when they hit walls and to be trapped when they hit impaction plate.
The collection efficiency was calculated by EquationEquation (6)(6)
(6) (Kim et al. Citation2014):
(6)
(6)
where Nin is the number of injected particles and Nde is the number of particles deposited on the impaction plate. According to Brownian motion, the ith particle injected at the inlet probably will not be trapped if the (i + 1)th and (i – 1)th are trapped (Kim, Yook, and Ahn Citation2012). Therefore, simulation of particle trajectories was performed for both cases several times (single-nozzle impactor and multi-nozzle impactor); also the number of injected particles varied from 15 to 200 (for single-nozzle impactor) and 310 to 3100 (multi–nozzle impactor) in inlet, thus the average collection efficiency was applied.
2.2. Experimental approach
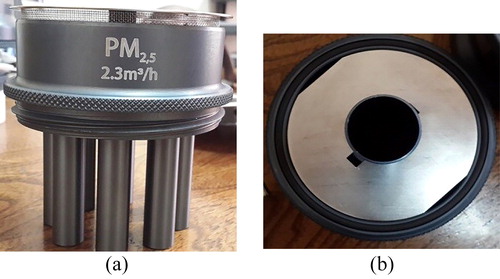
Impactor used in experimental tests to carry out research on aerosols is a commercial multi-nozzle impactor manufactured by COMDE DERENDA Company. The impactor is part of a package that has been designed for sampling particles existing in ambient air. It is mounted on the Dust Collector Instrument equipped with display and controlling unit, external temperature, ambient pressure and relative humidity sensors, filters and vacuum pump. A general and a detailed schematic of the package is presented in . The suction created by the vacuum pump streams up the flow. Aerosol flow enters from the inlet, which has a filter to prevent the entry of coarse particles, after passing through the nozzles it exits from the outlet and passes through the filter. A sample flow is transmitted to display and controller unit through an orifice existing along the path of outlet flow. Therefore, the controller unit would check parameters such as temperature, flow rate and pressure. shows the image of various sectors of impactor used in experimental studies.
Figure 4. (a) A general and (b) a detailed schematic of experimental package.
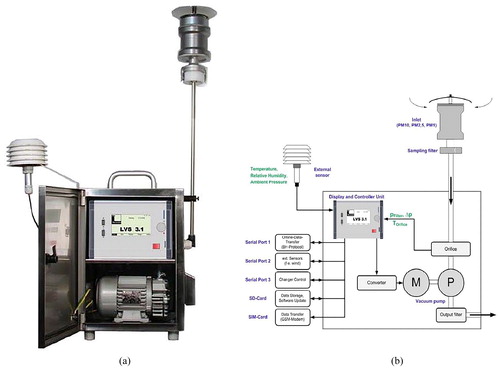
Figure 5. The image of impactor (a) inlet and nozzles and (b) impaction plate and outlet.
3. Results and discussion
3.1. Flow field results
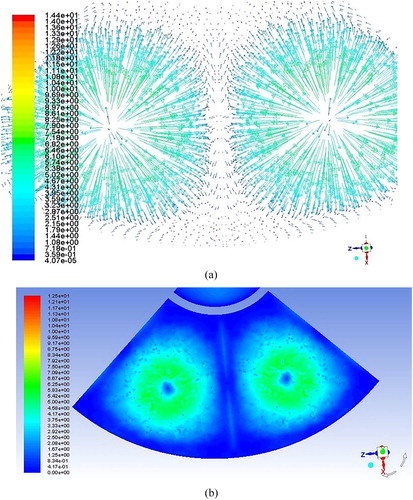
In this section, air flow field as a carrier phase of particles inside the impactor was the main focus. The streamlines and rendered volume of flow field, which are both colored by velocity magnitude are illustrated in . The numerically averaged velocity at nozzle outlet is about 10.5 m/s, which rather corresponds to the analytical velocity of 11.3 m/s. Due to both the importance of flow pattern on the impaction plate and the impact of jets ejected from two adjacent nozzles, the velocity vector and velocity magnitude contour are represented in . These figures show that the stagnation points are formed both where ejected jet hits impaction plate and adjacent jets hit each other, which are more probable areas for particle accumulation.
Figure 6. Results of (a) streamlines colored by velocity magnitude and (b) volume rendering colored by velocity magnitude.
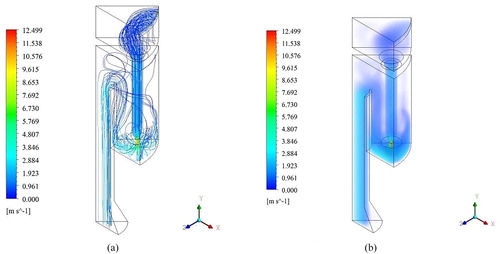
Figure 7. (a) Velocity vectors on impaction plate and (b) velocity magnitude contours on impaction plate.
3.2. Collection efficiency
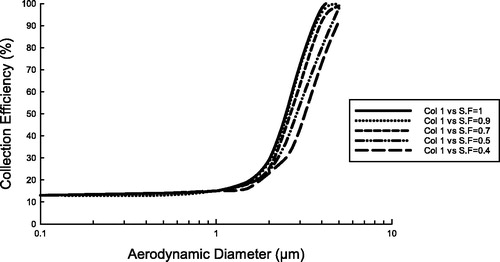
Actually, most of the atmospheric particles are not quite spherical. Therefore, for better evaluation of the impactor performance used in this study and to achieve a better view about the collection of particles with different shapes, the efficiency of impactor was calculated for particles with different shape factors ().
According to the definition of shape factor (EquationEquation (5)(5)
(5) ), particles with smaller shape factor have less spherical shapes, in the other words, they have less sphericity. It is expected that these particles are more disk-like or elongated in shape.
Comparing the collection efficiency curves of impactor for particles with different shapes (shape factors) and an aerodynamic diameter smaller than 2 µm this showed the collection efficiency was not affected by particle shape factor; while for the particles with an aerodynamic diameter larger than 2 µm, the collection efficiency decreased as the shape factor dropped. So, it is concluded that because of the increase of drag force on particles with a diameter larger than 2 µm, particles with higher sphericity are more collected than particles with low sphericity.
Figure 8. Collection efficiency curve for non-spherical particles with variable shape factors.
3.3. The location of particle deposition
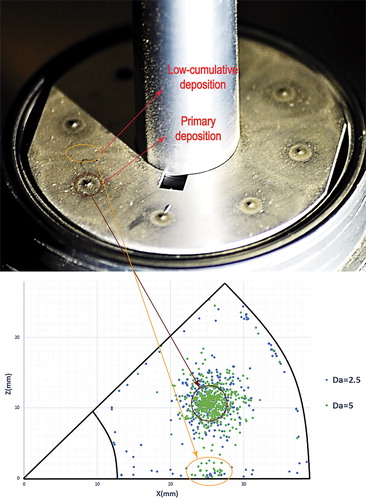
Generally, based on the results of experimental sampling, particle deposition can be divided into three categories: (i) primary or high-cumulative depositions where the particles hit the impaction plate directly, (ii) the linear depositions between two adjacent jets and (iii) low-cumulative depositions between two adjacent jets.
As shown in , the location of simulated part of impaction plate and exact location of nozzle outlet in X and Z axis are presented. It also was exhibited one-eighth of impaction plate area with given dimensions as an upper view of a cross-sectional surface perpendicular to the nozzle and impactor axis. The location of deposited particles with aerodynamic diameter of 2.5 µm and 5 µm and different shape factors (i.e., 0.3, 0.5 and 1) in the simulated domain of impaction plate are illustrated (). By corresponding with the results shown in , the depositional location of injected particles on the impaction plate is determined. By reviewing the result shown in , it can be concluded that the coarse and spherical particles were almost entirely deposited in the primary deposition zone or where the ejected jet from nozzle hits the impaction plate (. By reducing the shape factor of particles (with low-sphericity and disk-like shapes), they spread throughout the impaction plate area (). Smaller sized particles are more dispersed than the larger particles with the same shape factor.
Figure 9. The location of the nozzle center and the boundaries of the simulated area of impaction plate.
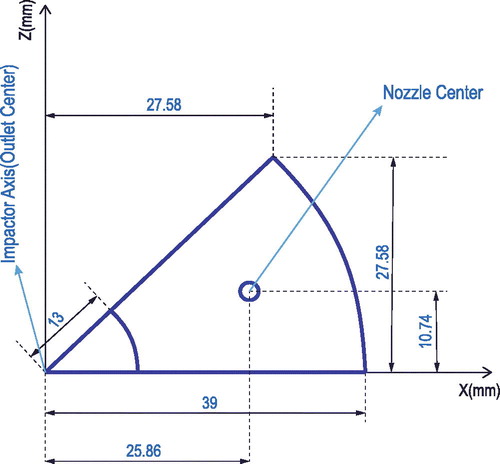
Figure 10. Position of deposited particles with different aerodynamic diameters and shape factors on impaction plate (a) Da = 2.5, S.F = 1; (b) Da = 5, S.F = 1; (c) Da = 2.5, S.F = 0.5; (d) Da = 5, S.F = 0.5; (e) Da = 2.5, S.F = 0.3; (f) Da = 5, S.F = 0.3.
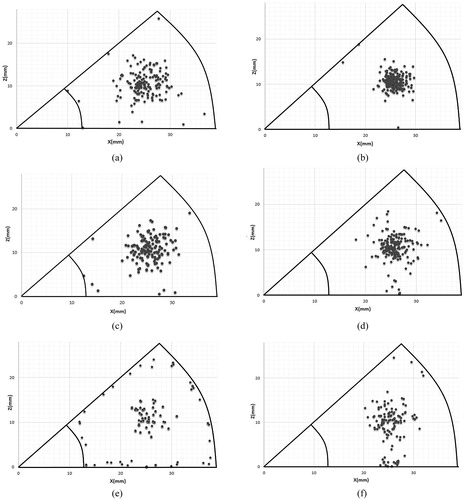
Generally, it is inferred that by reducing the shape factor and diameter of the particles, due to lower inertia, their distribution is more diffused on the impaction plate. In this study, the other remarkable point is that particles with a diameter of 5 µm diverted from the jet path are often accumulated in a particular area of the impaction plate (as shown in and ). This area is the stagnation point of the collision of two adjacent jets. The particles with 2.5 µm aerodynamic diameter are deposited linearly where two adjacent flows collide or in the areas near the walls (as shown in and ).
Figure 11. Comparison of the deposition location of particles with a diameter of 2.5 µm and 5 µm.
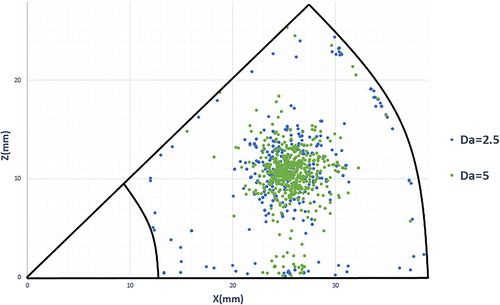
The distribution of particles with different shape factors and with an aerodynamic diameter of 2.5 µm and 5 µm is shown in .
The comparisons of numerical simulation and experimental sampling results of aerosols obtained in ambient conditions at the Faculty of Natural Resources, Urmia University are shown in . A good agreement is found among numerical and experimental results for the location of two important obvious stagnation points that are formed on the impaction plate, as shown in . These points are formed where the jet hits impaction plate and where two adjacent jets reach each other on impaction plate. The simulated locations of linear depositions between two adjacent nozzles and edges of the impaction plate are also defined and matched by the experimental sampling results in . According to and , it can be inferred that the location of particle depositions is mainly in areas with very low velocity (almost zero). The two linear areas with relatively higher velocity and surrounded between two linear particle depositions, create areas where particle deposition is lower (). Regarding the location of primary and low cumulative particle depositions (), the results of the simulations match rather well the experimental samples. As expected, the stagnation points (shown in ) are the points where the particles are mostly deposited (primary and low-cumulative depositions).
Figure 12. Correspondence of experimental sample and numerical simulation results for the location of defined stagnation points created between two adjacent jets and where the jets hit impaction plate.
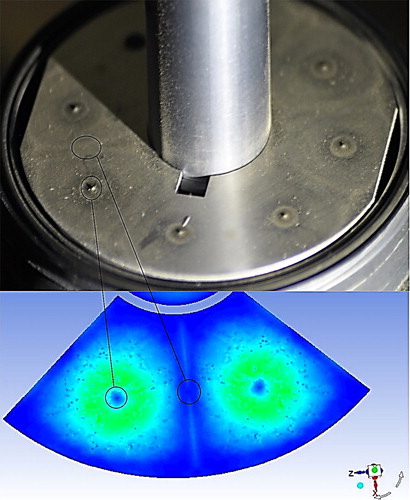
Figure 13. Comparison of the results of numerical simulations and experimental samples for the linear deposition between two adjacent jets and at the edge of impaction plate.
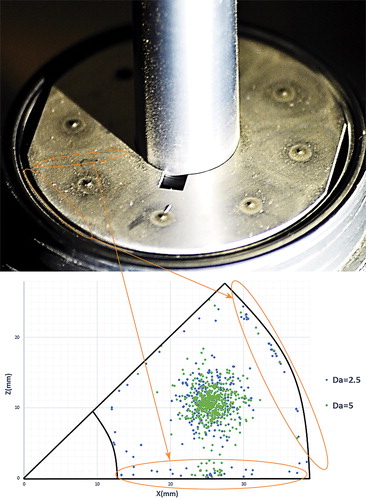
Figure 14. Correspondence between experimental sample and the velocity magnitude contour for the location of linear low-deposited areas surrounded by linear depositions.
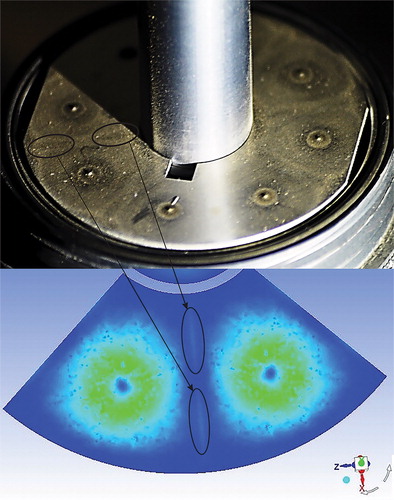
Figure 15. Comparison of numerical simulation results and the experimental samples for primary deposition and low-cumulative deposition between two jets.
Finally, according to , numerical simulations reproduce rather accurately the experimental measurements.
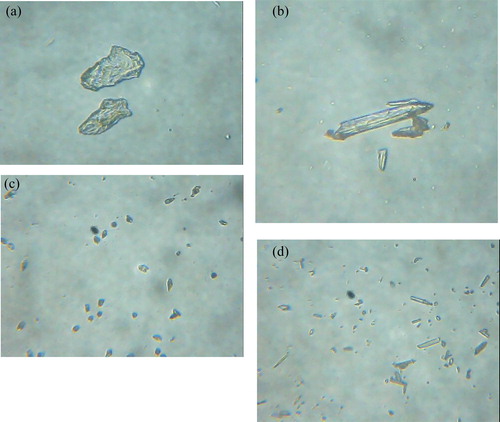
In order to validate the precision of the results obtained by numerical simulation more, the particles for each deposition areas were observed by an optical binocular microscope (). The analyses of the experimental samples collected are well in agreement with the above-mentioned numerical simulation results. The atmospheric particles with rounded and semi-angular morphology and high sphericity, probably composed of quartz and iron oxide minerals, deposit in the primary-deposition location. The semi-angular and angular particles with low-sphericity contain more clay minerals and alluminosilicates with disk-like and elongated morphology, deposited between the nozzles. It should be noted that the size of the particles deposited on the impaction plate varies from the larger below the nozzles to the smaller between the nozzles. These results are completely in consistency with the research of Ahmady-Birgani et al. (Citation2015) which dealt with the physical properties (i.e., mineralogical and particle morphology studies) and geochemical compositions of Urmia city aerosols and dust particles. According to the particles deposited in different places of the impaction plate, it can be inferred that the size and the morphology of different particles can be easily estimated by grabbing some samples in the given deposition location. For example, if the aim of a study is investigation of the quartz grains, the grain samples should be taken from the primary deposition area and if there is need to have some calcite and gypsum minerals with lower sphericity, then the samples should be taken between the nozzles. This makes the sampling of the specific minerals from the impaction plate easier, more precise and purposeful.
Figure 16. Magnified images of particles related to different areas of deposition. (a) Central area of primary deposition. (b) Low-cumulative deposition between adjacent jets. (c) Outer area of primary deposition. (d) Linear deposition between adjacent jets.
Aerosols and dust particles as a main part of atmospheric composition are of different shapes and sizes. In terms of discrimination between different particles with various sizes, the study of impactors is necessary. In this study, the performance of a multi-nozzle impactor for aerosol and atmospheric particles with different shapes was numerically and experimentally investigated. The particles’ trajectories were simulated by Euler-Lagrange approach. As previous studies haveshown, atmospheric particles with different shapes and sizes can provide useful information about their physico-chemical characteristics. The collection efficiency of particles with different shape factors indicated low efficiency for low-sphericitic particles and higher collection efficiency for high-sphericitic particles. Location of particles deposited on impaction plate showed that the particles with higher diameter and shape factor are in only high-cumulative or primary deposition locations, which are just beneath the nozzles. Also, the low-cumulative depositions between the nozzles only contain particles with relatively higher diameter and low-sphericity shapes. The linear depositions between the nozzles consist of particles with relatively lower diameter and low-sphericity shapes as well. As the results showed, the numerical simulation was compatible with the experimental achievements.
Finally, it is rather inferred that the particles escaped from the impactor and consequently deposited on a filter medium, which is used for mineralogical and geochemical analysis. This might not be a good representative of the atmospheric particles suspended in the air. It means that the sphericity and roundness of particles as well as the diameter will have strong effects on trapping/escaping of particles from the impaction plate.
References
- Ahmady-Birgani, H., K. G. McQueen, and H. Mirnejad. 2018. Characteristics of mineral dust impacting the Persian Gulf. Aeolian Res. 30:11–19. doi:10.1016/j.aeolia.2017.11.001.
- Ahmady-Birgani, H., H. Mirnejad, S. Feiznia, and K. G. McQueen. 2015. Mineralogy and geochemistry of atmospheric particulates in Western Iran. Atmos. Environ. 119:262–272. doi:10.1016/j.atmosenv.2015.08.021.
- ANSYS. 2013. ANSYS fluent theory guide (15th release). Canonsburg, PA: ANSYS Inc.
- Fang, C. P., V. A. Marple, and K. L. Rubow. 1991. Influence of cross flow on particle collection characteristics of multi-nozzle impactors. J. Aerosol Sci. 22 (4):403–415. doi:10.1016/0021-8502(91)90001-X.
- Haider, A., and O. Levenspiel. 1989. Drag coefficient and terminal velocity of spherical and nonspherical particles. Powder Technol. 58 (1):63–70. doi:10.1016/0032-5910(89)80008-7.
- Huang, C. H., and C. J. Tsai. 2001. Effect of gravity on particle collection efficiency of inertial impactors. J. Aerosol Sci. 32 (3):375–387. doi:10.1016/S0021-8502(00)00086-0.
- Huang, C. H., and C. J. Tsai. 2002. Influence of impaction plate diameter and particle density on the collection efficiency of round-nozzle inertial impactors. Aerosol Sci. Technol. 36 (6):714–720. doi:10.1080/02786820290038410.
- Kim, M. K., W. G. Kim, K. S. Lee, and S. J. Yook. 2014. Collection efficiency of round-nozzle impactors with horizontal annular inlet. J. Aerosol Sci. 74:63–69. doi:10.1016/j.jaerosci.2014.04.007.
- Kim, W. G., S. J. Yook, and K. H. Ahn. 2012. Collection efficiency of rectangular slit-nozzle inertial impactors with impaction plates of elliptical concave curvature. Aerosol Sci. Technol. 47 (1):99–105. doi:10.1080/02786826.2012.730162.
- Kim, Y. J., and S. J. Yook. 2011. Enhancement of collection efficiency of inertial impactors using elliptical concave impaction plats. J. Aerosol Sci. 42 (12):898–908. doi:10.1016/j.jaerosci.2011.08.006.
- Kwon, S. B., M. C. Kim, and K. W. Lee. 2002. Effects of jet configuration on the performance of multi-nozzle impactors. J. Aerosol Sci. 33 (6):859–869. doi:10.1016/S0021-8502(02)00040-X.
- Lee, B. U., and S. S. Kim. 2002. The effect of varying impaction plate temperature on impactor performance: Experimental studies. J. Aerosol Sci. 33:451–457. doi:10.1016/S0021-8502(01)00191-4.
- Mahmoudi, M., M. R. Tavakoli, and A. Salehi. 2017. Numerical study of low Reynolds inertial impactors with elliptical impaction plate. J. Aerosol Sci. 105:94–107. doi:10.1016/j.jaerosci.2016.11.016.
- Marple, V. A. 1970. A Fundemental Study of Inertial Impactors. PhD Thesis, University of Minnesota.
- Rader, D. J., and V. A. Marple. 1985. Effect of ultra-Stokesian drag and particle interception on impaction characteristics. Aerosol Sci. Technol. 4 (2):141–156. doi:10.1080/02786828508959044.
- Rocklage, J. M., V. A. Marple, and B. A. Olson. 2013. Study of secondary deposits in multiple round nozzle impactors. Aerosol Sci. Technol. 47 (10):1144–1151. doi:10.1080/02786826.2013.823641.
- Vinchurkar, S., P. W. Longest, and J. Peart. 2009. CFD simulations of Anderson Cascade impactors: Model development and effects of aerosol charge. J. Aerosol Sci. 40 (9):807–822. doi:10.1016/j.jaerosci.2009.05.005.