
 ?Mathematical formulae have been encoded as MathML and are displayed in this HTML version using MathJax in order to improve their display. Uncheck the box to turn MathJax off. This feature requires Javascript. Click on a formula to zoom.
Abstract
This study introduces a method to deposit polystyrene latex (PSL) particles on a silicon wafer in a manner that allows their number to be predicted with a high degree of accuracy. A laminar flow growth tube is used to condense supersaturated water vapor on seed aerosol particles that are water-insoluble. After condensation is complete the droplets are accelerated through a nozzle to form an aerosol jet, and the number of droplets in this jet is counted optically. The droplets are then deposited on a flat surface by inertial impaction. The particle number on the surface is predicted by multiplying the droplet number by an experimentally evaluated conversion coefficient of 0.991 ± 0.011 (k = 2). Uncertainty analysis showed with a 95% confidence interval that the particle number on a flat surface is ± 2.0%. The primary application of this method is to make a particle number standard (PNS) wafer whose intended use is to evaluate the counting efficiencies of wafer surface scanners, and this study demonstrates the fabrication of such PNS wafers. A motorized XY-stage moves the surface horizontally to deposit PSL particles along desired paths over a half-inch wafer. The particle number was varied over seven levels ranging from 10 to 10,000. The particle diameter was varied at four levels: 0.814, 0.18, 0.102, and 0.046 µm. In all PNS wafers, the number of deposited particles was counted using optical microscopes. The observed particle numbers were all within the 95% confidence interval of the predicted value.
Copyright © 2019 American Association for Aerosol Research
EDITOR:
1. Introduction
Wafer surface scanners (WSSs) rapidly count particles on a polished flat round surface when the particles are sparsely populated on the surface. WSS are generally used during the manufacture of semiconductor electronic devices to detect contaminating particulates on a silicon wafer between different film-forming processes. WSS are alternatively used to count aerosolized particles by depositing them on a polished flat surface. One study utilizes a WSS as a reference for particle numbers over a range of a few micrometers and evaluates the counting efficiency of an airborne optical particle counter (OPC) at a 3 µm particle diameter (Li et al. Citation2014). The dynamic range of WSS with respect to particle diameter is from a few tens of nanometers to several micrometers.
The accuracy of particle-sizing and particle-counting of a WSS is inspected by using a standard silicon wafer with a known number of size-standard particles (Liu, Chae, and Bae Citation1993; MSP-Corp. Citation2012; SEMI Citation2010). Currently, the particle number of commercially available standard wafers for inspecting a WSS is greater than 500, and the relative standard uncertainty (RSU) of the particle number is about 20% (MSP-Corp. Citation2012). Standard wafers are used primarily to inspect the measured particle diameter rather than the particle number since the uncertainty of the latter is relatively large. Regardless, this study calls these wafers “particle number standard” (PNS). Successfully reducing the uncertainty of the particle number measured by a WSS is expected to improve the production yield of electronic devices.
Making a PNS wafer requires a method to sparsely deposit aerosol particles on its surface. The earliest method utilized convective diffusion under a laminar flow to deposit polystyrene latex (PSL) over a silicon wafer (Liu and Ahn Citation1987; Pui, Ye, and Liu Citation1990). Deposition rates agreed well with the theoretical predictions. Another method is to use a non-recirculating-type nebulizer coupled with a constantly mixed deposition chamber (Iketani Citation1990). The number of PSL particles on a wafer can be predicted using an empirically determined deposition rate. In recent years, PNS wafers have been made by electrostatic deposition of size-standard particles (SEMI Citation2009a; SEMI Citation2009b; Yook et al. Citation2008). In this method, the deposition rate is predicted from the flowrate into a deposition chamber and from the number concentration of aerosolized particles, which is measured in parallel with the deposition process. The accuracy of the particle number depends primarily on the measurement accuracy and stability of both particle concentration and flowrate.
This study introduces a new method of depositing particles along a desired path over a flat surface that significantly improves the degree of accuracy with which their number can be predicted. The primary application of the method is to fabricate a PNS wafer whose particle number ranges from a few tens to less than a few thousand and whose particle number uncertainty is only a few percent. Motorized stages move the wafer to deposit particles along a controlled path, and particles are then deposited on the surface by inertial impaction. Each particle is counted in situ prior to impaction at the exit of the impaction nozzle. In this approach, the uncertainty of the particle number on the surface has no random component associated with the Poisson sampling process, whose standard deviation is approximately given by the square root of the particle number. This approach offers a great advantage when a relatively small number of particles (e.g., less than a few thousand particles) need to be deposited with high accuracy. Prior to deposition, the particle sizes are enlarged by condensing water vapor on the aerosolized particles using a growth tube collector (GTC, Hering and Lewis Citation2009). After condensation is complete particle sizes are on the order of a few micrometers; therefore, each particle can be easily detected and counted using a light scattering technique. In our previous study, the particle number on a wafer was predicted from the number concentration measured in parallel with GTC while particles were being deposited on a wafer (Tajima et al. Citation2016). The relative expanded uncertainty of the particle number was ±9.6%. We show that the uncertainty was decreased by a factor of five (i.e., ± 2.0%) by counting particles in situ prior to impaction.
2. Experiments
2.1. Principle
shows the principle of making a PNS wafer in this study. A GTC is a water-based condensational growth tube (Model GTC 04, Aerosol Dynamics, USA, Hering and Lewis Citation2009). Previous studies show that the activation of water-condensation has relatively weak dependence on particle material over a particle diameter range greater than a few tens of nanometers (Hering et al. Citation2005). The GTC can grow particles into micrometer-sized droplets regardless of their sizes and chemical composition. Then the droplets are accelerated by passing them through a nozzle at the GTC outlet. The silicon wafer is placed perpendicularly to the central axis of the nozzle. The trajectories of the droplets are separated from their streamlines due to their inertial motion, and water droplets deform when they collide with a flat surface; therefore, they do not bounce off the surface. The dimensionless number which explains the mechanism of inertial impaction is the Stokes number
(1)
(1)
where
(−) and
(m) are the Stokes number and the diameter of condensation-grown droplets, respectively,
(kg/m3) is the mass density of the droplet and is approximated by the density of water.
is the average flow velocity at a GTC outlet nozzle (m/s),
is the diameter of the outlet nozzle (m),
is the Cunningham slip correction factor (−) , and
is the dynamic viscosity of the gas (Pa-s). In order to inertially impact the droplet accelerated by the nozzle onto a flat surface,
needs to be larger than a certain constant value, defined as
and
= 0.47 is often used in the design of a round-nozzle impactor (Marple and Olson Citation2011; Marple and Willeke Citation1976; Rader and Marple Citation1985). The diameter corresponding to
is defined as
Figure 1. Illustration of (a) GTC, (b) droplet detection and deposition system, and (c) the trajectories of streamlines and condensation-grown droplets.
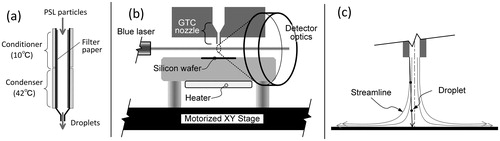
In this study, the flow rate of the GTC, was set to 0.38 L/min (6.3 cm3/s). The diameter of the GTC outlet nozzle, W, was 0.76 mm. The flow velocity,
under this condition is 14.0 m/s. Under standard pressure and temperature (i.e., 101.3 kPa and 20 °C) the value of
is 1.4 µm; therefore, the diameter of the grown droplet must be larger than this value to be captured by a flat surface.
2.2. PNS wafer fabrication system
shows a schematic diagram of the PSL particle generation and deposition system.
Figure 2. Schematic diagram of the particle deposition system.
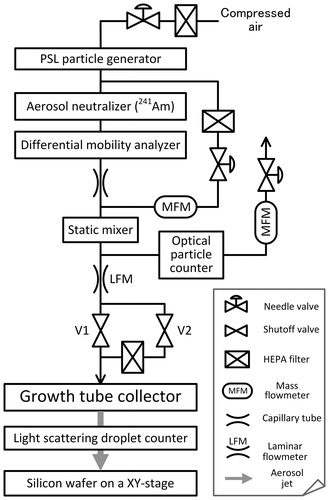
2.2.1. Particle generation
In this study, a non-recirculating-type nebulizer (Aeromaster V, JSR, Japan) was used to aerosolize size-standard PSL spheres (hereafter, PSL particles). The nebulizer uses a venturi nozzle to aspirate and atomize the liquid suspension of PSL particles. The liquid impacted onto an orifice plate is collected into another bottle and not recycled, which helps to keep the number concentration of aerosolized PSL particles at a nearly constant level over 3 h (Kousaka et al. Citation1989). In order to suppress the generation of multimeric PSL particles the concentration of the PSL particles in liquid suspension was adjusted to be less than 108 particles/mL. The aerosol neutralizer (Model 0412M4-101, Sokken, Japan) can hold an alpha particle source (Model 162CE, JRIA, Japan) whose radioisotope and activity are 241Am and 3 MBq, respectively. The aerosol exiting from the neutralizer contains evaporation residues and multimeric PSL particles other than PSL monomers. Since the GTC cannot selectively activate the growth of PSL monomers, the residue particles and multimeric PSL particles need to be removed from the aerosol prior to activation; otherwise, the number of deposited PSL particles cannot be accurately predicted. Accordingly, it is crucial to use a differential mobility analyzer (DMA, TSI Model 3081, USA) to classify PSL monomers by their mobilities. The flow rates of the DMA were set at 0.3 L/min and 2.5 L/min for aerosol flow and recirculating sheath flow, respectively. The GTC uses ultrapure water as its working fluid; in this study its flow rate was set at 0.38 L/min. To enlarge the droplet diameter to sizes larger than of the impaction nozzle (= 1.41 µm), the conditioner and condenser temperatures of the GTC were controlled to 10 °C and 42 °C, respectively.
2.2.2. Light scattering droplet counter
A light scattering droplet counter (hereafter LS-DC, Model K01M-049, YGK, Japan) counts condensation-grown droplets at the exit of the GTC. The LS-DC is composed of a light source, detector, and control unit. Particles can be detected by letting an aerosol jet pass through its sensing volume. A laser diode with a wavelength of 405 nm is used as the light source, and its beam width in the sensing volume is adjusted to about 4.3 mm. Scattered light from the individual particle enters the detector, with the amount of scattered light being converted into a pulse voltage signal by the control unit. The voltage pulse is sent to a high-speed digitizer (PXIe5112, National Instruments, USA). A home-made LabView®-based pulse height analyzing program measures the amplitude of each light scattering signal and makes a histogram. The Intensity of the light scattering signal was calibrated as a function of the diameter of the PSL particles. In this calibration, PSL particles with three different sizes were used: 0.814 µm (SC-081-S, JSR, Japan), 2.005 µm (SC-200-S, JSR Japan), and 3.210 µm (SS-033-P, JSR, Japan). Droplet counts were obtained by integrating the measured droplet size distribution from to larger sizes.
2.2.3. Deposition of particles on a wafer surface
illustrates the setup for collecting the aerosolized PSL particles on a silicon wafer. A silicon wafer is fixed on an anodized aluminum block. The diameter of the wafer used in this study was 12.5 mm (Sumizawa and Kuroiwa Citation2013; Umeyama et al. Citation2017).Footnote1 The block is fixed on a motorized XY-stage capable of moving the silicon wafer in horizontal directions. The stage is used to locate the tip of the GTC outlet nozzle (hereafter GTC nozzle) at a certain spot on the wafer surface. The distance from the nozzle tip to the upper surface of the wafer was manually adjusted to 5 mm. As mentioned in Section 1, a WSS cannot distinguish between monomers and multimers; therefore, a PNS wafer should be free of any agglomerates. The coalescence of droplets on the wafer can cause PSL particles to agglomerate after evaporation. In order to minimize coalescence, the temperature of the wafer is controlled at 100 °C by applying heat from the back to quickly remove water content from the deposited droplets.
A simple EXCEL-based spreadsheet program was used to generate a deposition path over a half-inch wafer. The program used in this study is given in the online supplementary information (SI). One program input is the total particle number that the GTC should output to make a PNS wafer, (−) , and one program output is the total length of deposition paths,
(m). The relationship between the particle output rate of the GTC and
is given by the following expression:
(2)
(2)
where
is the average speed of the motorized XY-stage. Total time spent for deposition is estimated by
In this study,
was varied within 0.5–3 mm/s, and
was adjusted between 0.5 and 10 particles/s. The value of
was measured by the LS-DC, and its value was adjusted by changing the concentration of PSL particles in a liquid suspension. While preparing to make a PNS wafer the horizontal distance between the GTC nozzle and a wafer is set at 15 mm or greater to prevent any contact between the aerosol flow from the GTC and the wafer, and the flow upstream of the GTC is switched to the filtered line (V1-closed and V2-open in ). A program to make a PNS wafer is started, after which the wafer slides horizontally into the area below the GTC nozzle. As soon as the nozzle starts following the programed paths on the wafer, the flow upstream of the GTC is directed toward the main line by opening V1, then closing V2 manually.
2.2.4. Prediction of deposited particle number on the wafer
The following equation relates the number of particles counted by the LS-DC, to the number of deposited particles on the wafer,
(3)
(3)
where the particle number conversion coefficient (PNCC),
is a coefficient for converting
to
The PNCC is the ratio of the deposition efficiency of condensation-grown droplets on a silicon wafer,
to the counting efficiency of the LS-DC,
Footnote2
(4)
(4)
It is assumed that the PNCC is independent of the particle diameter of the seed particles, since previous studies have shown that the size distributions of droplets are independent of
when
is greater than 10 nm (Hering and Lewis Citation2009). The PNCC needs to be evaluated by a separate set of experiments. In these experiments, PSL particles were deposited to one spot on a wafer, and the number of deposited particles was directly counted using a scanning electron microscope (SEM). The SEM observation gives the total number of deposited particles,
The PNCC by SEM observation,
is defined as the ratio of
to
:
(5)
(5)
The measurement of is performed multiple times, and the average value after
number of measurements is used as the approximation of the PNCC.
(6a)
(6a)
(6b)
(6b)
A PNS wafer is fabricated by depositing PSL particles along a programed path over a PNS wafer. The value of on a newly fabricated PNS wafer is predicted by
(7)
(7)
2.3. Evaluation of PNS wafer fabrication system
summarizes the evaluation procedure in this study. Evaluations were carried out in two steps: (i) the evaluation of the PNCC by EquationEquation (5)(5)
(5) and (ii) the fabrication of the PNS wafer and comparison of actual particle number on a PNS wafer with the values predicted by EquationEquation (7)
(7)
(7) . In step (i), a PSL product of one particular size is selected, and PSL particles are deposited at one spot on a wafer, with
set at one value. In step (ii), PSL products of various sizes are used, PSL particles are deposited along a programed path over a wafer, and
is also varied.
Table 1. Experimental procedure for a PNS wafer.
2.3.1. Evaluation of a particle number conversion factor, PNCC
PSL particles with a particle diameter of 0.814 µm were deposited on a half-inch wafer. To improve precision, deposition was continued until the value of exceeded 1000. An SEM (JSM-6060, JEOL, Japan) was used to measure
When
was evaluated PSL particles were deposited at one spot on a wafer to minimize the surface area to be observed by the SEM. The magnification of the SEM was set to ×1000. Image editing software (Adobe Photoshop CS6 Extended) was used to merge the SEM images to make one composite image of the whole spot.Footnote3 Then individual PSL particles in the composite image were counted. The shape of PSL particles is close to a sphere. If the observed particle did not have a spherical shape the particle was not included in
Finally, a
was calculated from
and
(EquationEquation (5)
(5)
(5) ). Five wafer samples were made on a day, and the same experiments were carried out for five days. The average of these 25 PNCC,
is the approximation of true PNCC,
as EquationEquation (6)
(6a)
(6a) describes.
In order to validate that is the actual number of deposited particles the number of PSL particles on a wafer was also evaluated using an optical microscope. A laser scanning microscope (LSM, Model LSM 700, Carl Zeiss, Germany) was used, and images were obtained under 100× magnification. Five wafer samples were made, and images of the deposited area were taken using LSM and SEM. The number of PSL particles on each wafer was evaluated from the composite images. The number of particles obtained by using LSM,
was compared with
2.3.2. Fabrication of PNS wafers: The comparison of the predicted vs. measured
In the making of PNS wafers, a motorized XY-stage was operated to deposit PSL particles along a predetermined path over a half-inch wafer. The images of PSL particles on the wafer were taken using an optical microscope (OM, Axio Imager 2, Carl Zeiss Germany), and the actual number of particles on the wafer, was evaluated from a composite image.Footnote4
was compared with the predicted value,
(EquationEquation (7)
(7)
(7) ). A WSS (Minimal WSS, YGK, Japan) was used to detect particulate matter on the wafer.
PSL particles (0.814 µm) were deposited on the wafer inside a circle 10.5 mm in diameter. was set at seven levels ranging from 10 to 10,000 to evaluate the accuracy of
over a wide range of
To verify the improvement in the accuracy of the value was also predicted using our previous method (Tajima et al. Citation2016), which predicts
from the number concentration measured in parallel with the GTC, the flowrate of the GTC,
and deposition time,
The aerosol was passed through a laminar flow meter to measure the value of
An OPC (RION KC-22B, Japan) was used to measure the number concentration,
The symbol
is used to represent
by this method:
(8)
(8)
The value of was 0.922, and its RSU was 0.045 (Tajima et al. Citation2016).
The predicted particle counts were compared to measure values by reducing particle diameter to smaller sizes. It was difficult to observe PSL particles whose diameter was smaller than 0.2 µm using the OM. Therefore, fluorescent particles were used instead, and the deposited particles were observed under fluorescence and/or dark-field mode after connecting a fluorescence light source (Illuminator HXP 120 V, Carl Zeiss, Germany) to the OM.Footnote5 The sizes of the fluorescent PSL particles were 0.18, 0.102, and 0.046 µm (Fluoresbrite® series: Plain Microspheres 0.20 µm YG, YG Carboxylate Microspheres 0.10 and 0.05 µm, Polysciences, USA).
2.3.3. Uncertainty analysis
This section introduces the procedure to evaluate the uncertainty of experimentally evaluated PNCC and the predicted particle number on a PNS wafer. The relationship between the predicted and true values of the particle number on a PNS wafer is given by combining EquationEquations (3)(3)
(3) and Equation(7)
(7)
(7) and eliminating
(9)
(9)
The law of propagation of uncertainty (JCGM/WG1 Citation2008) is applied to this expression. The uncertainty of
is estimated by the following expression:
(10)
(10)
The first term on the right side is the standard uncertainty, of the approximated PNCC,
and the second term is the
of the true PNCC,
which actually varies among PNS wafers. The third term is the
of the true number of deposited particles on a PNS wafer whose uncertainty is zero.
and
were estimated by analysis of variance (ANOVA). As already mentioned in Section 2.3.1, a set of
was obtained to calculate
There are five values of
from a given day, and data with the same structure from five days; therefore, a five-by-five matrix of
is used as the input of ANOVA. A part of the ANOVA output is the variance due to repeatability,
and day-to-day variability,
and
were estimated by
(11a)
(11a)
(11b)
(11b)
(11c)
(11c)
where
and
are the number of repeated measurements within a day and reproduced experiments over different days, respectively.
and
are both five in this study. The first and second terms on the right side of EquationEquation (11a)
(11a)
(11a) take into account the uncertainty of average value due to repeatability and day-to-day variability, respectively. The last term is the uncertainty due to systematic error,
is the systematic error of
is a product of the activation efficiency of the GTC and the counting efficiency of LS-DC. The SI gives the derivation of
including the evaluation of
Evaluation of
assumes that
and
are the upper and lower bound of
respectively. The average value of
and its expanded uncertainty (k = 2) were 0.9994 ± 0.0011, which was confirmed to be close to 1 and very stable.
Since the true PNCC varies among fabricated PNS wafers, its uncertainty was estimated by the variance due to repeatability and day-to-day variability of one-time fabrication (EquationEquation (11c))(11c)
(11c) . Since the true PNCC is unknown, the normalizing factor to calculate the RSU of the true PNCC
is substituted with the experimentally evaluated average value
(12)
(12)
3. Results
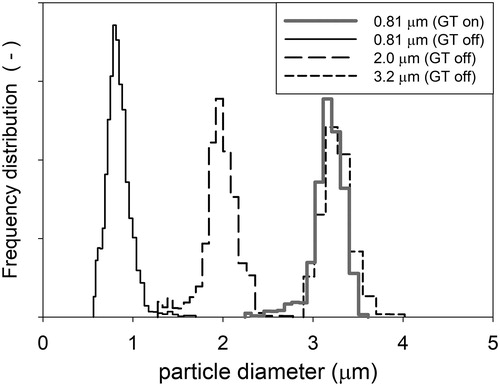
3.1. Particle size distribution of droplets after condensation of water vapor
shows the particle size distribution (PSD) of condensation-grown droplets measured by the LS-DC at the exit of the GTC. Particle diameter is defined as PSL-equivalent optical diameter. The particles delivered to the GTC were PSL particles with a 0.814 µm diameter whose measured size distributions were included in the figure. No water was added to the GTC, and no temperature control was applied to the GTC when the size distribution of the PSL particles was measured by the LS-DC. The diameters of the condensation-grown droplets were all greater than (= 1.4 µm) of the nozzle. The figure includes the measured size distribution of PSL particles with diameters of 2.0 and 3.2 µm. The certificate of the PSL particles shows that the coefficient of variation of the size distribution ranges from 0.02 to 0.03. The measured width of the droplet sizes was qualitatively similar to those of the PSL particles, indicating that the droplets are monodisperse.
Figure 3. PSD measured by the LS-DC. Solid, long dash, and short dash lines are the PSD of PSL particles whose diameters are 0.81, 2.0, and 3.2 µm, respectively. Solid gray lines are condensation-grown droplets whose seed particles are 0.81 µm PSL particles. Particle diameter is defined as PSL-equivalent optical diameter.
3.2. Evaluation of a particle number conversion factor, PNCC
shows an example of SEM images of 0.814 µm PSL particles deposited on a wafer. Approximately one thousand PSL particles were deposited at one spot on a wafer, inducing agglomerates. Agglomerates of up to seven PSL particles were observed; however, it was easy to discern and count each PSL particle in these agglomerates.
Figure 4. SEM images of the deposited particles on a wafer at rest. Gray arrows in the inset image indicate PSL particles whose average diameter is 0.814 µm.
shows the experimentally evaluated PNCC, from five different days. Five PNCCs were evaluated in a given day. The PNCC ranged from 0.963 to 1.000, which were all less than the upper limit of PNCC
The average of all PNCC, which is
in EquationEquation (6a)
(6a)
(6a) , was 0.9914, and the value was used to predict the value of
on a newly fabricated PNS wafer (EquationEquation (7)
(7)
(7) ). summarizes the results of ANOVA on the PNCC. The standard deviation due to repeatability,
was 0.0085, and the day-to-day variability had negligible effect. The combined standard uncertainty of the PNCC (Equation (11)) was 0.0056, and the largest uncertainty component was the systematic error.
Figure 5. Particle number conversion factor, Five wafer samples were made on a day, and the same experiments were carried out for five days. The dotted line is the average value.
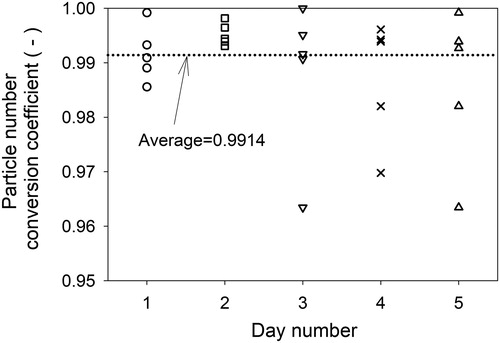
Table 2. Uncertainty analysis on the experimentally evaluated PNCC,
3.3. Fabrication of PNS wafers: The comparison of the predicted vs. measured
3.3.1. Uncertainty of a predicted particle number on a PNS wafer
shows an example of a programed deposition trajectory. (For further such examples see the spreadsheet included with the SI.) In this example, the pitch between horizontal segments is set to 0.5 mm. shows a map of particulate matter observed on a fabricated PNS wafer. The map clearly shows that PSL particles are deposited along a programed path. summarizes the uncertainty analysis of the predicted particle number on a fabricated PNS wafer, The RSU of the true PNCC, which was estimated from the random component of
was 0.0086. After combining the RSU of the average PNCC,
the RSU of the
was estimated to be 0.0103. In conclusion, the 95% confidence interval, which is equivalent to 2 × RSU, of
is approximately ± 2.0%.
Figure 6. (a) Example of a programed deposition trajectory and (b) a map of particulate matter observed on a fabricated PNS wafer (right). A WSS (Minimal WSS, YGK, Japan) was used to detect particulate matters on the wafer.
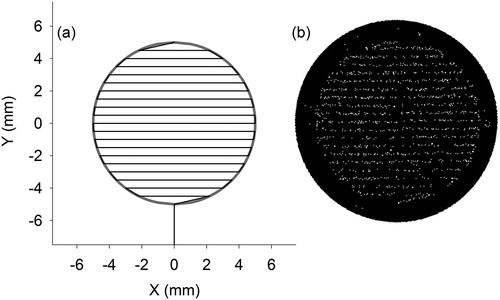
Table 3. Uncertainty analysis on the predicted number of particles on a newly fabricated PNS wafer,
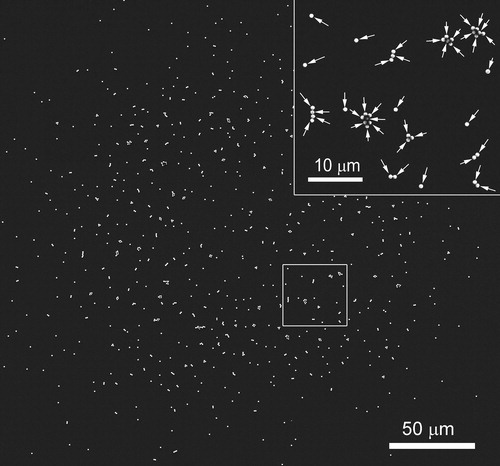
3.3.2. The effect of particle number
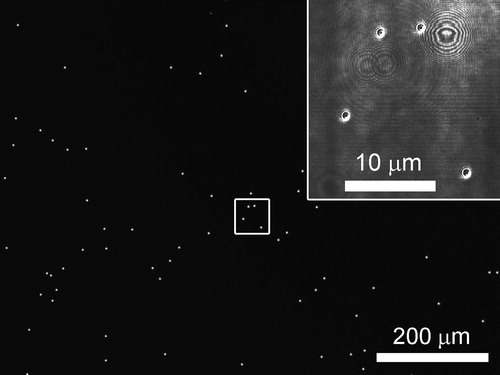
As explained in Section 2.3.1, seven PNS wafers were made with varying ranging from 10 to 10,000. shows an optical micrograph of the wafer with the highest particle number, which was about 11,000. Bright dots were first identified from the images taken under 10× magnification. Then as shown in the inset of , these dots were observed more closely in the images taken under 100× magnification to identify whether each dot was a PSL particle or not. It was very rare to observe foreign objects other than PSL particles, and particle agglomeration was not observed at all on these PNS wafers. These observations suggest two facts. First, there are almost no multimers of PSL particles in the aerosol exiting from the DMA when the particle number concentration is on the order of a few particles per cubic centimeter. Second, the droplets in the aerosol jet at the exit of the GTC do not coalesce into other droplets on a wafer when the average distance between two droplets along a deposition path is greater than about 100 µm.Footnote6
Figure 7. Optical micrograph of a PNS wafer whose particle number is about 11,000. PSL particles with a 0.814 µm particle diameter were used to fabricate the PNS wafer. A laser optical microscope set to 10× magnification was used to obtain the image. Inset image is the close-up of the boxed area under 100× magnification.
The experimental conditions and results of the fabricated PNS wafers are shown in . Also, shows the measured value normalized by the predicted values (
or
). The dashed line shows a 95% confidence interval of the ratio. When the condensation-grown droplets are counted at the exit of the GTC nozzle the ratio
ranges from 0.988 to 1.009 () over
ranging from 10 to 10,000. Since the PNCC accounts for
and
(EquationEquation (4)
(4)
(4) ) the predicted value
is closer to the observed value than
the error from the observed value is reduced by about 1%. Measured
are within their confidence intervals, whose lower and upper boundaries are 0.979 and 1.021, respectively, indicating that our uncertainty analysis accounts for major sources of variations. These results demonstrate that the proposed method accurately controls the particle number on a fabricated PNS wafer in the range from 10 to 10,000. By contrast, when the particle number is predicted from the number concentration measured with an OPC in parallel with the GTC, the predicted particle number,
is generally less than the measured value,
Figure 8. The ratio of particle number on a fabricated PNS wafer measured by optical microscope, to the predicted particle number. “In series with GTC” means the predicted number
is measured by the LS-DC at the exit of GTC. “In parallel with GTC” means that the predicted number
is calculated from the number concentration measured by an OPC upstream of the GTC and the sampling flowrate of the GTC. Dashed lines are 95% confidence intervals calculated from the uncertainty analysis. Gray lines are 95% confidence intervals of a scenario in which Poisson sampling process is the only source of uncertainty.
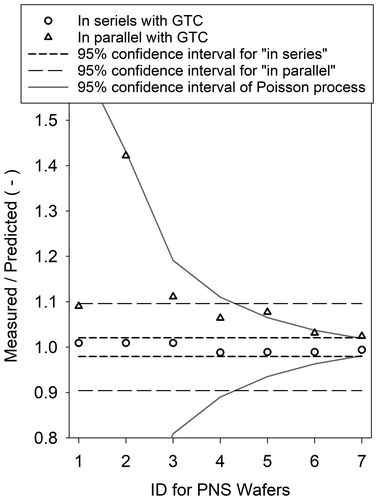
Table 4. Summary of fabricated PNS wafer with 0.814 µm PSL particles.
3.3.3. The effect of particle sizes
As explained in Section 2.3.2, PNS wafers were fabricated by using fluorescent PSL particles with diameters of 0.18, 0.102, and 0.046 µm. shows an image of fluorescent particles whose particle diameters are 0.046 µm on a PNS wafer. By using an optical microscope with a fluorescent illuminator, fluorescent PSL particles whose diameter is as low as 0.046 µm can be identified on the wafer. summarizes the experimental condition and results. The table also includes the results of Wafer No. 5 in whose particle number is similar to that of PNS wafers with 0.18 µm PSL particles. Measured ranged from 0.982 to 0.989, and these values are within their 95% confidence interval. These results prove that the PNCC
which was evaluated by using 0.814 µm PSL particles, is independent of particle diameter over a 0.046–0.814 µm particle diameter range.
Figure 9. Optical microscope image of fluorescent particles on a PNS wafer. Particle diameter is 0.046 µm. The image was taken under fluorescence mode with an Axio Imager 2 (Carl Zeiss Germany).
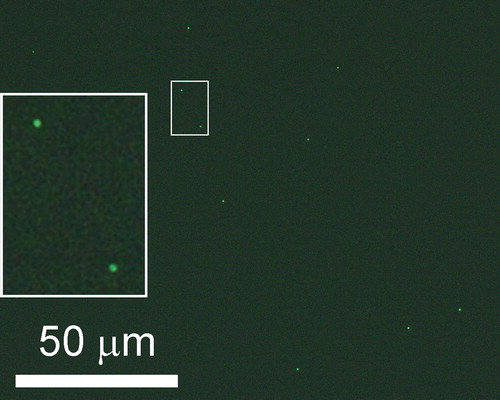
Table 5. Summary of particle size dependence of
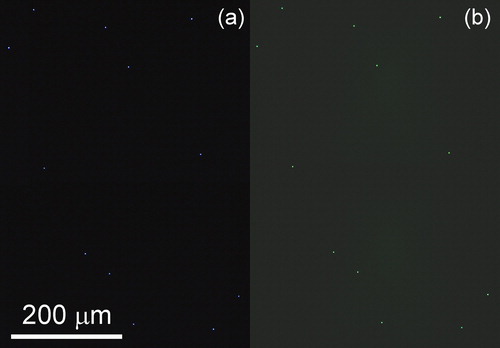
shows the optical microscope images of fluorescent particles deposited on a PNS wafer. Particle diameter is 0.18 µm. Images were taken under (a) fluorescence mode and (b) dark-field mode. Fluorescent particles can only be detected under fluorescence mode, and the location of particles in these two images is in good agreement. This experimental observation supports the conclusion that the particles observed under dark-field mode of the optical microscope are PSL particles and not foreign objects.
Figure 10. Optical microscope images of fluorescent particles deposited on a PNS wafer. Particle diameter is 0.18 µm. (a) Images were taken under dark-field mode and (b) images under fluorescence mode.
4. Discussion
4.1. Systematic error
4.1.1. In series with GTC
In this study, the particle number on the wafer was predicted from the number of condensation-grown droplets, which were counted by using an LS-DC at the exit of the impaction nozzle. Consequently, as shown in the predicted values agreed with the observed value
within 2%. However,
were consistently less than
indicating that a small fraction of droplets counted by the LS-DC failed to impact on the wafer while the PNS wafers were being fabricated. The PNCC was evaluated under static conditions, while the PNS wafers were fabricated under dynamic conditions. Here, we discuss whether or not being dynamic decreases the deposition efficiency of droplets on a wafer surface. Average flow velocity at the nozzle exit was compared to the speed of the XY-stage during deposition. In this study, the average flow velocity was 4.6 × 10³ to 2.8 × 10⁴ times faster than the stage speed. It is unlikely the motion of the XY-stage influences the inertial motion of the droplets. Next, we discuss the effect of thermophoresis on the deposition efficiency. During the PNCC evaluation experiments, the impaction spot is constantly cooled by the aerosol jet. On the other hand, the impaction spot is always moving during the fabrication of a PNS wafer; therefore, the temperature of the impaction spot is expected to be higher.
Thermophoresis is a potential source of systematic error. Thermophoretic drift velocity of condensation-grown droplets was estimated under an extreme condition in which the temperature gradient exists only in a boundary layer of a stagnation point flowFootnote7 (Kulkarni, Baron, and Willeke Citation2011; Schlichting and Gersten Citation2003). From the results shown in , the number mean diameter of the droplet size distribution is 3.2 µm. The thermophoretic drift velocity of a droplet with a size of 3.2 µm was 2.8 mm/s. Under the drift velocity, thermophoretic force potentially pushes the droplets away from the wafer surface if the inertial motion of the droplet ends before the droplet reaches the surface. Additional calculation showed that the stopping distance of the droplet was 0.44 mm, which is about two times longer than the boundary layer thickness. Therefore, almost all droplets are expected to penetrate through the boundary layer. The flow Reynolds number at the exit of the impaction nozzle, is about 700, which is greater than the lower limit of the impactor-design rule (
> 500) (Marple and Liu Citation1975; Marple and Willeke Citation1976), but the value is relatively low. The axial velocity just above the inner wall of the impaction nozzle is lower than
due to the presence of viscous drag over the inner wall. The stopping distance of droplets which passed just above the inner wall of the impaction nozzle may have become too short to reach the wafer surface.
4.1.2. In parallel with GTC
suggests that the predicted particle number on a PNS wafer tends to be less than the observed value when
is predicted from the number concentration measured in parallel with the GTC. The PNCC in EquationEquation (8)
(8)
(8) ,
is a function of multiple factors: the product
the transport efficiencies through two segments (between the inlet of the OPC [or GTC] and the exit of the static mixer), the activation efficiency inside the GTC, the counting efficiency of the OPC, and the deposition efficiency of the droplets. The evaluation of the PNCC is rather laborious; therefore, the value from our previous study was used in this study. It is most likely that the GTC flowrate has an error or that one or more of the above four efficiencies has shifted by an unknown amount over time. In conclusion, the accuracy of the prediction is limited when the particle number on a PNS wafer is predicted from the number concentration measured in parallel with the GTC.
4.2. Random error
4.2.1. In series with GTC
Statistical uncertainty due to the Poisson sampling process is negligible because the counted and deposited droplets are the same. The method proposed by this study enables the fabrication of PNS wafers with smaller particle numbers over a wide particle diameter range, with the expected RSU of the particle number being a few percent or less.
4.2.2. In parallel with GTC
Poisson uncertainty is present when the particle number on a flat surface is predicted from the number concentration measured in parallel with a deposition device, because the counted and deposited droplets are different. The gray lines in indicate 95% confidence intervals in a scenario in which the Poisson sampling process is the only source of uncertainty, with the values estimated by 1 ± 2()−0.5. The value of
of Wafer No. 2 is close to the confidence intervals of the Poisson sampling process.
5. Conclusions
This study introduces a method to deposit a known number of PSL particles along a controlled path over a flat surface whereby the number of deposited PSL particles is known with high accuracy. Water-insoluble particles are first aerosolized and then serve as condensation nuclei as they flow through a laminar flow growth tube. After condensation is complete the micrometer-sized droplets are accelerated through a nozzle and deposited on the flat surface by inertial impaction. The number of droplets is counted by a LS-DC at the nozzle exit before impaction. The particle number on the surface is predicted by PNCC × droplet counts. The PNCC was evaluated experimentally; the average and its RSU were 0.9914 and 0.0056, respectively, indicating almost all droplets are deposited on a flat surface. Uncertainty analysis showed that the 95% confidence interval of the predicated particle number is within ±2% of the particle number.
The method was applied to fabricate PNS wafers whose intended use is to evaluate the counting efficiency of a WSS. Monodisperse PSL particles were deposited on half-inch wafers, and their particle diameters were 0.046, 0.102, 0.18, and 0.814 µm. The ratio of the observed particle number to predict particle number, was evaluated.
were nearly constant over a 0.05–0.8 µm particle diameter range, and the ratios were also nearly constant when
was varied from 10 to 10,000. In all PNS wafers, the measured number of deposited particles was confirmed to be within the 95% confidence interval of the predicted value. This method is especially useful when a relatively small number of particles need to be deposited on a flat surface with high accuracy. By using this method, the uncertainty of detected particle numbers using a WSS is expected to decrease by a factor of at least five, ultimately improving the quality control of the film-forming process in the manufacture of electronic devices.
| Nomenclature | ||
| = | Cunningham slip correction factor, (−) | |
| = | particle number concentration in aerosol phase measured by an OPC (particles/m3) | |
| = | diameter of condensation-grown droplets, (m) | |
| = | diameter of seed particles, (m) | |
| = | particle diameter corresponding to | |
| = | total length traveled of deposition paths, (m) | |
| = | particle generation rate of inkjet aerosol generator, (particles/s) | |
| = | particle count rate of a LS-DC (particles/s) | |
| = | number of repeated particle deposition experiments in a given reproduced experiment, (−) | |
| = | number of reproduced particle deposition experiments, (−) | |
| = | number of droplets measured by an LS-DC, (droplets) | |
| = | total particle number that a GTC outputs to fabricate a PNS wafer, (particles) | |
| = | number of particles on a PNS wafer counted by using an optical microscope (OM), (particles). | |
| = | number of particles on a PNS wafer counted by using a SEM (particles). | |
| = | true particle number deposited on a wafer, (particles). | |
| = | number of deposited particles on a PNS wafer predicted from the particle number concentration measured in parallel with GTC, (−). | |
| = | number of deposited particles on a PNS wafer predicted from the number of droplets counted at the exit of GTC, (−) | |
| = | inlet flowrate of GTC, (m3/s) | |
| = | flow Reynolds number at the exit of impaction nozzle, (−) | |
| = | standard deviation of PNCC representing the variation among repeated measurements in a given reproduced experiment, (−) | |
| = | standard deviation of PNCC representing the day-to-day variation, (−) | |
| = | Stokes number of condensation-grown droplets at the exit of GTC, (−) | |
| = | according to a rule of impactor design, when accelerated particles have Stokes number greater than this value the particles are captured onto a flat surface, (−) | |
| = | total time spent to deposit particles and to fabricate a PNS wafer, (s) | |
| = | total time spent to count droplets exiting from an LS-DC, (−) | |
| = | average flow velocity at a GTC outlet nozzle, (m/s) | |
| = | standard uncertainty with respect to an uncertainty element “x” | |
| = | average speed of a motorized XY-stage, (m/s) | |
| = | diameter of a GTC outlet nozzle, (m) | |
| = | PNCC which relates | |
| = | experimentally evaluated PNCC, an SEM is used to count the number of PSL particles on a wafer (−) | |
| = | PNCC averaged over of | |
| = | efficiency of an LS-DC to count condensation-grown droplets on a wafer, (−) | |
| = | efficiency of a depositing condensation-grown droplets on a wafer, (−) | |
| = | efficiency of GTC to activate the condensation of water vapor on PSL particles, (−) | |
| = | the product of | |
| µ | = | dynamic viscosity of gas, (Pa-s) |
| = | mass density of condensation-grown droplets, (kg/m3) | |
Supplemental Material
Download (32.9 KB)Supplemental Material
Download MS Word (25.2 KB)Acknowledgments
The authors would also like to acknowledge with much appreciation Dr. Gregory S. Lewis and Dr. Susanne V. Hering from Aerosol Dynamics Inc. for their assistance with a water-based GTC.
Additional information
Funding
Notes
1 Conventional sizes of silicon wafer are 15 cm (6 in.) and 30 cm (12 in.); however, these sizes were not chosen for this study because using larger sized wafers significantly increases the cost of fabricating PNS wafers. Storage and handling of larger sized wafers require a cleanroom with a laminar flow system. In addition, uniform deposition of particles over large wafers requires an industrial grade linear positioner. By choosing a half-inch wafer a PNS wafer can be fabricated by using air-filtration and positioning devices designed for laboratory use.
2 The counting efficiency of the LS-DC is experimentally evaluated as a part of the uncertainty analysis of the PNCC (see Section 2.3.3).
3 While images were being obtained using an SEM, care was taken to have a 10% overlapping area between two neighboring images with a few common particles between these two images. If only a part of a PSL particle was seen at the edge of an image an overlapping image was checked to identify whether it was a PSL particle or not. This study assumes that neither over- nor under-counting of PSL particles occurred during the process of making a composite image. In addition, the number of particles in three composite images was evaluated by two different operators, both of which reported the same number of particles in these three images.
4 Images of the PSL particles on the wafer were obtained under 10× magnification using dark-field mode, and the particle number was counted from a composite image. The magnification was increased to 100× when the PSL particles could not be clearly identified under 10× magnification.
5 The magnification of the OM was set to 20× or 50× when the images of PSL particles on the wafer were taken. In order to reduce the number of images to be taken the deposition area was reduced to a smaller rectangle (3 mm × 0.3 mm) when the magnification was set to 50x. A condensation particle counter (Model 3022A, TSI, USA) was used instead of an OPC to monitor the number concentration of PSL particles. When the particles were deposited was controlled at about 1000.
6 Approximately 11,000 PSL particles were deposited along a path with a total length of 950 mm.
7 The temperature is assumed to increase from the gas temperature (42 °C) to the wafer temperature (100 °C) within a boundary layer thickness of stagnation point flow (Schlichting and Gersten, Citation2003). The calculated values of the layer thickness and temperature gradient were 0.22 mm and 2.8 × 10⁵ k/m, respectively.
Related Research Data
References
- Hering, S. V., and G. S. Lewis. 2009. A miniature collector for the concentrated collection of fine airborne particles in European Aerosol Conference, Abstract T091A017, Karlsruhe, Germany.
- Hering, S. V., M. R. Stolzenburg, F. R. Quant, D. R. Oberreit, and P. B. Keady. 2005. A laminar-flow, water-based condensation particle counter (WCPC). Aerosol Sci. Technol. 39 (7):659–672. doi:10.1080/02786820500182123.
- Iketani, T. 1990. Constant aerosol generater “jsr aeromaster”. Kuuki Seijo 28 :531–536. (in Japanese).
- JCGM/WG1 2008. Jcgm 100 2008 uncertainty of measurement – part 3: Guide to the expression of uncertainty in measurement (gum:1995). Sèvres, France: BIPM.
- Kousaka, Y., K. Okuyama, M. Shimada, K. Ohshima, and T. Hase. 1989. Performance of a nebulizer for standard aerosol particle generation. Earozoru Kenkyu 4 :294–302. doi:10.11203/jar.4.294.
- Kulkarni, P., P. Baron, and K. Willeke. 2011. Chapter 2: Fundamentals of single particle motion. In Aerosol measurement: Principles, techniques, and applications, third edition, eds. P. Kulkarni, P. Baron, and K. Willeke, 15–30. Hoboken, NJ: John Wiley & Sons.
- Li, L., G. W. Mulholland, L. Windmuller, M. C. Owen, S. Kimoto, and D. Y. H. Pui. 2014. On the feasibility of a number concentration calibration using a wafer surface scanner. Aerosol Sci. Technol. 48 (7):747–757. doi:10.1080/02786826.2014.922162.
- Liu, B. Y. H., and K.-H. Ahn. 1987. Particle deposition on semiconductor wafers. Aerosol Sci. Technol. 6 (3):215–224. doi:10.1080/02786828708959135.
- Liu, B. Y. H., S. K. Chae, and G. N. Bae. 1993. Sizing accuracy, counting efficiency, lower detection limit and repeatability of a wafer surface scanner for ideal and real‐world particles. J. Electrochem. Soc. 140 (5):1403–1409. doi:10.1149/1.2221569.
- Marple, V. A., and B. Y. H. Liu. 1975. On fluid flow and aerosol impaction in inertial impactors. J. Colloid Interface Sci. 53 (1):31–34. doi:10.1016/0021-9797(75)90031-4.
- Marple, V. A., and B. A. Olson. 2011. Sampling and measurement using inertial, gravitational, centrifugal, and thermal techniques. In Aerosol measurement, eds. P. Kulkani, P. A. Baron and K. Willeke, 3rd ed., 129–151. Hoboken, New Jersey: John Wiley & Sons, Inc.
- Marple, V. A., and K. Willeke. 1976. Impactor design. Atm. Environ. 10 (10):891–896. doi:10.1016/0004-6981(76)90144-X.
- MSP-Corp 2012. Calibration wafer standards – Full PSL depositions. In MSP product information bulletin, MSP-PI-2200-2201, Rev. B. Shoreview, Minnesota: MSP Corporation.
- Pui, D. Y., Y. Ye, and B. Y. H. Liu. 1990. Experimental study of particle deposition on semiconductor wafers. Aerosol Sci. Technol. 12 (4):795–804. doi:10.1080/02786829008959393.
- Rader, D. J., and V. A. Marple. 1985. Effect of ultra-Stokesian drag and particle interception on impaction characteristics. Aerosol Sci. Technol. 4 (2):141–156. doi:10.1080/02786828508959044.
- Schlichting, H., and K. Gersten. 2003. 5.2.3. Axisymmetric stagnation-point flow. In Boundary layer theory, eds., H. Schlichting and K. Gersten, 118–119. Berlin, Heidelberg: Springer.
- SEMI 2009a. SEMI M53-1109 – Practice for calibrating scanning surface inspection systems using certified depositions of monodisperse reference spheres on unpatterned semiconductor wafer surfaces. Milpitas, California: Semiconductor Equipment and Materials International.
- SEMI 2009b. SEMI M58-1109 - Test method for evaluating DMA based particle deposition systems and processes. Milpitas, California: Semiconductor Equipment and Materials International.
- SEMI 2010. SEMI M50-0310 - Test method for determining capture rate and false count rate for surface scanning inspection systems by the overlay method. Milpitas, California: Semiconductor Equipment and Materials International.
- Sumizawa, H., and H. Kuroiwa. 2013. Development of a half-inch wafer. Clean Technol. 23 :24–26. (in Japanese).
- Tajima, N., S. Khumpuang, S. Hara, K. Iida, K. Ehara, and H. Sakurai. 2016. A procedure for making particle number standard wafers: Calibration of wafer surface scanners. Earozoru Kenkyu 31 :266–277. (in Japanese). doi:10.11203/jar.31.266.
- Umeyama, N., A. Yamazaki, T. Sakai, S. Khumpuang, and S. Hara. 2017. Development of a half-inch wafer for minimal fab process, in 2017 IEEE Electron Devices Technology and Manufacturing Conference (EDTM), Toyama, Japan, 228–229.
- Yook, S.-J., H. Fissan, T. Engelke, C. Asbach, T. van der Zwaag, J. H. Kim, J. Wang, and D. Y. H. Pui. 2008. Classification of highly monodisperse nanoparticles of nist-traceable sizes by TDMA and control of deposition spot size on a surface by electrophoresis. J. Aerosol Sci. 39 (6):537–548. doi:10.1016/j.jaerosci.2008.03.001.