
 ?Mathematical formulae have been encoded as MathML and are displayed in this HTML version using MathJax in order to improve their display. Uncheck the box to turn MathJax off. This feature requires Javascript. Click on a formula to zoom.
Abstract
A new porous fiber shape was produced, one with a longitudinal notch. This new shape increases the surface area and therefore the overall number of pores, which in turn leads to a higher per-fiber surface charge density. Filters with charge generally show advantageous lower pressure drops when compared with the same filtration efficiencies. Although previous studies have hypothesized that increasing the surface area of porous fibers can improve charge capacity, but few experiments have proven this concept. In this study, two different micron-sized fibers were fabricated via electrospinning: smooth (“normal”) fibers and the novel notched fibers with surface pores. The fiber profile and voltage drop of the two fibers were measured, and the penetration rate of the two types of fibers before and after charging was measured with aerosol particles ranging from 25 to 478 nm in size. The results showed that the specific surface area of the notched fiber was 47.44 ± 0.67 m2 g−1, larger than that of the smooth fibers (2.64 ± 0.08 m2g−1). The notched fiber was charged by negative corona discharge, and the surface capacitance was measured to be −51.2 µC m−2 when the thickness was 0.19 mm, which was also larger than that of the smooth fibers (−38.2 µC m−2). When charged, the value of the average quality factor of the notched fibers increased from 0.030 to 0.068 Pa−1. Overall, the notched fibers demonstrated better filtration efficiency. We concluded that this novel fiber shape delivers both low penetration rates and low pressure drops.
Copyright © 2019 American Association for Aerosol Research
EDITOR:
Introduction
The impact of air pollution on public health and the environment is a timely and vital issue (Chong et al. Citation2017; Shou et al. Citation2015). A growing body of research has found correlations between airborne particulate pollution and lung cancer (Saarikoski et al. Citation2018; Zhang et al. Citation2015). In particular, ultrafine particles (UFPs) with diameter less than 0.1 μm have received considerable attention, as they have been shown to cause inflammatory responses in the respiratory system (Shi, Ekberg, and Langer Citation2013). Filtration has long been considered to be a practical and reliable method to remove airborne particulate pollutants and much academic research has been conducted to improve the filtration efficiency of fiber filters for such pollutants.
The deposition of particles can be divided into two major categories. The first category utilizes mechanical mechanisms that include impaction, interception, diffusion, and gravity. The second category includes the mechanism that relies on static electricity, in which the surface charge of the individual fibers play a significant role (Zaripov, Solov’eva, and Solov’ev Citation2015). The filtration efficiency of fiber filters can be improved by optimizing two aspects. One approach is to increase the collision opportunity between particles and fibers. The other is to increase the charge capacity of the filter fibers. Promising results in enhancing filtration efficiency have been shown when escalating charge capacity of filter fibers is combined with lower pressure drops (Choi et al. Citation2015; Li and Jo Citation2010; Sambudi et al. Citation2017).
Electrospinning is a simple and reliable method to produce continuous non-woven fibers by applying static electricity to polymer melts or solutions (Chronakis Citation2005; Greiner and Wendorff Citation2007; Li et al. Citation2015; Teo and Ramakrishna Citation2006). Electrospinning can produce fibers with a wide range of diameters, from less than 100 nm to several microns thick (Ahn et al. Citation2006). At the same time, electrospun fibers can exhibit a higher surface-to-volume ratio compared to conventional fibers of the same diameter (Bhardwaj and Kundu Citation2010).
One method of increasing comparative surface areas in electrospun fibers is to increase the porosity, which can be achieved by using polymer solutions with multiple solvents of various volatilities (Goh et al. Citation2013; Khajavi and Abbasipour Citation2012). Porous fibers not only have larger surface areas than non-porous fibers, in the case of charged fibers, studies have been shown that stored charge stability can be improved when the porosity range of charged fiber is between 70 and 80%. Raising porosity beyond 80% would result in the leakage of stored charge during the charging process (Xia et al. Citation2003). Large surface areas make porous fibers suitable for many applications such as scaffold engineering, drug delivery and air filtration.
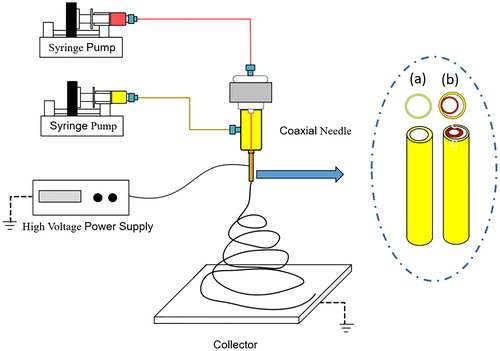
Electrospinning can be used to manufacture hollow fibers. In co-axial electrospinning, one needle is housed inside of another, and the ratio of the inner to outer diameters is controlled by changing the polymer solution flow velocity. Notched fibers, which further increase surface area by creating a longitudinal channel, are produced by spinning two polymer solutions with different electrical conductivities into an electric spinneret designed with an off-axis hollow core (biased-axis electrospinning) (Sukitpaneenit and Chung Citation2012; Wu et al. Citation2015; Zheng et al. Citation2016).
Nanofiber filters have better performance than microfiber filters due to the characteristics of larger surface area (Sundarrajan et al. Citation2014). However, nanofiber filters also have several disadvantages, such as large pressure drops (Ahn et al. Citation2006) and being too soft and brittle to be used alone (Leung, Hung, and Yuen Citation2010). To effectively achieve both high filtration efficiency and low pressure drop, fibers can be charged, and the amount of charge can be increased by increasing fiber surface area (Li and Jo Citation2010; Romay, Liu, and Chae Citation1998). Improving both filtration efficiency and pressure could significantly impact the range and scope of filtration and air cleaning applications.
The purpose of this study was to fabricate and characterize notched fibers, evaluating thickness, surface area, surface charged capacity, and filtration characteristics against comparable smooth fibers. We focused on the manufacture of notched fibers and the effects of larger surface area and surface charge on filtration performance. As a result, we were to establish a bench-scale biased-axis fiber manufacturing system.
Experimental materials and methods
Fiber geometry and topography are closely related to the operation of the spinning tip (Ko et al. Citation2014; Kong et al. Citation2009). A single-fiber electrospinning setup is simple in design and operation. A polymer solution or melt is injected into a single container, a single fiber is extruded, and the resulting fiber surface is mostly smooth (Bhardwaj and Kundu Citation2010). Coaxial electrospinning device configurations are more complex, requiring the injection of two different polymer solutions into inner and outer cylinders, which is then followed by electrospinning (Sun et al. Citation2003).
If the internal and external needles are deliberately in unilateral contact, then this becomes biased-axis electrospinning (Silva, Vistulo de Abreu, and Godinho Citation2017). The resulting fibers are further treated by chemical methods or high temperatures to remove the partially-exposed inner layer of the fibers, which produces a longitudinal notch that runs the entire length of the fiber. In this study, an electrospinning system was developed to produce both smooth fibers and notched porous fibers (“notched fibers”). Bench-level filtration testing and corona discharge devices were also developed and constructed.
Material
PMMA (Poly(methyl methacrylate, PMMA)), PS (Polystyrene, PS), and PEO (Polyethylene oxide, PEO) were selected because they are low-cost and widely-used polymers that are compatible with most solvents (Becker and Gärtner Citation2008; Megelski et al. Citation2002; Rezvani, Hedeshi, and Bagheri Citation2017). Two different sets of precusors were used in this study:
for the smooth fibers, a precursor solution was prepared by dissolving PMMA in DMF (N, N-Dimethylformamide).
for the notched porous fibers, a precursor solution for the outer layer prepared by dissolving PS in DMF; and a precursor solution the inner layer was prepared by dissolving PEO in DMF at 60 °C. Detailed information is shown in .
Table 1. Manufacturing parameters of fiber.
Experimental set up
The basic components of the electrospinning system were composed of a high voltage DC power supply (SL50PN300, Spellman, USA), syringe pump (KDS 100, KD Scientific, USA), syringe, stainless steel needles, and the polymer solution. The positive electrode was connected to the stainless needle(s), and the grounding electrode was connected to the collecting device, which were 20 cm apart. An electric field would form after the DC 12 kV voltage was opened; the propelled solution would form a droplet at the tip of the needle; and the surface charge density would rise and be accompanied by electrostatic repulsion. When the field intensity reached its limit, droplets would physically extend to form a Taylor cone. At a critical point, the surface of the Taylor cone would be ejected by the charged liquid column and collected through air toward the grounded collection plate, and the solvent would evaporate to form a fiber (Taylor Citation1969). Iron mesh and aluminum foil squares (5.5 cm2) were used to collect fibers, which were then stored in culture dishes. An example setup to fabricate biased-axis fibers is illustrated in .
Figure 1. Schematic diagram of electrospinning elements.
This method was used to create both smooth and biased-axis fibers, the latter would be the precursor to notched fibers. To remove the PEO core and create the desired notch, the biased-axis fibers were soaked in deionized water at room temperature for 24 h and then dried at 60 °C for 12 h. Ion fans (BR-F-1200, SUNWAY, Taiwan) were used to remove residual static charge to avoid bias in subsequent experiments.
Measurement of fibers
SEM (Scanning Electron Microscope, SEM) (5136MM, Tescan, Czech) and Image J software were used to observe and measure fiber appearance and average. The mass and thickness of fiber were measured using balance (SI-234, DENVER, USA) and thickness gauge (Type H Thickness Gauge, PEACOCK, Japan). Filter porosity (Pm) was calculated using EquationEquations (1)–(3) in which Vm/V is the packing density of fiber (Hinds Citation1999). The density was estimated by using different propelling velocity ratios, solution concentration and density of internal and external polymers.
(1)
(1)
(2)
(2)
(3)
(3)
where Pm is porosity of the filter; Vm is volume of the fibers as calculated by weight; V is the overall dimensional volume of the filter; mnw is the weight before water treatment of filter; ρPS is the density of PS (1.05 g cm−3); ρPEO is the density of PEO (1.27 g cm−3); and l, w, and t are the length, width, and thickness of the filter, respectively.
Penetration and fiber charge characteristics measurement
Size fractional penetration rate is one of the most important indexes used to evaluate the filtration efficiency of fibers and is how the influence of particle size on filtration is understood. The penetration measurement apparatus included a corona discharge charger, a particle generation facility, a filtration system and a measurement system. This study used a needle-type corona charger for charging fibers. The distance between the needle and the grounded collection plate was 1.5 cm. In order to avoid sparks caused by excessive current, charging conditions were fixed at DC voltage −7 kV, 0.02 mA and a charging time of 8 min. After completion, the surface potential of the fiber surface was measured by an electrostatic fieldmeter (FMX-003, SIMCO, Japan).
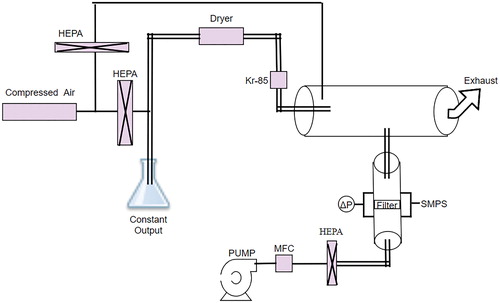
A constant output atomizer was used to produce sub-micron sodium chloride (NaCl) particles for testing. shows the concentration and distribution of the particles as measured by the scanning mobility particle sizer (SMPS, model 3080 and 3025 A, TSI Inc., Shoreview, MN). The average particle number concentration was 5.79 × 10⁵ ± 9.56 × 10³ # cm−3; the particle size range was 25–450 nm; the count median diameter (CMD) was 87.12 ± 0.58 nm. In order to eliminate particle charge imbalance and improve the stability of the experimental system, Kr-85 was used to dissociate air molecules into positive and negative ions and thereby to bring NaCl particles into Boltzmann charge balance equilibrium. The face velocity was set at 10 cm s−1 and the flow rate was controlled by a mass flow controller, and the particles were introduced into the filtration system for testing, as shown in . Finally, SMPS was used to measure the concentration and distribution of NaCl particles, and a differential pressure transmitter (1131110, PEL, Finland) was used to measure the pressure drop of filters, both variables were measured upstream and downstream. By measuring the difference between the upstream and downstream particle counts, the penetration rate of the fiber filter with different particle sizes could be obtained, as shown in EquationEquation (4)(4)
(4) .
(4)
(4)
where P is penetration rate (%) and Cin and Cout represent the aerosol concentrations (#cm−3) measured in upstream and downstream of the filter, respectively. Lower P values indicate more particles captured and therefore represent better performance.
Figure 2. Distribution of particles input of filter.
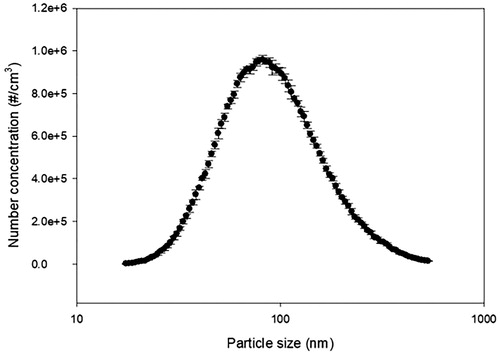
Figure 3. Schematic diagram of filtration and measurement.
Results and discussion
Appearance of fibers
The appearance, diameter and pore characteristics of fibers were evaluated by SEM. A smooth fiber micrograph is shown in . shows both a micrograph and the pore diameter distribution of the notched fibers. According to the definitions established by the International Union of Pure and Applied Chemistry (IUPAC), fiber holes with less than 2 nm in diameter, from 2 to 50 nm and larger than 50 nm are defined as “microporous,” “mesoporous,” and “macroporous,” respectively (Ying, Mehnert, and Wong Citation1999). Approximately 90 and 10% of the notched fiber pores were mesoporous and macroporous, respectively. It is speculated that the wide range of pore sizes was due to differences in the rates of solvent evaporation as influenced by different needles in the electrospinning apparatus. Methods of controlling fiber pore size will be further studied in the future.
Figure 4. SEM image of smooth fibers.
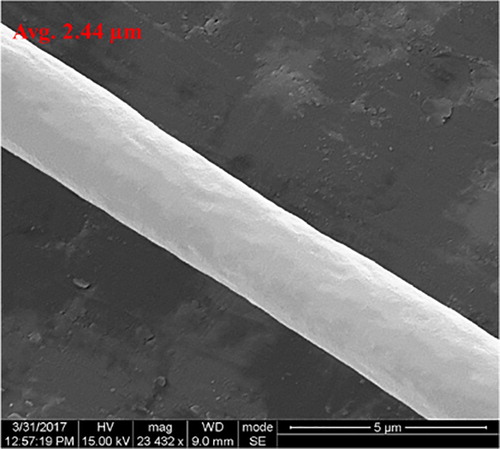
Figure 5. Notched fibers (a) SEM, and (b) pore distribution.
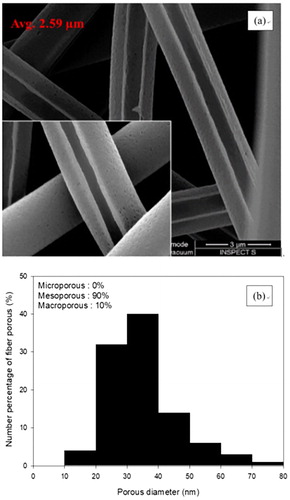
The specific surface aresa of the smooth and notched fibers were analyzed by a specific surface area analyzer (ASAP 2020, Micromeritics) under fixed-diameter conditions. Smooth fibers and notched fibers were found to have specific surface areas of 2.64 ± 0.08 and 47.44 ± 0.67 m2 g−1, respectively. The measured surface area of notched fibers is over an order of magnitude higher than that of smooth fibers. The higher specific surface area of the notched fiber is at least partially attributed to its porous structure and irregular surface features.
Packing density and filter thickness are also factors affecting filter efficiency. Higher packing density would mean smaller gap between fibers, which creates a better trap for airborne particles. Likewise, the thickness of the filter material affects the flight time of particles passing through. Both factors can affect the probability of the particles being captured by the fibers in the filter and the penetration efficiency of the particles. Therefore, the subsequent experiments limited the range of fiber filling density to 5 ± 1%, and the thickness was divided into three groups: 0.1, 0.14, and 0.19 mm ( and ). For each thickness, three samples were created and tested.
Table 2. Property table of smooth fiber filter with diameter of 2.44 µm.
Table 3. Property table of notched-fiber filter with diameter of 2.59 µm.
Pressure drop of fibers and measurement of surface potential
Previous research has indicated that changing face velocity has an effect on the filtration efficiency and pressure drop of a filter (Li and Jo Citation2010; Leung, Hung, and Yuen Citation2010). When the face velocity of an air stream flowing against a filter is decreased, the contact time between the air flow and filter’s fibers increases. This increased contact time results in increased Brownian motion as airborne particles diffuse through a filter, thus increasing the filtration efficiency of a filter and resulting in a lower pressure drop. However, few studies refer to the effects of fiber geometry on filtration.
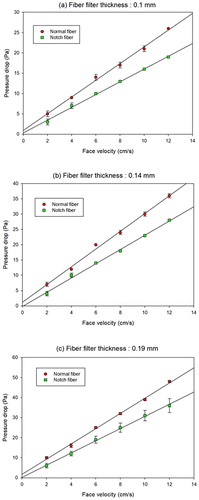
This study used a differential pressure gauge connected both upstream and downstream of the test filters to measure the pressure drop of the two different types of test filter materials under the same face velocity. The results are shown in . The pressure drop of the notched-fiber filter was slightly lower than that of the smooth fibers across all three thicknesses. Not only were face velocity and pressure drop positively correlated, but thickness and pressure drop of filter were also positively correlated. A preliminary explanation is that the packing densities of smooth-fiber filters are larger than those of notched-fiber filters for fibers of the same diameter, and as packing density increases, so does surface area (Li et al. Citation2015). In addition, it is also possible that the porosity of the notched fibers (as opposed to the smooth surface of the “normal” fiber) may have contributed to the lower pressure drops as well.
Figure 6. The pressure drop of filters at thicknesses of (a) 0.1 mm, (b) 0.14 mm, and (c) 0.19 mm.
In this study, the test filters were charged by negative corona discharge, and the difference in surface potential between smooth fibers and notched fibers was studied. Previous studies have shown that the larger the surface potential, the larger the charge capacity, as per EquationEquation (5)(5)
(5) (Noh et al. Citation2011; CitationTabti et al. 2009).
(5)
(5)
where ε is the dielectric constant (8.85 × 10⁻¹² F m−1); A is the surface area of the filter; t is the thickness of the filter; Q is charge (Coulombs); V is surface voltage (volts); and C is capacitance (Farads).
summarizes the surface voltage results of the 0.19 mm-thick smooth-fiber and notched-fiber filters. The results showed that notched fibers have higher surface potentials than smooth fibers (smooth −0.82 kV < notched −1.10 kV), presumably due to that their porous features and larger surface area enable them to carry more electrons per unit area. At the same time, the results of charge density on the surface of the 0.19 mm filters showed that the smooth-fiber charge capacity was within the 10–45 µC m−2 range found in available commercial products (Nifuku et al. Citation2001), while the charge capacity of the notched fibers was −51.2 µC m−2.
Table 4. The surface potential of 0.19 mm filter thickness.
Filtration characteristics of fibers
The main focus of this study was the effect of fiber charge on particle penetration rates when the face velocities at 10 cm s−1 were measured at. Besides fiber charge and diameter, filter geometry also plays a role on the particle penetration rate, with filter thickness being one of the most important factors. shows the particle penetration rates of both types of fibers in uncharged filters of different thicknesses. In most cases, the particle penetration rates of smooth-fiber filters were similar or higher than those of notched-fiber filters of the same size. Fiber thickness and particle penetration rate were negatively correlated. As expected, the penetration rate decreased as the thickness increased across the three filter sizes (0.1, 0.14, and 0.19 mm), which is consistent with other studies (Leung et al. Citation2010). The observed lower penetration rates of the notched-fiber filters were presumed to be related to their large surface area.
Figure 7. Penetration of uncharged filters (a) 0.1 mm, (b) 0.14 mm, and (c) 0.19 mm.
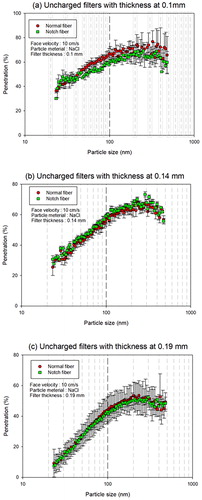
Different particle sizes respond to different trapping mechanisms (Kanaoka et al. Citation1987; Wang Citation2001). The main particle-capture mechanism of UFPs is diffusion. This mechanism relies on contact occurrence between particle and fiber. As particle size increases, the effects of impact, interception and gravity become more prominent. All the above-mentioned trapping mechanisms are affected by thickness and surface area of fibers. indicates that particle penetration in this size range was greatly affected by filter thickness, since thicker filters lead to longer times required for the airflow to pass through, thereby increasing the chance of contact between fibers and particles and resulting in a decrease in particle penetration. This also was consistent with other studies (Tian et al. Citation2016). It was our observation that, without an applied surface charge, both filter thickness and surface area affected particle penetration behavior, with filter thickness having the greater effect. However, this was only a preliminary experimental result, and further study is needed.
In addition, shows that at a filter thickness of 0.1 mm, the penetration rate of notched fibers was higher than that of smooth fibers for particles smaller than 50 nm, which was unexpected. It is speculated that this is related to the distribution of pore size in the notched fibers. When air flowed through the 0.1 mm filters, the distribution of pore sizes may have somehow affected the movement/capture of particles which also had their own size distribution. This effect was not observed in the thicker filters.
Other studies have shown that there are close relationships between fiber charge and filtration efficiency/pressure drop (Li and Jo Citation2010; Romay et al. Citation1998). shows the penetration rates of charged filters of different thicknesses. Comparing and , we were able to correlate test particle penetration rates to charge states and particle size. By fixing other factors, the charged fibers in general had better performance than uncharged filters. Adding filter thickness into the evaluation clearly showed this was also a significant factor, presumably because increasing filter thickness also increased the total charge capacity of the filter. Furthermore, a direct comparison of smooth versus notched fibers showed that the latter consistently showed lower penetration rates and thereby exhibited superior performance. This is most likely due to the higher specific surface area of the notched filter enabling higher charge densities. We observed that across the range of 0.1–0.19 mm filter thicknesses, the average penetration rates of charged smooth-fiber filters fell from 47.2 to 13.6%, and those of notched-fiber filters from 33.9 to 7.8%. The results were consistent with those of previous studies, where increases in the charge capacity facilitated better particle collection (Wang Citation2001).
Figure 8. Penetration rate of charged filters (a) 0.1 mm, (b) 0.14 mm, and (c) 0.19 mm.
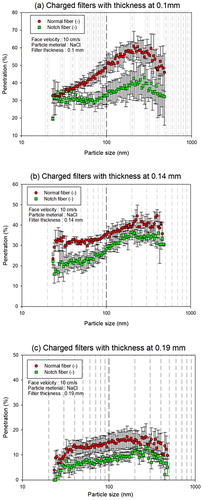
Literatures have shown that charge has a greater effect on the penetration rates of fine particles (diameter between 0.1 and 1 μm) than UFPs (Zhang et al. Citation2017). Therefore, below a certain size, Brownian diffusion becomes the main trapping mechanism, regardless of charge state. In , the data show that when test particles are smaller than 50 nm (the floor for particles to be affected by charge), fiber charge has less of an effect on particles in this size range. However, as particle size increases, there is a corresponding increase in surface area, and the amount of frictional charge generated by airflow also increases accordingly. At the same time, larger surface areas also make repulsive forces between individual charge carriers less significant, allowing the accumulated electric capacity on the surface of the particles to play a larger role and increasing the influence of the electrostatic force between the fibers and the particles. As can be seen in and , the change in penetration rates with and without filter charge became more pronounced as the particles size increased.
Comparing the smooth fiber data in and allows us to assess the solo effect of filter charging on penetration rate. Comparatively thinner filters have lower charge capacity, while this lower capacity has some effect on particles larger than 300 nm, there is no significant impact on filtration efficiency. This implies that, while simply charging a fiber filter may have a positive effect on its performance, the total charge capacitance must be high enough to be significantly useful. Examining the data for charged notched-fiber filters, shows that the increase in penetration rates of the 0.19 mm notched-fiber filter was significantly lower than for the two thinner filter thicknesses as particle sizes increased to 300 mm. We thus concluded that both fiber packing density and filter thickness had effects on the total charge capacity of the filters and therefore affected the rate of change of particle penetration rates.
Our experimental results showed that the adsorption effect of fibers in a filter on airborne particles was affected by fiber geometry (surface area and porous), filter thickness and overall charge capacity. However, this is only a preliminary result, and more data is needed to find the actual correlations between the relevant parameters and filtration efficiency.
We calculated that, most penetrating particle size (MPPS) ranges of notched fibers without and with charging were 250.3–299.6 nm and 201.7–278.8 nm respectively. The results of the MPPS size shift are summarized in . The data showed that fibers with a thickness greater than of 0.14 mm, charging the fibers had little-to-no effect. We found that geometry alone did not consistently affect MPPS and that filter charging only affected penetration rates, which was consistent with the prior cited work. However, we observed that the MPPS of notched fibers consistently shifted towards smaller sizes as both filters became thicker and charge was applied. We interpreted this finding that high charge capacity is a very important factor that affects changes in MPPS.
Table 5. The most penetrating particle size (MPPS) offset table for notched porous fibers (units: nm).
Filtration of quality factor
In addition to penetration rate, pressure drop is another important variable for evaluating filter efficiency. The quality factor is the comprehensive index of peneration rate and pressure drop. We calculated the theoretical quality factors (also known as a figure of merit, “FOM”) of the experimental filters by EquationEquation (6)(6)
(6) (Hinds Citation1999; Wang et al. Citation2008).
(6)
(6)
where qf is the quality factor; P is the penetration rate; ΔP is the change in pressure.
We used the quality factor as a method to evaluate overall filter performance, as it combines multiple crucial indicators into a single calculation. shows the quality factor curves of both charged and uncharged filters as calculated by EquationEquation (6)(6)
(6) . charts the quality factors of the uncharged filters and indicates that they’re affected by particle size (ergo, surface area). represents the performance of the charged filters over the same particle size range. The notched-fiber filters clearly performed better than the smooth-fiber filters. This is expected as notched-fibers had larger charge capacity possible due to its larger specific surface area.
Figure 9. Filtration quality of filters: (a) average quality factor of uncharged filters; (b) average quality factor of Charged filters.
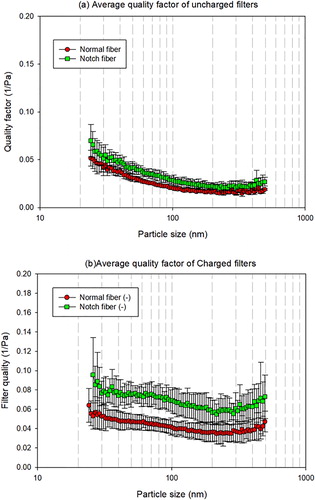
The mean quality factor of both smooth- and notched-fiber filters were compared before and after charging. The mean qf of the smooth filters increased from 0.023 to 0.042 Pa−1, and the mean qf of the notch filter also increased, jumping from 0.030 to 0.068 Pa−1. represents average qf values for different filter thicknesses. There is no significant difference between the two types of fibers at the same filter thickness when uncharged. However, the qf of all filters after charging improved significantly.
Figure 10. Average quality factor of filters of different thicknesses.
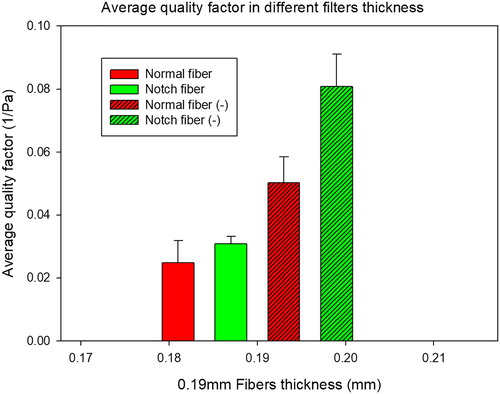
According to our results, which are summarized in and , a filter’s capacitance, thickness, and fiber surface area have the greatest impact on its performance, of filter efficiency, as measured by qf. This was consistent with previous studies (Chang et al. Citation2015). It is noted that the surface area of fiber appears to play a more significant role than fiber thickness.
Conclusions
An efficient and low-cost fiber has been produced with a new cross-sectional geometry. The performance of the new “notched” fibers on filter efficiency has been measured under a wide range of operating conditions. The results indicate that notched-fiber filters perform better than conventional filters. The overall “biased-axis” shape of the notched fiber and its porous surface features provide a larger specific surface area. The results of this study showed that notched fibers, with their larger surface areas, have higher charge capacities than conventional fibers. In addition, the notched fiber demonstrated improvements in filtration efficiency over smooth fibers by significantly decreasing the penetration rate of aerosol particles, due to its large surface area and subsequent increase in surface charge capacity. Suggested future research could continue on this path and move towards smaller-diameter (nanoscale) biased-axis fibers, find an ideal ratio of inner diameter to outer diameter, characterize the mechanical properties of notched fiber, or find other way to increase the amount of fiber surface charge.
Additional information
Funding
References
- Ahn, Y. C., S. K. Park, G. T. Kim, Y. J. Hwang, C. G. Lee, H. S. Shin, and J. K. Lee. 2006. Development of high efficiency nanofilters made of nanofibers. Curr. Appl. Phys. 6 (6):1030–1035. doi:10.1016/j.cap.2005.07.013.
- Becker, H., and C. Gärtner. 2008. Polymer microfabrication technologies for microfluidic systems. Anal. Bioanal. Chem. 390 (1):89–111. doi:10.1007/s00216-007-1692-2.
- Bhardwaj, N., and S. C. Kundu. 2010. Electrospinning: a fascinating fiber fabrication technique. Biotechnol. Adv. 28 (3):325–347. doi:10.1016/j.biotechadv.2010.01.004.
- Chang, D.-Q., S.-C. Chen, A. R. Fox, A. S. Viner, and D. Y. H. Pui. 2015. Penetration of Sub-50 nm Nanoparticles Through Electret HVAC Filters Used in Residence. Aerosol Sci. Technol. 49:966–976.
- Choi, H.-J., E.-S. Park, J.-U. Kim, S. H. Kim, and M.-H. Lee. 2015. Experimental study on charge decay of electret filter due to organic solvent exposure. Aerosol Sci. Technol. 49 (10):977–983. doi:10.1080/02786826.2015.1086724.
- Chong, K. C., S. O. Lai, W. J. Lau, H. S. Thiam, A. F. Ismail, and A. K. Zulhairun. 2017. Fabrication and characterization of polysulfone membranes coated with polydimethysiloxane for oxygen enrichment. Aerosol Air Qual. Res. 17 (11):2735–2742. doi:10.4209/aaqr.2016.12.0571.
- Chronakis, I. S. 2005. Novel nanocomposites and nanoceramics based on polymer nanofibers using electrospinning process—a review. J. Mater. Process. Technol. 167 (2–3):283–293. doi:10.1016/j.jmatprotec.2005.06.053.
- Goh, Y.-F., I. Shakir, and R. Hussain. 2013. Electrospun fibers for tissue engineering, drug delivery, and wound dressing. J. Mater. Sci. 48 (8):3027–3054. doi:10.1007/s10853-013-7145-8.
- Greiner, A., and J. H. Wendorff. 2007. Electrospinning: a fascinating method for the preparation of ultrathin fibers. Angewandte Chemie Int. 46 (30):5670–5703. doi:10.1002/anie.200604646.
- Hinds, W. C. 1999. Aerosol technology: Properties, behavior, and measurement of airborne particles. New York: John Wiley & Sons, Inc.
- Kanaoka, C., H. Emi, Y. Otani, and T. Iiyama. 1987. Effect of charging state of particles on electret filtration. Aerosol Sci. Technol. 7 (1):1–13. doi:10.1080/02786828708959142.
- Khajavi, R., and M. Abbasipour. 2012. Electrospinning as a versatile method for fabricating coreshell, hollow and porous nanofibers. Scientia Iranica 19 (6):2029–2034. doi:10.1016/j.scient.2012.10.037.
- Ko, J., N. K. Mohtaram, F. Ahmed, A. Montgomery, M. Carlson, P. C. Lee, S. M. Willerth, and M. B. Jun. 2014. Fabrication of poly (-caprolactone) microfiber scaffolds with varying topography and mechanical properties for stem cell-based tissue engineering applications. J. Biomater. Sci. Polym. 25 (1):1–17. doi:10.1080/09205063.2013.830913.
- Kong, C. S., S. G. Lee, S. H. Lee, K. H. Lee, H. S. Jo, and H. S. Kim. 2009. Multi-jet ejection and fluctuation in electrospinning of polyvinyl alcohol with various nozzle diameters. Polym. Eng. Sci. 49 (11):2286. doi:10.1002/pen.21528.
- Leung, W. W.-F., C.-H. Hung, and P.-T. Yuen. 2010. Effect of face velocity, nanofiber packing density and thickness on filtration performance of filters with nanofibers coated on a substrate. Separ Purif. Technol. 71 (1):30–37. doi:10.1016/j.seppur.2009.10.017.
- Li, K., and Y. M. Jo. 2010. Dust collection by a fiber bundle electret filter in an MVAC system. Aerosol Sci. Technol. 44 (7):578–587. doi:10.1080/02786826.2010.481227.
- Li, Y., C. T. Lim, and M. Kotaki. 2015. Study on structural and mechanical properties of porous PLA nanofibers electrospun by channel-based electrospinning system. Polymer 56:572–580. doi:10.1016/j.polymer.2014.10.073.
- Megelski, S., J. S. Stephens, D. B. Chase, and J. F. Rabolt. 2002. Micro- and nanostructured surface morphology on electrospun polymer fibers. Macromol. 35 (22):8456–8466. doi:10.1021/ma020444a.
- Nifuku, M., Y. Zhou, A. Kisiel, T. Kobayashi, and H. Katoh. 2001. Charging characteristics for electret filter materials. J. Electrostat. 51–52:200–205. doi:10.1016/S0304-3886(01)00117-6.
- Noh, K.-C., J.-H. Park, Y.-K. Jung, S. Yi, and J. Hwang. 2011. Characteristics of submicron-sized aerosol filtration and pressure drop of an electret filter installed in an air diffuser in a residential apartment unit. Aerosol Air Quality Res. 11 (1):80–89. doi:10.4209/aaqr.2010.11.0095.
- Rezvani, O., M. H. Hedeshi, and H. Bagheri. 2017. Polyamide/titania hollow nanofibers prepared by core-shell electrospinning as a microextractive phase in a fabricated sandwiched format microfluidic device. J. Chromatogr. A. 1528:1–9. doi:10.1016/j.chroma.2017.10.052.
- Romay, F. J., B. Y. H. Liu, and S.-J. Chae. 1998. Experimental study of electrostatic capture mechanisms in commercial electret filters. Aerosol Sci. Technol. 28 (3):224–234. doi:10.1080/02786829808965523.
- Saarikoski, S., K. Teinilä, H. Timonen, M. Aurela, T. Laaksovirta, F. Reyes, Y. Vásques, P. Oyola, P. Artaxo, A. S. Pennanen, S. Junttila, M. Linnainmaa, R. O. Salonen, and R. Hillamo. 2018. Particulate matter characteristics, dynamics, and sources in an underground mine. Aerosol Sci. Technol. 52 (1):114–122. doi:10.1080/02786826.2017.1384788.
- Sambudi, N. S., H.-J. Choi, M.-H. Lee, and K. Cho. 2017. Capture of ultrafine particles using a film-type electret filter with a unipolar charger. Aerosol Air Quality Res. 17 (2):626–635. doi:10.4209/aaqr.2016.03.0104.
- Shi, B., L. E. Ekberg, and S. Langer. 2013. Intermediate air filters for general ventilation applications: an experimental evaluation of various filtration efficiency expressions. Aerosol Sci. Technol. 47 (5):488–498. doi:10.1080/02786826.2013.766667.
- Shou, D., J. Fan, H. Zhang, X. Qian, and L. Ye. 2015. Filtration efficiency of non-uniform fibrous filters. Aerosol Sci. Technol. 49 (10):912–919. doi:10.1080/02786826.2015.1083092.
- Silva, P. E. S., F. Vistulo de Abreu, and M. H. Godinho. 2017. Shaping helical electrospun filaments: a review. Soft Matter. 13 (38):6678–6688. doi:10.1039/C7SM01280B.
- Sukitpaneenit, P., and T. S. Chung. 2012. High performance thin-film composite forward osmosis hollow fiber membranes with macrovoid-free and highly porous structure for sustainable water production. Environ. Sci. Technol. 46 (13):7358–7365. doi:10.1021/es301559z.
- Sun, Z., E. Zussman, A. L. Yarin, J. H. Wendorff, and A. Greiner. 2003. Compound core–shell polymer nanofibers by co-electrospinning. Adv. Mater. 15 (22):1929–1932. doi:10.1002/adma.200305136.
- Sundarrajan, S., K. L. Tan, S. H. Lim, and S. Ramakrishna. 2014. Electrospun nanofibers for air filtration applications. Procedia Eng. 75:159–163. doi:10.1016/j.proeng.2013.11.034.
- Tabti, B., L. Dascalescu, M. Plopeanu, A. Antoniu, and M. Mekideche. 2009. Factors that influence the corona charging of fibrous dielectric materials. J. Electrostat. 67 (2–3):193–197.
- Taylor, G. 1969. Electrically driven jets. Proc. R. Soc. Lond. A. 313 (1515):453–475. doi:10.1098/rspa.1969.0205.
- Teo, W. E., and S. Ramakrishna. 2006. A review on electrospinning design and nanofibre assemblies. Nanotechnology 17 (14):R89–R106. doi:10.1088/0957-4484/17/14/R01.
- Tian, L., G. Ahmadi, and J. Tu. 2016. Brownian diffusion of fibers. Aerosol Sci. Technol. 50 (5):474–486. doi:10.1080/02786826.2016.1165340.
- Wang, C.-S. 2001. Electrostatic forces in fibrous filters—a review. Powder Technol. 118 (1–2):166–170. doi:10.1016/S0032-5910(01)00307-2.
- Wang, J., S. C. Kim, and D. Y. H. Pui. 2008. Figure of merit of composite filters with micrometer and nanometer fibers. Aerosol Sci. Technol. 42 (9):722–728. doi:10.1080/02786820802249133.
- Wu, H., Y. Zheng, and Y. Zeng. 2015. Fabrication of helical nanofibers via co-electrospinning. Ind. Eng. Chem. Res. 54:987–993. doi:10.1021/ie504305s.
- Xia, Z., S. Ma, X. Qiu, Y. Wu, and F. Wang. 2003. Influence of porosity on the stability of charge and piezoelectricity for porous polytetrafluoroethylene film electrets. J. Electrostat. 59 (1):57–69. doi:10.1016/S0304-3886(03)00089-5.
- Ying, J. Y., C. P. Mehnert, and M. S. Wong. 1999. Synthesis and applications of supramolecular‐templated mesoporous materials. Angewandte Chemie Int. 38 (1–2):56–77. doi:10.1002/(SICI)1521-3773(19990115)38:1/2<56::AID-ANIE56>3.0.CO;2-E.
- Zaripov, S. K., O. V. Solov’eva, and S. A. Solov’ev. 2015. Inertial deposition of aerosol particles in a periodic row of porous cylinders. Aerosol Sci. Technol. 49 (6):400–408. doi:10.1080/02786826.2015.1036834.
- Zhang, Q., J. Quan, X. Tie, X. Li, Q. Liu, Y. Gao, and D. Zhao. 2015. Effects of meteorology and secondary particle formation on visibility during heavy haze events in Beijing, China. Sci. Total Environ. 502:578–584. doi:10.1016/j.scitotenv.2014.09.079.
- Zhang, Q., T.-Y. Yang, X. L. Si, G. R. Hu, C.-T. Chang, and F. Liu. 2017. Deciphering effects of surface charge on particle removal by TiO2 polyacrylonitrile nanofibers. Aerosol Air Qual. Res. 17 (7):1909–1916. doi:10.4209/aaqr.2016.07.0313.
- Zheng, X., X. Xu, T. A. Yekeen, Y. Zhang, A. Chen, S. S. Kim, K. N. D. Kim N. Dietrich, S.-M. Ho, S.-A. Lee, T. Reponen, and X. Huo. 2016. Ambient air heavy metals in PM2.5 and potential human health risk assessment in an informal electronic-waste recycling site of China. Aerosol Air Qual. Res. 16 (2):388–397. doi:10.4209/aaqr.2014.11.0292.