
 ?Mathematical formulae have been encoded as MathML and are displayed in this HTML version using MathJax in order to improve their display. Uncheck the box to turn MathJax off. This feature requires Javascript. Click on a formula to zoom.
Abstract
A prototype instrument was developed to measure geometric surface area (GSA) concentrations and mass or volume concentrations for agglomerated or aggregated particles at a time resolution of 1 s. It couples a diffusion charger with two sets of electrostatic precipitators and electrometers to monitor two current signals synchronously. In this way, we refined the measurements with a weighted-sum method. Initially, we tested the ability to distinguish different particle morphologies. Subsequently, theoretical volume and GSA measurements of single agglomerates and aggregates were performed to calibrate the instrumental sensitivity for particle sizes. Experimental results with polydisperse silver particles indicated that a diffusion charger coupled with a differential mobility analyzer and a condensation particle counter could identify particle shapes having different fractal dimensions. Above all, the instrument could be used to measure GSA, volume, or mass concentrations of both agglomerates and aggregates in real time. A favorable comparison with results obtained with a scanning mobility particle sizer suggested great potential for commercial applications.
Copyright © 2019 American Association for Aerosol Research
EDITOR:
1. Introduction
Particle mass concentration (MC) has received more attention than other aerosol properties, such as shape and surface area, because of its accessibility in epidemiological studies (Salvi Citation2007; Stone, Johnston, and Clift Citation2007) and its prominence in emission regulations (Amanatidis et al. Citation2016). Particle surface area is also an important factor as a biologically relevant dose metric (Schmid and Stoeger Citation2016) and for predicting health effects (Cho, Hogan, and Biswas Citation2007; Tran et al. Citation2000; Stoeger et al. Citation2006; Rabolli et al. Citation2010). Agglomerates and aggregates account for a significant proportion of mass in nature and production activities, and their complicated structures have more exposed surface areas than those of spherical particles. Here, agglomerates are defined as primary particles weakly bound by physical forces (van der Waals, capillary, or electrostatic); while aggregates are primary particles strongly bound by chemical forces (Pratsinis Citation1998). The characterization of surface area and mass concentrations of non-spherical particles holds important implications for occupational exposure to ultrafine aerosols, toxicology, and epidemiological studies.
Notwithstanding their importance, measurements of surface area concentration for agglomerates and aggregates are at an early stage of development, and real-time instrumentation is not readily available. Maynard (Citation2003) roughly estimated surface area concentration from other parameters measured with direct-reading instruments. However, this method could not be used for precise exposure measurements. Based on the theoretical model of Lall and Friedlander (Citation2006), Wang et al. (Citation2010) corrected surface area concentrations of loose nanoparticle agglomerates by combining a differential mobility analyzer (DMA) and a condensation particle counter (CPC) with a nanoparticle surface area monitor (NSAM). However, this technique was not portable, nor was it cost-effective, for field measurements. Bukowiecki et al. (Citation2002) used diffusion charging (DC) and particle counting to characterize combustion aerosols, which showed great potential for real-time monitoring. Instruments based on DC were used in field studies to measure concentrations of real-world agglomerates (Elihn and Berg Citation2009; Buonanno et al. Citation2010; Evans et al. Citation2010; Brouwer et al. Citation2009; Nurkiewicz et al. Citation2009). However, these instruments greatly underestimated geometric surface area (GSA) concentrations of silver agglomerates larger than 100 nm (Ku and Maynard Citation2005) and spherical particles larger than 900 nm in diameter (Ku Citation2009; Ku Citation2010). Fortunately, the response function of DC instruments could be adjusted to match GSA concentrations measured with an electrostatic precipitator (ESP). This correlation was confirmed in several previous studies (Wei Citation2007; Wei, Kruis and Fissan Citation2007; Fissan et al. Citation2006). Using an ESP, Cao et al. (Citation2017), Cao and Pui (Citation2018, Citation2019) developed a geometric surface area monitor to measure concentrations calibrated with a weighted-sum method. On this basis, Su et al. (Citation2019) proposed a prototype instrument for GSA concentration measurements with 1-s time resolution. However, it was only calibrated for spherical particles. To date, no instrument has been developed to measure GSA concentrations of agglomerates or aggregates in real time.
There are a few laboratory and commercial instruments available to measure MCs of agglomerates and aggregates in real time. Holve (Citation2011) demonstrated two-angle ratio scattering for real-time measurements of soot MCs, based on well-established theory. However, this method has yet to be field tested. Liu et al. (Citation2012) used a universal nanoparticle analyzer to make real-time assessments of metallic nanoparticle agglomerates produced by spark discharges; however, this instrument can at present be used only in the laboratory. Based on light scattering, the DustTrak aerosol monitor (TSI Inc., Shoreview, MN, USA), calibrated by an ISO test, was developed to measure MCs of aerosol particles. The quartz-crystal Microbalance-Moudi impactor (Model 140; TSI Inc.) also performs real-time measurements of size-segregated MCs. The impactor requires no assumptions regarding shape factor, density, or optical properties, which is a great advantage. A sufficiently portable and cost-effective instrument, such as a vehicle-mounted aerosol measurement system, is still needed to measure MCs of non-spherical particles in the field.
Here, we developed a simple prototype instrument to measure both GSA concentrations and MCs for silver agglomerates and aggregates produced by tandem tube furnaces. It has one diffusion charger, two ESPs, and two electrometers. It could be regarded as the first portable instrument for real-time measurements of non-spherical particles.
2. Theory and methodology
2.1. Agglomerates and aggregates
In contrast to the regular structure of a spherical particle, an agglomerated particle has an extremely complicated morphology that is difficult to characterize quantitatively. Fortunately, agglomerates often exhibit self-similar or fractal structures over a finite range of length scales that can be approximated by a power law (Sutherland and Goodarz-Nia Citation1971), as given in EquationEquation (1)(1)
(1) :
(1)
(1)
where M is the agglomerate mass, kf is a prefactor, Rg is the radius of gyration, dpp is the primary particle diameter, and Df is the mass fractal dimension. Rg can be measured by static light scattering (Pierre Citation1987; Wang and Sorensen Citation1999), while EquationEquation (1)
(1)
(1) can be used to obtain the mass of an agglomerate, although it cannot be used for aggregates with necking. To address this issue, an aerosol particle mass analyzer (APM) was used to directly measure the masses of both agglomerated and aggregated particles for calibration, as described in Section 3.2.
The mobility-equivalent agglomerate diameter dm and the number of primary particles npp are also crucial parameters for characterizing fractal-like agglomerates and aggregates. The dm of an agglomerate in free molecular (Meakin Citation1988) and transitional regimes (Rogak, Flagan, and Nguyen Citation1993) is equal to the diameter of a spherical particle that has the equivalent projected area of the agglomerate, as given by EquationEquation (2)(2)
(2) :
(2)
(2)
where Ap is the average projected area of a fractal-like agglomerate. Ap is related to dm and can be used to calculate npp, as shown in EquationEquation (3)
(3)
(3) :
(3)
(3)
where ap is the projected area of a primary particle. Both the coefficient
and exponent
have values extracted from numerical calculations (Medalia Citation1967; Zaitone, Schmid, and Peukert Citation2009) and experiments (Megaridis and Dobbins Citation1990; Köylü and Faeth Citation1992). In agglomerates of monodisperse primary particles, npp correlates with dpp, as given by EquationEquation (4)
(4)
(4) :
(4)
(4)
where V is the agglomerate volume. Combing EquationEquations (2)
(2)
(2) and Equation(3)
(3)
(3) with EquationEquation (4)
(4)
(4) , the average primary particle diameter and the surface area of an agglomerate can be estimated using EquationEquation (5)
(5)
(5) :
(5)
(5)
where A is the agglomerate surface area.
For aggregated particles, sintering precludes definite boundaries between constituent primary particles. Therefore, an equivalent method was proposed to calculate primary particle diameters and geometric surface areas of aggregates (Kruis et al. Citation1993; Eggersdorfer et al. Citation2012), as given by EquationEquations (6)(6)
(6) and Equation(7)
(7)
(7) :
(6)
(6)
(7)
(7)
where depp is the volume–surface equivalent primary particle diameter (surface area mean diameter), and nepp is the equivalent number of primary particles in the aggregate. EquationEquation (6)
(6)
(6) has the general form of EquationEquation (5)
(5)
(5) , making it applicable to agglomerates of spherical primary particles in point–contact. Similarly, EquationEquations (6)
(6)
(6) and Equation(7)
(7)
(7) can be combined with EquationEquations (2)
(2)
(2) and Equation(3)
(3)
(3) to characterize both the equivalent primary particle diameter (EPPD) and the surface area of an aggregated particle. Therefore, primary particle diameters and surface areas of both agglomerate and aggregate particles were calculated from EquationEquation (5)
(5)
(5) , after Eggersdorfer et al. (Citation2012).
2.2. Diffusion charging method
Numerous studies (Shin et al. Citation2010; Wang et al. Citation2010) have shown that aerosol diffusion charging is a function of particle surface area. Even if the amount of particle charge acquired during diffusion charging is not exactly proportional to the square of the particle diameter, this relationship may still be achieved by manipulating the ESP voltage (Wei Citation2007; Li et al. Citation2009; Cao et al. Citation2017; Cao and Pui Citation2018). On this basis, EquationEquation (8)(8)
(8) is obtained:
(8)
(8)
where S(dm) is the instrument sensitivity to the charged particle, and Am is the GSA of the particle having mobility diameter dm. I and CN are the induced electric current measured by the electrometer and the particle number concentration detected with a CPC, respectively. To overcome the narrow measurement range and the insufficient accuracy, two groups of sensitivities were measured simultaneously and linearly combined using a weighted-sum method. Details were reported previously (Cao and Pui Citation2018; Su et al. Citation2019). In this way, the integrated sensitivity Sw is linearly proportional to the GSA for a given particle mobility, as given by EquationEquation (9)
(9)
(9) :
(9)
(9)
where Iw is the integrated current induced by monodisperse charged particles and kw is the coefficient. U1 and U2 are the respective voltages applied to the two ESPs, as discussed in Section 4.3.2. The total GSA concentration (CA) for polydisperse particles is derived from EquationEquation (9)
(9)
(9) by additive summation:
(10)
(10)
where Iwt is the total current induced by the polydisperse charged particles.
In both room temperature diffusion-limited cluster–cluster agglomerates (DLCAs) and sintered DLCAs, particle mass concentrations should be proportional to GSA concentrations, as outlined by Maynard (Citation2003), and defined in EquationEquation (11)(11)
(11) :
(11)
(11)
where CM is the aerosol mass concentration and ds is the diameter of the average surface. Here
and CMD are particle density and count median diameter, respectively. Therefore, particle mass concentration can also be correlated to instrument sensitivity by a method similar to GSA measurements.
3. Experiments
3.1. Particle morphology measurements
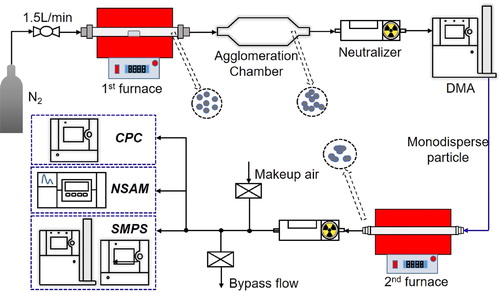
Measurements of particle morphology were performed to verify that the DMA–DC method distinguished spherical particles from agglomerates and aggregates. As shown in , compressed nitrogen was used as the carrier gas at a flow rate of 1.5 L/min at room temperature, yielding a residence time in the first furnace of 5.7 s. The temperature in the heating tube of the first furnace was 1150 °C. At this temperature, the solid silver placed in the center of the heating tube was vaporized and subsequently condensed into small nanoparticles that flowed into an agglomeration chamber for coalescence into polydisperse DLCAs. This polydisperse aerosol was introduced into a Po-210 neutralizer and a DMA (TSI 3081; TSI Inc.), where particles were classified according to their electrical mobility. The monodisperse agglomerates selected by the DMA were sintered at different temperatures to produce varied morphologies in a second furnace, as described in Kim et al. (Citation2009). Sintered particles passed through a Po-210 neutralizer to produce a Boltzmann charge distribution. By mixing this electroneutral aerosol with dry particle-free air, the aerosol flow could be split into three measurement branches. One was introduced into the NSAM (Model 3550; TSI Inc.) to charge the particles and detect the induced electric currents, while the other two branches flowed into a scanning mobility particle sizer and a CPC (Model 3776; TSI Inc.) to determine particle size distributions and number concentrations, respectively.
Figure 1. Schematic of the measurement flow path of the prototype instrument, with three lines of measurement: a scanning mobility particle sizer (SMPS), a nanoparticle surface area monitor (NSAM), and a condensation particle counter (CPC). DMA denotes differential mobility analyzer.
3.2. Mass calibration for agglomerates and aggregates
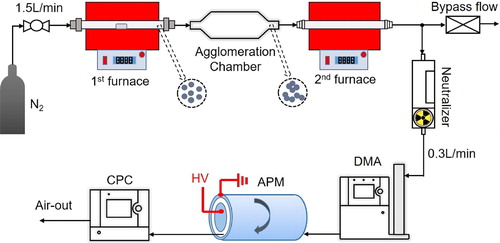
According to Eggersdorfer et al. (Citation2012), the mass of an agglomerate or aggregate for each mobility size is an important parameter to characterize with respect to the equivalent primary particle diameter and surface area. It is also extremely critical to measure the total particle mass concentration in real time. shows the apparatus used to calibrate the mass of a single agglomerate or aggregate. Tandem furnaces shown in were used to generate polydisperse silver agglomerates and aggregates that reflected variable sintering temperatures in the second furnace. This polydisperse aerosol passed through a neutralizer to obtain a Boltzmann charge distribution before entering the DMA, where it was classified as a monodisperse particle based on electrical mobility. The DMA-classified charged particles were then introduced into an APM (Model 3601; Kanomax USA, Andover, NJ, USA), where singly charged particles experienced an applied centrifugal force and an electric field force simultaneously. The rotation speed of the two concentric cylindrical electrodes in the APM was 3000 rpm. Particles with balanced forces in the APM passed through the gap between the two concentric cylindrical electrodes and flowed into the downstream CPC, which measured number concentration. More APM details are reported in Kim et al. (Citation2009).
Figure 2. Schematic of the mass calibration procedure of single agglomerates and aggregates.
3.3. Instrument sensitivity measurements
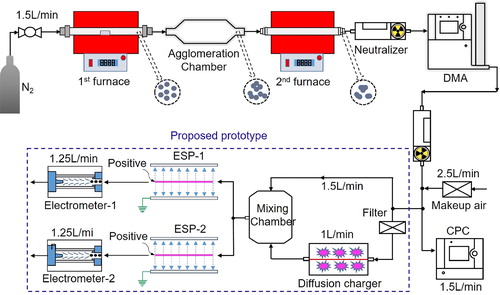
Instrument sensitivities under different ESP high voltages were calibrated to correlate with particle mass and surface area concentrations, as shown in . Agglomerate and aggregate generation and classification methods were the same as those in to reduce calibration errors. After neutralization by a Po-210 neutralizer and classification by a DMA, the monodisperse aerosol was diluted by particle-free makeup air and then split into two portions. One portion at 1.5 L/min was for the CPC to detect number concentration, while the other at 2.5 L/min entered into the prototype instrument that mainly consisted of a “corona-jet” charger (+2.5 kV), two groups of wire-tube ESPs, and filter electrometers. The charger was identical with that of the EAD, Model 3070 A or the NSAM, Model 3550 (Su et al. Citation2019). Particles acquired charge by colliding with positive ions produced in the charger, and then a 2.5 L/min aerosol flow was equally divided into two parts after the mixing chamber. Each part passed through an ESP with either a low- or a high-voltage setting, and penetrating particles flowed into the corresponding filter-electrometer. Details were reported previously (Su et al. Citation2019). Instrument sensitivities of both measurement branches were calculated as the ratio of induced electric current in each filter-electrometer to the number concentration measured by the CPC. Depending on the various voltages applied to the ESP, multi-group instrument sensitivities could be used to ensure that particle mass and surface area concentrations were correlated for a given size group.
Figure 3. Schematic of instrument sensitivity calibration.
3.4. Validation measurements
From the particle mass, surface area, and weighted sum sensitivities for each mobility size, fitting equations correlating the weighted-sum sensitivity for the two measurement objectives could be established. To validate the method, polydisperse agglomerate and aggregate aerosols were produced with various fractal dimensions. Similarly, tandem furnaces were used to generate particles with various morphologies. Polydisperse aerosols having a specific morphology were run through the instrument sequence. Meanwhile, the SMPS was used in parallel to compare results.
4. Results and discussion
4.1. Dynamic changes of monodisperse agglomerates within the sintering furnace
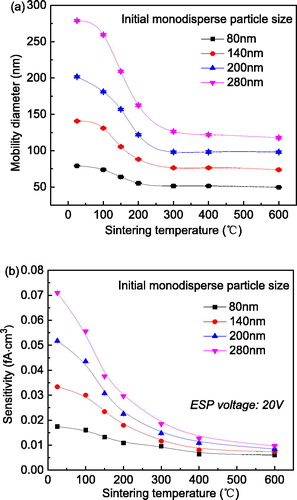
As described in Section 3.1, polydisperse agglomerates were classified using the DMA, then introduced into the second furnace to change particle morphology by sintering at various temperatures. shows the effects of particle morphology, over a range of sintering temperatures, on particle mobility and instrument sensitivity for monodisperse particles having various initial sizes. indicates that the mobility diameters of these selected particles decreased with increasing sintering temperature. This occurred because “fluffy” agglomerates become more compact at higher sintering temperatures. DeCarlo et al. (Citation2004) showed that the drag force acting on a sphere is smaller than that on a non-spherical particle with an equivalent volume or mass. Consequently, the sintered aggregate was subjected to a smaller electric force in the DMA than that for a looser agglomerate to balance the drag force, reducing the mobility diameter of the sintered aggregate according to the operational principles of the DMA. depicts the corresponding instrument sensitivity as a function of sintering temperature for various initial particle sizes selected by the DMA. For certain sizes, the sensitivity decreased with increasing sintering temperature (Shin et al. Citation2010; Cao et al. Citation2015), showing similar changes to those for the mobility diameter in . An agglomerate could capture more ions in a unipolar charger than an aggregate or a spherical particle, and be reflected in the digital reading of the downstream electrometer. Therefore, DC is a powerful way to differentiate particle morphology when coupled with instrument sensitivity.
Figure 4. Effects of sintering temperature on (a) mobility diameter and (b) instrument sensitivity of monodisperse agglomerates resulting from charged agglomerates.
4.2. Particle volume and geometric surface area calibration
The mass of a single agglomerate or aggregate can be calculated from EquationEquation (12)(12)
(12) , using the apparatus described in Section 3.2:
(12)
(12)
where q, u, r1, r2, r3, and
are the charge carried, the voltage applied to the inner electrode, the radius of the inner electrode, the radius of the outer electrode, the average of r1 and r2, and the rotation frequency of the two concentric cylindrical electrodes of the APM, respectively. The volume of the particle in each mobility size selected by the DMA was obtained from the known particle density of 10.5 g/cm3. Therefore, the equivalent primary particle diameter and surface area of each selected particle could be calibrated to correlate with the instrument sensitivity, as discussed in Sections 4.2.2 and 4.3.
4.2.1. Agglomerate and aggregate volume calibration
The volumes of single agglomerate and aggregate particles as a function of mobility size are shown in .
Figure 5. Volume of a single particle for different sintering temperatures and mobility sizes.
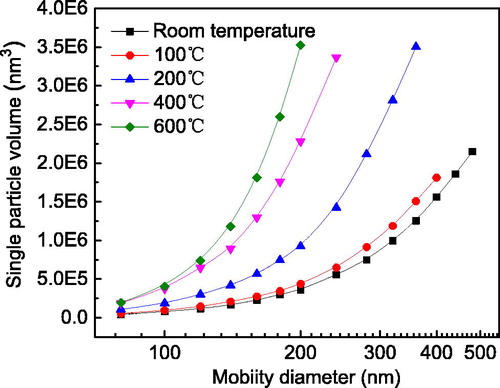
At room temperature, when agglomerates have no necking features, the volume of a single agglomerate is significantly smaller than at high sintering temperatures for the same mobility diameter. In fact, the volume for one sintered at 600 °C is an order of magnitude larger than that of one having the same mobility diameter at room temperature. This is mainly because an agglomerate has more void space within its structure than a dense spherical particle of the same mobility diameter, reducing both agglomerate mass and volume. The curves for different sintering temperatures shown in were fit with power laws. Therefore, the particle volume for any discrete size could be calculated.
4.2.2. Agglomerate and aggregate surface area calibration
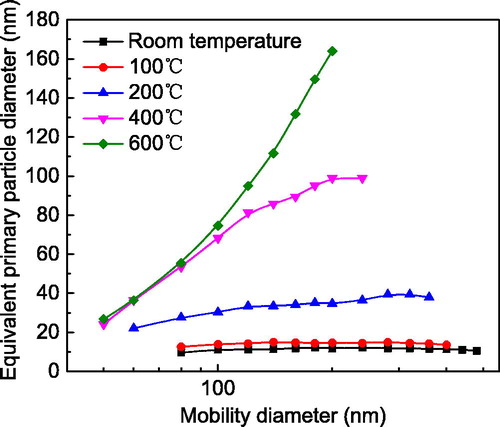
Based on the particle volume calculated in Section 4.2.1, the EPPD of a single particle under different conditions was calculated from EquationEquation (5)(5)
(5) , as shown in . The EPPD increased variably with sintering temperature, reflecting the effects of particle volume at high sintering temperature in EquationEquation (5)
(5)
(5) . From room temperature to 100 °C, the EPPD was almost constant with increasing mobility diameter, attributed to a low level of necking. This was consistent with previous observations (Cho and Biswas Citation2006). However, at the higher temperatures of intermediate and late sintering stages (Koch and Friedlander Citation1990; Seto et al. Citation1997), significant necking occurs between primary particles, which can increase the EPPD of agglomerates and aggregates having many primary particles. In contrast to the initial stage of sintering, the EPPD calibration now depended on examining neck growth. The two stages of sintering also produce variations in porosity or density (Coble Citation1961; Coleman and Beere Citation1975; Cho and Biswas Citation2006). When fully sintered at ∼600 °C (), an agglomerate of many primary particles can coalesce into a dense sphere, with a diameter equaling the EPPD.
Figure 6. Equivalent primary particle diameter of a single particle at various sintering temperatures and mobility sizes.
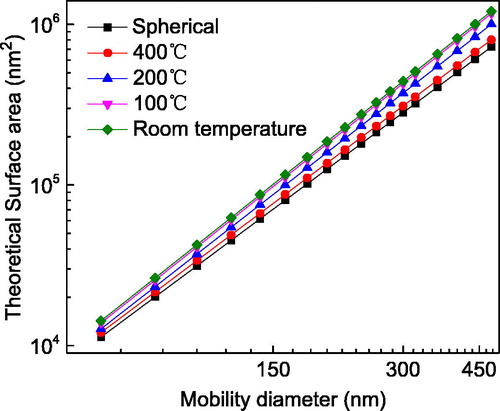
According to Eggersdorfer et al. (Citation2012), the GSA of a single particle for each mobility size and shape can be computed once the EPPD and particle volume are known. depicts the theoretical GSA of a single particle as a function of particle mobility size for different particle shapes. The GSA of an agglomerate at room temperature is significantly larger than those of an aggregate and a sphere after high-temperature sintering. This is mainly because of free energy minimization during sintering (Eggersdorfer et al. Citation2011). Therefore, the theoretical volume and GSA of a single particle under different conditions can be acquired, providing further correlation and validation of the proposed method.
Figure 7. Theoretical surface areas of a single particle at different sintering temperatures and mobility sizes.
4.3. Correlating particle volume and geometric surface area with instrument sensitivity
4.3.1. Effects of the second electrostatic precipitator voltage on instrument sensitivity
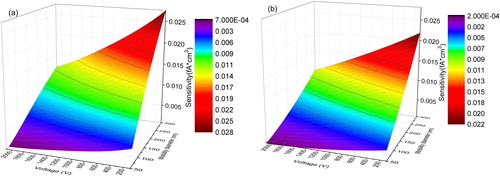
Instrument sensitivities as a function of mobility size and the voltage applied to the second ESP was determined with the apparatus described in Section 3.3, and are shown in and for particles produced at room temperature and those sintered at 400 °C in the second furnace, respectively. At certain voltages, the sensitivity increased with mobility diameter because more gas ions could attach to the surfaces of larger particles in the ion-jet charger. At higher voltages, less-charged particles penetrated through to the second ESP, reducing the sensitivity to a level lower than that measured at lower voltages. In contrast, the sensitivity for slightly sintered agglomerates was greater than that for heavily sintered aggregates under identical conditions, suggesting that particle morphology does affect particle charging within the diffusion charger (Chang Citation1981; Wang et al. Citation2010; Shin et al. Citation2010; Cao et al. Citation2015).
Figure 8. Three-dimensional plot of instrument sensitivity at different voltages of the second electrostatic precipitator and various mobility sizes. (a) Particles prepared at room temperature (agglomerates) and (b) sintered at 400 °C (aggregates).
4.3.2. Curve fitting
Previous studies demonstrated that the slope of sensitivity with mobility size could be manipulated by adjusting the high voltage (Cao et al. Citation2017; Li, Chen and Tsai Citation2009; Wei Citation2007). Therefore, variations of instrument sensitivities with mobility size for different ESP voltages were fit to power laws, requiring larger powers for higher voltages. At room temperature, a power of 1.06 defined the relationship for ESP operation at 20 V, while it increased to 1.61 for operation at 2100 V. Voltages higher than 2100 were not used to prevent arcing of the electric field within the second ESP. Similarly, the curves in and could also be fit as power laws (Sorensen Citation2011). Exponent values of 2.26 and 2.13 described the variation of particle volume and GSA with mobility size for agglomerates at room temperature, respectively. A comparison of these powers indicates that there is a large gap between instrument sensitivity at high voltage and volume or GSA. Therefore, regardless of the applied voltage, one sensitivity group could not be well-correlated with the agglomerate volume and GSA. To enhance correlation, the weighted-sum method after Cao and Pui (Citation2018) was used to correlate the combined sensitivity with the two measurement objectives.
Two voltages were selected to combine the corresponding sensitivities of the two groups into a linear model. A 20 V level was used to remove excess ions and ensure a high signal-to-noise ratio (Cao and Pui Citation2018; Su et al. Citation2019). Two critical aspects were considered in setting the high voltage level. First, the higher voltage corresponds to a larger power exponent to ensure better fitting. Second, for low concentrations, a sufficiently high signal-to-noise ratio for each testing size should be guaranteed. At room temperature, agglomerates could acquire more charge in the diffusion charger, producing a quantifiable current signal for each particle size (75–300 nm), even though 2100 V was applied to the upstream ESP. However, at voltages higher than 2100 V, there was an extremely weak signal, especially for particles smaller than 100 nm. Therefore, 2100 V was the upper bound for the desired size accuracy. Two groups of instrument sensitivities at selected voltages were then linearly combined using a bivariate regression analysis to match the two measurement objectives. Corresponding equations fitting the combined sensitivity values with the theoretical volume and GSA of agglomerates are given in EquationEquations (13)(13)
(13) and Equation(14)
(14)
(14) , respectively:
(13)
(13)
(14)
(14)
where Vm is the volume of a single agglomerate or aggregate having mobility diameter dm, and
and
are fitting coefficients with values of 8 × 10⁻⁷/(fA·cm), −1.77 × 10⁻⁷/(fA·cm), 1.09 × 10⁻¹³/fA, and −2.76 × 10⁻¹⁴/fA, respectively. S1 and S2 are the instrument sensitivities for the voltages of 2100 V and 20 V, respectively. The R2 and P value for EquationEquation (13)
(13)
(13) were 0.99 and 5.98 × 10⁻¹⁰, respectively, while those for EquationEquation (14)
(14)
(14) were 0.986 and 1.69 × 10⁻⁶. Therefore, the fitting equations enabled real-time measurements of GSA and volume concentrations. Agglomerate volumes and GSAs acquired from EquationEquations (13)
(13)
(13) and Equation(14)
(14)
(14) were compared with theoretical values from Eggersdorfer et al. (Citation2012), as shown in . For all discrete sizes, average deviations for the volume and GSA values were both less than 10%, suggesting great potential for applications to a continuous size range.
Figure 9. Comparisons of fitted values for particle volumes and geometric surface areas (GSAs) with theoretical values from Eggersdorfer et al. (Citation2012). Results for particles (a) prepared at room temperature (agglomerates) and (b) sintered at 400 °C (aggregates).
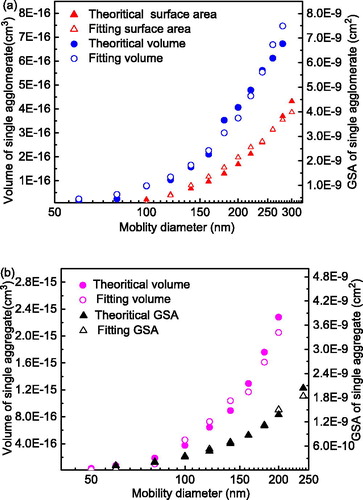
In the case of sintering at 400 °C, primary particles coalesced into dense spheres that carried less charge. Because of a tradeoff between measurement sensitivity and accuracy, the highest voltage was 1500 V for the size range (50–230 nm). The fitting equations for the combined sensitivity in this case were given by EquationEquations (15)(15)
(15) and Equation(16)
(16)
(16) :
(15)
(15)
(16)
(16)
where
and
were 3.5 × 10⁻⁷/(fA·cm), −5.16 × 10⁻⁸/(fA·cm), 5.27 × 10⁻¹³/fA, and −8.52 × 10⁻¹⁴/fA, respectively. The R2 and P values for EquationEquation (15)
(15)
(15) were 0.998 and 2.65 × 10⁻⁸, respectively, and 0.98 and 4.22 × 10⁻⁶ for EquationEquation (16)
(16)
(16) . Thus, fitted volume and GSA values for aggregates were calculated and compared with theoretical values from Eggersdorfer et al. (Citation2012), as shown in . and indicated a good capability in measuring particles of different shapes.
4.4. Validation
Polydisperse silver agglomerates and aggregates were produced to test the prototype instrument. In addition, a SMPS assembled in parallel was used as a reference.
4.4.1. Volume concentration validation
From EquationEquations (14)(14)
(14) and Equation(16)
(16)
(16) , volume concentrations of polydisperse agglomerates and aggregates were calculated from linearly combined electric currents measured with the two electrometers in the parallel downstream ESPs, as shown in and , respectively. In both cases, polydisperse silver particles having various fractal dimensions were diluted to produce various concentrations. At room temperature, the geometric mean diameter and geometric standard deviation for all the particle size distributions were 91.5 and 1.72 nm, respectively, and 57.4 and 1.50 nm at the sintering temperature of 400 °C. The volume concentrations were measured simultaneously by the parallel SMPS, requiring about 130 s for a full scan. Therefore, the GSAC readings of the prototype instrument were averaged within this scan-time window to compare them with the SMPS results (). The variation in volume concentrations measured by the prototype instrument and the SMPS were identical. However, the absolute volume concentrations measured by the prototype instrument were initially underestimated relative to those measured by the SMPS. This may have reflected two assumptions. The particle number distribution was first measured by the SMPS, and then converted to a particle volume concentration by assuming spherical particles for each size bin. At the same mobility diameter, the volume of a spherical particle is significantly larger than that of a non-spherical particle, especially in the case of an agglomerate without necking. This was verified in . The SMPS could only detect particles within the size range 7.91–310.6 nm, causing a slight negative deviation. This was a secondary assumption compared with the first, which made the SMPS results consistently greater than the volume concentrations measured by the prototype instrument.
Figure 10. Comparisons of volume concentrations of polydisperse silver particles (a) prepared at room temperature (agglomerates) and (b) sintered at 400 °C (aggregates).
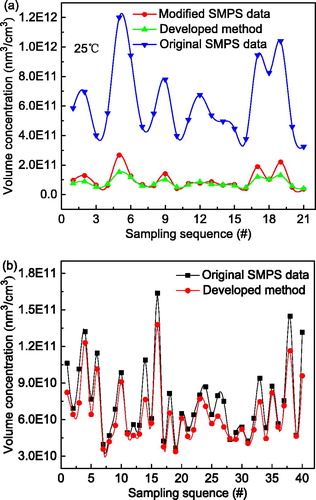
Because of these errors, the raw SMPS data were modified. First, the SMPS number concentration for each particle size was multiplied by the corresponding agglomerate or aggregate volume given in Section 2.1 to obtain the volume concentration at each size. Then the total concentration was obtained by algebraically adding volume concentrations at each size over the detection range. Contributions by “over-sized” particles were estimated because of the assumed lognormal distribution in the volume distribution curve (Su et al. Citation2019). In , the SMPS results after correction were mostly consistent with those of the prototype instrument, with an average deviation less than 10%. In the case of sintering at 400 °C, agglomerates formed almost spherical compact particles, producing no significant differences between the two methods. In general, the method developed here shows great potential to measure volume concentrations of non-spherical particles with a time resolution of 1 s.
4.4.2. Geometric surface area concentration validation
Polydisperse agglomerates and aggregates were produced at different sintering temperatures and diluted to various concentrations to validate the capability of the prototype instrument for GSAC measurements. The GSAC values obtained from EquationEquations (13)(13)
(13) and Equation(15)
(15)
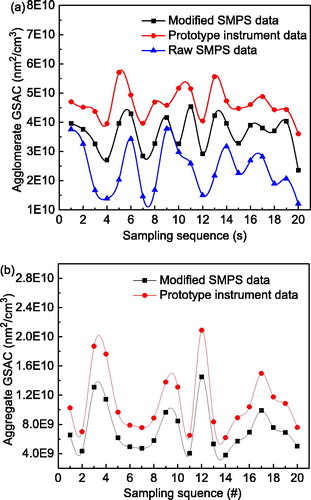
(15) and compared with the SMPS results in and , respectively. The variation in GSACs measured with the prototype instrument trended in a similar way to the SMPS simultaneous results, even though there were non-negligible differences in the values. After applying the correction procedure outlined above, the SMPS results were in accord with those of the prototype instrument. Differences were narrowed considerably, yielding an average deviation of less than 30% between the two methods. Larger errors occurred in the GASC measurements relative to those for volume concentrations because there were more complicated factors affecting the agglomerate and aggregate surface areas, including primary particle sizes and spatial configurations of the agglomerates. Despite the errors, the developed method provided promising GSAC measurements of agglomerates and aggregates at a time resolution of 1 s.
Figure 11. Comparisons of geometric surface area concentrations (GSACs) of polydisperse silver particles. Particles (a) prepared at room temperature (agglomerates) and (b) sintered at 400 °C (aggregates).
4.5. Advantages, limitations, and comparisons
There was significant improvement in real time measurements of non-spherical particle GSACs and volume concentrations relative to previous studies focused on spherical particles (Cao and Pui Citation2018; Su et al. Citation2019). The prototype instrument is also portable and cost-effective, with promising field applications, such as GSAC measurements of soot particles produced by vehicles.
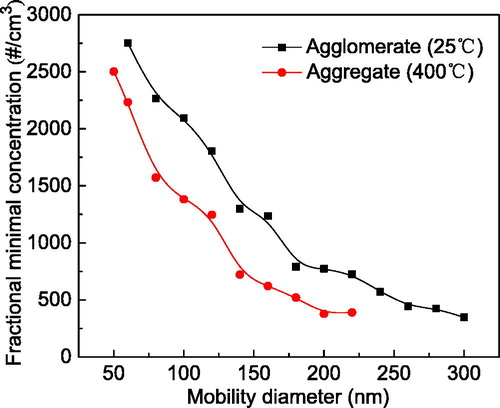
Limitations worth refining include explicit identification of particle morphologies in some instances before measurements are performed, given that each particle shape corresponds to a respective fitting equation. Second, calibrations over a wider particle size range and multiple agglomeration mechanisms should be identified to establish a reference database. Finally, this method is currently restricted to a minimum detectable concentration because of the limits imposed by the electrometers ().
Figure 12. Fractional minimal concentrations over the detected size range.
Compared with other instruments, such as the Aerotrak (Model 9000; TSI Inc.) and the electrical aerosol detector (EAD; Model 3070 A, TSI Inc.), which are capable of measuring only lung-deposited surface area (LDSA) concentrations of spherical particles, the prototype instrument can measure both GSACs and volume concentrations of agglomerates and aggregates. In addition, the measurement accuracy is not less than that of LDSA monitors, which are generally ±20%–30% (Todea et al. Citation2015).
5. Conclusions
GSACs and volume/mass concentrations for both agglomerates and aggregates were measured using a prototype instrument based on diffusion charging. A diffusion charger and two groups of ESPs and electrometers were used for measurements at a time resolution of 1 s over a large particle size range. The DC method was capable of identifying particle morphology by using a coupled DMA and CPC. Particle volume and GSA measurements of single agglomerates and aggregates were calibrated to correlate with instrument sensitivity at different ESP voltages. Once validated, this method was used to measure volume and GSA concentrations of polydisperse silver particles at different concentrations. The results were compared with simultaneous SMPS measurements and demonstrated that the method has great potential to quantify GSACs and volume/mass concentrations of both agglomerates and aggregates. The average differences for the volume concentrations and GSAC between the two methods were respectively less than 10% and 30% over the tested particle size range. Future work will focus on improving measurement accuracy and establishing a reference database.
| Nomenclature | ||
| APM | = | aerosol particle mass analyzer |
| CMD | = | count median diameter |
| CPC | = | condensation particle counter |
| DC | = | diffusion charging |
| DLCA | = | diffusion limited cluster-cluster agglomerates |
| DMA | = | differential mobility analyzer |
| EAD | = | electrical aerosol detector |
| EPPD | = | equivalent primary particle diameter |
| ESP | = | electrostatic precipitator |
| GSA | = | geometric surface area |
| GSAC | = | geometric surface area concentration |
| LDSA | = | lung-deposited surface area |
| MC | = | mass concentration |
| NSAM | = | nanoparticle surface area monitor |
| SMPS | = | scanning mobility particle sizer |
Acknowledgments
The authors thank the following member companies of the Center for Filtration Research for their support: 3M Corporation, A.O. Smith Company, Applied Materials, Inc., BASF Corporation, Boeing Company, Corning Co., China Yancheng Environmental Protection Science and Technology City, Cummins Filtration Inc., Donaldson Company, Inc., Entegris, Inc., Ford Motor Company, Guangxi Wat Yuan Filtration System Co., Ltd, MSP Corporation; Samsung Electronics Co., Ltd., Xinxiang Shengda Filtration Technology Co., Ltd., TSI Inc., W. L. Gore & Associates, Inc., and Shigematsu Works Co., Ltd. The authors likewise thank the Center’s affiliate member, the National Institute for Occupational Safety and Health (NIOSH).
Disclosure statement
No potential conflict of interest was reported by the authors.
Additional information
Funding
References
- Amanatidis, S., M. M. Maricq, L. Ntziachristos, and Z. Samaras. 2016. Measuring number, mass, and size of exhaust particles with diffusion chargers: the dual pegasor particle sensor. J. Aerosol Sci. 92:1–15. doi:10.1016/j.jaerosci.2015.10.005.
- Brouwer, D., B. V. Duuren-Stuurman, M. Berges, E. Jankowska, D. Bard, and D. Mark. 2009. From workplace air measurement results toward estimates of expourse? Development of a strategy to assess exposure to manufactured nano-objects. J. Nanoparticle Res. 11 (8):1867–1881. doi:10.1007/s11051-009-9772-1.
- Bukowiecki, N., D. B. Kittelson, W. F. Watts, H. Burtscher, E. Weingartner, and U. Baltensperger. 2002. Real-time characterization of ultrafine and accumulation mode particles in ambient combustion aerosols. J. Aerosol Sci. 33 (8):1139–1154. doi:10.1016/S0021-8502(02)00063-0.
- Buonanno, G., L. Morawska, L. Stabile, and A. Viola. 2010. Exposure to particle number, surface area and PM concentrations in pizzerias. Atmospheric Environ. 44 (32):3963–3969. doi:10.1016/j.atmosenv.2010.07.002.
- Cao, L. N. Y., and D. Y. H. Pui. 2018. A novel weighted sum method to measure particle geometric surface area in real-time. J. Aerosol Sci. 117:11–23. doi:10.1016/j.jaerosci.2017.12.007.
- Cao, L. N. Y., and D. Y. H. Pui. 2019. Real-time measurements of particle geometric surface area by the weighted sum method on a university campus. J. Aerosol Sci. doi:10.1016/j.jaerosci.2017.12.007.
- Cao, L. N. Y., J. Wang, H. Fissan, S. E. Pratsinis, M. L. Eggersdorfer, and D. Y. H. Pui. 2015. The capacitance and charge of agglomerated nanoparticles during sintering. J. Aerosol Sci. 83:1–11. doi:10.1016/j.jaerosci.2015.01.002.
- Cao, L. N. Y., S. C. Chen, H. Fissan, C. Asbach, and D. Y. H. Pui. 2017. Development of a geometric surface area monitor (GSAM) for aerosol nanoparticles. J. Aerosol Sci. 114:118–129. doi:10.1016/j.jaerosci.2017.09.013.
- Chang, J. S. 1981. Theory of diffusion charging of arbitrarily shaped conductive aerosol particles by unipolar ions. J. Aerosol Sci. 12 (1):19–26. doi:10.1016/0021-8502(81)90006-9.
- Cho, K., C. J. Hogan, and P. Biswas. 2007. Study of the mobility, surface area, and sintering behavior of agglomerates in the transition regime by tandem differential mobility analysis. J. Nanoparticle Res. 9 (6):1003–1012. doi:10.1007/s11051-007-9243-5.
- Cho, K., and P. Biswas. 2006. A geometrical sintering model (GSM) to predict surface area change. J. Aerosol Sci. 37 (10):1378–1387. doi:10.1016/j.jaerosci.2005.11.007.
- Coble, R. L. 1961. Sintering crystalline solids. I. Intermediate and final state diffusion models. J. Appl. Phys. 32 (5):787–792. doi:10.1063/1.1736107.
- Coleman, S. C., and W. B. Beere. 1975. The sintering of open and closed porosity in UO2. Philosoph. Mag. 31 (6):1403–1413. doi:10.1080/00318087508228691.
- DeCarlo, P. F., J. G. Slowik, D. R. Worsnop, P. Davidovits, and J. L. Jimenez. 2004. Particle morphology and density characterization by combined mobility and aerodynamic diameter measurements. Part 1: theory. Aerosol Sci. Technol. 38 (12):1185–1205. doi:10.1080/027868290903907.
- Eggersdorfer, M. L., D. Kadau, H. J. Herrmann, and S. E. Pratsinis. 2012. Aggregate morphology evolution by sintering: number and diameter of primary particles. J. Aerosol Sci. 46:7–19. doi:10.1016/j.jaerosci.2011.11.005.
- Eggersdorfer, M. L., D. Kadau, H. J. Herrmann, and S. E. Pratsinis. 2011. Multiparticle sintering dynamics: from Fractal-Like aggregates to compact structures. Langmuir 27 (10):6358–6367. doi:10.1021/la200546g.
- Elihn, K., and P. Berg. 2009. Ultrafine particle characteristics in seven industrial plants. Ann. Occupational Hyginen 53 (5):475–484. doi:10.1093/annhyg/mep033.
- Evans, D. E., B. K. Ku, M. E. Birch, and K. H. Dunn. 2010. Aerosol monitoring during carbon nanofiber production: mobile direct-reading sampling. Ann. Occupational Hygiene 54 (5):514–531. doi:10.1093/annhyg/meq015.
- Fissan, H., S. Neumann, A. Trampe, D. Y. H. Pui, and W. G. Shin. 2006. Rationale and principle of an instrument measuring lung deposited nanoparticle surface area. J. Nanoparticle Res. 9 (1):53–59. doi:10.1007/s11051-006-9156-8.
- Holve, D. J. 2011. Two-Angle ratio scattering (STAR) method for real-time measurement of agglomerate soot concentration and size: Theory. Aerosol Sci. Technol. 45 (11):1388–1399. doi:10.1080/02786826.2011.596172.
- Kim, S. C., J. Wang, M. S. Emery, W. G. Shin, G. W. Mulholland, and D. Y. H. Pui. 2009. Structural property effect of nanoparticle agglomerates on particle penetration through fibrous filter. Aerosol Sci. Technol. 43 (4):344–355. doi:10.1080/02786820802653763.
- Koch, W., and S. K. Friedlander. 1990. The effect of particle coalescence on the surface-area of a coagulating aerosol. J. Colloid Interface Sci. 140 (2):419–427. doi:10.1016/0021-9797(90)90362-R.
- Kruis, F. E., K. A. Kusters, S. E. Pratsinis, and B. Scarlett. 1993. A simple model for the evolution of the characteristics of aggregate particles undergoing coagulation and sintering. Aerosol Sci. Technol. 19 (4):514–526. doi:10.1080/02786829308959656.
- Ku, B. K. 2010. Determination of the ratio of diffusion charging-based surface area to geometric surface area for spherical particles in the size range of 100–900 nm. J. Aerosol Sci. 41 (9):835–847. doi:10.1016/j.jaerosci.2010.05.008.
- Ku, B. K. 2009. Diffusion charger-based aerosol surface-area monitor response to airborne spherical particles 100–800 nm in diameter. In Proceedings of the Abstracts of the 4th International Conference on Nanotechnology—Occupational and Environmental Health, Helsinki, Finland.
- Ku, B. K., and A. D. Maynard. 2005. Comparing aerosol surface-area measurements of monodisperse ultrafine silver agglomerates by mobility analysis, transmission electron microscopy and diffusion charging. J. Aerosol Sci. 36 (9):1108–1124. doi:10.1016/j.jaerosci.2004.12.003.
- Köylü, Ü. Ö., and G. M. Faeth. 1992. Structure of overfire soot in buoyant turbulent diffusion flames at long residence times. Combustion Flame 89 (2):140–156. doi:10.1016/0010-2180(92)90024-J.
- Lall, A. A., and S. K. Friedlander. 2006. On-Line measurement of ultrafine aggregate surface area and volume distributions by electrical mobility analysis: I. Theoretical analysis. J. Aerosol Sci. 37 (3):260–271. doi:10.1016/j.jaerosci.2005.05.021.
- Li, L., D. R. Chen, and P. J. Tsai. 2009. Use of an electrical aerosol detector (EAD) for nanoparticle size distribution measurement. J. Nanoparticle Res. 11 (1):111–120. doi:10.1007/s11051-008-9418-8.
- Liu, Z., S. C. Kim, J. Wang, W. G. Shin, H. Fissan, and D. Y. H. Pui. 2012. Measurement of metal nanoparticle agglomerates generated by spark discharge using the universal nanoparticle analyzer (UNPA). Aerosol Sci. Technol. 46 (3):333–346. doi:10.1080/02786826.2011.626002.
- Maynard, A. D. 2003. Estimating aerosol surface area from number and mass concentration measurement. Ann. Occupational Hygiene 47 (2):123–144. doi:10.1093/annhyg/meg022.
- Meakin, P. 1988. Fractal aggregates. Adv. Colloid Interface Sci. 28 (4):249–331.
- Medalia, A. I. 1967. Morphology of aggregates: I. Calculation of shape and bulkiness factors; application to computer-simulated random flocs. J. Colloid Interface Sci. 24 (3):393–404. doi:10.1016/0021-9797(67)90267-6.
- Megaridis, C. M., and R. A. Dobbins. 1990. Morphological description of flame-generated materials. Combustion Sci. Technol. 71 (1–3):95–109. doi:10.1080/00102209008951626.
- Nurkiewicz, T. R., D. W. Porter, A. F. Hubbs, S. Stone, B. T. Chen, D. G. Frazer, M. A. Boegehold, and V. Castranova. 2009. Pulmonary nanoparticle exposure disrupts systemic microvascular nitric oxide signaling. Toxicol. Sci. 110 (1):191–203. doi:10.1093/toxsci/kfp051.
- Pierre, W. 1987. Hydrodynamic behavior of fractal aggregates. Physical Rev. Lett. 58 (7):710–713.
- Pratsinis, S. E. 1998. Flame aerosol synthesis of ceramic powders. Progress Energy Combustion Sci. 24 (3):197–219. doi:10.1016/S0360-1285(97)00028-2.
- Rabolli, V., L. C. J. Thomassen, C. Princen, D. Napierska, L. Gonzalez, M. Kirsch-Volders, P. H. Hoet, F. Huaux, C. E. A. Kirschhock, J. A. Martens, and D. Lison. 2010. Influence of size, surface area and microporosity on the in vitro cytotoxic activity of amorphous silica nanoparticles in different cell types. Nanotoxicology 4 (3):307–318. doi:10.3109/17435390.2010.482749.
- Rogak, S. N., R. C. Flagan, and H. V. Nguyen. 1993. The mobility and structure of aerosol agglomerates. Aerosol Sci. Technol. 18 (1):25–47. doi:10.1080/02786829308959582.
- Salvi, S. 2007. Health effects of ambient air pollution in children. Paediatr. Resp. Rev. 8 (4):275–280. doi:10.1016/j.prrv.2007.08.008.
- Schmid, O., and T. Stoeger. 2016. Surface area is the biologically most effective dose metric for acute nanoparticle toxicity in the lung. J. Aerosol Sci. 99:133–143. doi:10.1016/j.jaerosci.2015.12.006.
- Seto, T., A. Hirota, T. Fujimoto, M. Shimada, and K. Okuyama. 1997. Sintering of polydisperse nanometer-sized agglomerates. Aerosol Sci. Technol. 27 (3):422–438. doi:10.1080/02786829708965482.
- Shin, W. G., J. Wang, M. Mertler, B. Sachweh, H. Fissan, and D. Y. H. Pui. 2010. The effect of particle morphology on unipolar diffusion charging of nanoparticle agglomerates in the transition regime. J. Aerosol Sci. 41 (11):975–986. doi:10.1016/j.jaerosci.2010.07.004.
- Sorensen, C. M. 2011. The mobility of fractal aggregates: a review. Aerosol Sci. Technol. 45 (7):765–779. doi:10.1080/02786826.2011.560909.
- Stoeger, T., C. Reinhard, S. Takenaka, A. Schroeppel, E. Karg, B. Ritter, J. Heyder, and H. Schulz. 2006. Instillation of six different ultrafine carbon particles indicates a surface area threshold dose for acute lung inflammation in mice. Environ. Health Persp. 114 (3):328–333. doi:10.1289/ehp.8266.
- Stone, V., H. Johnston, and M. J. D. Clift. 2007. Air pollution, ultrafine and nanoparticle toxicology: cellular and molecular interactions. IEEE Trans. Nanobiosci. 6 (4):331–340. doi:10.1109/TNB.2007.909005.
- Su, L., Q. Ou, L. N. Y. Cao, Q. Du, and D. Y. H. Pui. 2019. A new instrument prototype to measure the geometric surface area of nanoparticles with a time resolution of 1s. J. Aerosol Sci. 132:32–43. doi:10.1016/j.jaerosci.2019.03.007.
- Sutherland, D. N., and I. Goodarz-Nia. 1971. Floc simulation: the effect of collision sequence. Chem. Eng. Sci. 26 (12):2071–2085. doi:10.1016/0009-2509(71)80045-3.
- Todea, A. M., S. Beckmann, H. Kaminski, and C. Asbach. 2015. Accuracy of electrical aerosol sensors measuring lung deposited surface area concentrations. J. Aerosol Sci. 89:96–109. doi:10.1016/j.jaerosci.2015.07.003.
- Tran, C. L., D. Buchanan, R. T. Cullen, A. Searl, A. D. Jones, and K. Donaldson. 2000. Inhalation of poorly soluble particles. II. Influence of particle surface area on inflammation and clearance. Inhalation Toxicol. 12 (12):1113–1126.
- Wang, G. M., and C. M. Sorensen. 1999. Diffusive mobility of fractal aggregates over the entire knudsen number range. Physical Rev. E 60 (3):3036–3044. doi:10.1103/PhysRevE.60.3036.
- Wang, J., W. G. Shin, M. Mertler, B. Sachweh, H. Fissan, and D. Y. H. Pui. 2010. Measurement of nanoparticle agglomerates by combined measurement of electrical mobility and unipolar charging properties. Aerosol Sci. Technol. 44 (2):97–108. doi:10.1080/02786820903401427.
- Wei, J. M. 2007. Development of a method for measuring surface area concentration of ultrafine particles. Ph.D. Thesis, University Duisburg-Essen, Germany.
- Wei, J. M., F. E. Kruis, and H. Fissan. 2007. A method for measuring surface area concentration of ultrafine particles. In Proceedings of European Aerosol Conference, Salzburg.
- Zaitone, B. A., H. J. Schmid, and W. Peukert. 2009. Simulation of structure and mobility of aggregates formed by simultaneous coagulation, sintering and surface growth. J. Aerosol Sci. 40 (11):950–964. doi:10.1016/j.jaerosci.2009.08.007.