
Abstract
Laser derivatization is proposed as a diagnostic technique toward identifying the sources contributing to combustion produced soot. Fuel chemistry and the resultant oxygen content in nascent soot have been shown to influence the evolution of soot nanostructure upon laser derivatization. This is illustrated using the spectroscopic and microscopic characterization of biodiesel soot, with a systematic variation in fuel chemistry used to generate the soot. Functionalized carbon black is used as the control to independently verify the influence of material chemistry on nanostructure upon laser heat treatment. Results track with those observed for biodiesel soot. Reciprocally, the similarity in soot nanostructure observed after laser heating is tied to the likeness in fuel chemistry of biomass-fueled sources. Understanding the origin of differences or similarities in soot nanostructure upon laser heat treatment can help differentiate sources based on their contribution, thereby aiding in effective air quality control.
Copyright © 2019 American Association for Aerosol Research
EDITOR:
1. Introduction
Soot is an unwanted byproduct of combustion emitted by industrial, power generation, and transportation sectors (US EPA Citation2018b). Of this emitted particulate matter (PM), small particles with diameters <2.5 µm (PM2.5) or even <0.1 µm (PM0.1) (The Interprofessional Technical Centre for Studies on Air Pollution (CITEPA) Citation2017), can transport to seemingly distant areas (Muleski, Cowherd, and Kinsey Citation2005; Kinsey et al. Citation2007). These emissions have been directly linked to health and environmental impacts (Davidson, Phalen, and Solomon Citation2005; Shrestha, Traina, and Swanston 2010; Dilger et al. Citation2016; Pope et al. Citation2016). For example, inhalation of aerosolized ultrafine particles and increased exposure time to polluted air can lead to respiratory issues like asthma and decreased lung function with increased risks of irregular heartbeat leading to eventual heart attacks (US EPA Citation2019b). Particulate emission in the form of soot also contributes to atmospheric warming, melting snowfields, and cloud formation (PR Newswire Citation2016; Anand Citation2017; Shrestha, Traina, and Swanston 2010). Polluted air affects our environment by contributing to acid rain, disrupting the Earth’s radiative balance by altering its surface albedo and causing haze that impairs visibility (Earth System Science Education Alliance (ESSEA) Citation2017; US EPA Citation2019b).
Management and regulation of air pollution through the development of effective mitigation strategies require accurate air quality data (US EPA Citation2018b, Citation2019a). Regulating emissions from a source requires an understanding of the identity of the source and its contribution. Receptor models, for instance, are used for source apportionment studies. These are informed by data made available from experimental investigation of soot samples (Johnson, Kittelson, and Watts 2005; Aeroqual Citation2018; US EPA Citation2018a, Citation2018c) while diagnostic techniques such as laser-induced incandescence can be used to determine soot (black carbon) concentration emitted by a point source (Hays and Vander Wal 2007; Shapiro et al. Citation2012).
Combustion-produced soot varies in its aggregate morphology, primary particle size, chemistry, and nanostructure due to differences in fuel and combustion conditions of temperature, pressure, equivalence ratio, and fuel (Knauer et al. Citation2009; Ess et al. Citation2016; Huang and Vander Wal Citation2016; Jaramillo et al. Citation2015; Liati et al. Citation2016), making source identification a non-trivial task. One approach is to use “tracers” or “markers,” i.e., hetero-elements adsorbed on or embedded in the carbonaceous soot matrix. These include inorganics from lube oils (Wei et al. Citation2014), metals from engine wear (Cass Citation1998; Illi et al. Citation2017), sulfur from petroleum fuels (Boehman, Song, and Alam Citation2005), or oxygen from oxygen-rich fuels (Vander Wal and Mueller 2006). However, the presence of atypical tracers, specific to particular sources, for accurate fingerprinting is becoming increasingly challenging given the move to cleaner and more efficient burning fuels with lesser amounts of tracer compounds. Other elemental markers such as Pb for gasoline, Ni and V from fuel oil, and Al and Si from road dust are limited in their applicability for their generic occurrence (Cass Citation1998). Moreover, “fingerprinting” relies on the tracers’ being unreactive to environmental exposure as well as on their minimal variation with transport and aging (Cass Citation1998; Viana et al. Citation2008; Kim et al. Citation2009). One of the challenges in a similar experimental investigation of soot samples collected from different sources is obtaining sufficient sample quantities for characterization. Most analytical techniques require at least a few milligrams of the sample for reliable measurements, and such quantities of real soot are often unavailable, particularly with receptor-site based sampling.
Transmission electron microscopy (TEM) is an analytical technique that can provide meaningful information with nanograms of a soot sample. Imaging in a transmission electron microscope requires a <100 nm thick layer of the material which can often be collected directly on a TEM grid or can be scraped off of a filter paper on which soot was during sampling. TEM instruments may be equipped with energy dispersive x-ray spectroscopy (EDXS or EDS) detectors for elemental analysis of the material. X-ray photoelectron spectroscopy (XPS) can also be used for compositional and functional group analysis of small quantities of soot. This combination of TEM, EDS, and XPS can, thus, prove to be very informative in a situation where limitations on sample availability are one of the prime reasons that restrict material analysis.
Apart from elemental markers, nanostructure (Hurt, Crawford, and Shim Citation2000; Vander Wal Citation2005) has been shown to vary as a function of fuel chemistry, temperature, and engine power (Gülder Citation1995; Strzelec et al. Citation2010; Vander Wal, Bryg, and Hays 2011). Nanostructure is also sensitive to heteroatom content, aromatic ring arrangements (odd/even membered rings) (Vander Wal et al. Citation2013), and carbon hybridization (sp2/sp3) (Vander Wal et al. Citation2004) as these vary with combustion conditions. Thus, for those soots that lack such elemental markers, soot nanostructure and chemistry are potential identifiers of the soot source. Yet nanostructure is not always distinct nor sufficiently formed for accurate quantification.
High-temperature heat treatment of carbon materials has been studied for decades in order to understand carbon’s behavior and properties, which differ across all its allotropic forms (Franklin Citation1951; Walker Citation1972; Oberlin Citation1984; Walker Citation1990; Abrahamson et al. Citation2018a, Citation2018b). Detailed analyses have been performed at various stages of graphitization heat treatment using a variety of microscopic and spectroscopic techniques to infer the time-temperature-history and consequent changes in the structure of carbon materials (Warren Citation1941; Biscoe and Warren Citation1942; Franklin Citation1950; Houska and Warren Citation1954; Bacon and Warren Citation1956; Slonczewski and Weiss Citation1958; Short and Walker Citation1963; Tuinstra and Koenig Citation1970; Craievich Citation1976; Robertson and O’Reilly Citation1987). Recently, high-temperature heat treatment of carbon precursors was carried out with pulsed and continuous-wave lasers (Abrahamson Citation2017). The influence on carbon nanostructure, and in turn its micro- and macro-scale structure, of high heating rates over comparatively short timescales (microseconds) relative to traditional graphitization (hours) has been explored by Singh, Abrahamson, and Vander Wal (Citation2018). Because of the accentuation of nanostructure under high temperature, the heat treatment may be considered to “derivatize” the carbon. Can this derivatization, then, be applied to a carbonaceous material like soot to study its nanostructure evolution?
While small (nanogram) quantities typically collected on TEM grids or filter paper cannot practically be graphitized in a traditional furnace, these can be laser heated directly on TEM grids with a pulsed laser to alter their nanostructure and potentially distinguish two soot samples generated under different combustion conditions. A recent successful but preliminary demonstration of the technique on a variety of soot samples has pointed to nascent soot nanostructure as the likely cause for divergent nanostructures upon annealing (Singh, Gaddam et al. Citation2018). Current literature lacks systematic tests that can point to a potential correlation or causation for this observed divergence in the annealed nanostructure. The absence of such studies is attributed to the lack of availability of a systematically generated set of authentic soot samples from sources, owing to practical experimental challenges, and the newness of this application of laser annealing as presented here. This work aims to address this knowledge gap with real soot samples, compositionally analyzed by EDS and XPS, laser annealed with a pulsed laser and characterized using TEM for nanostructure analysis. Fuel composition is shown to influence nascent soot nanostructure, with oxygen, in particular, playing a significant role in dictating nanostructure evolution upon laser treatment.
2. Materials and experimental methodology
2.1. Materials
Authentic soot samples generated under varying fuel conditions were compared as obtained and after derivatization using laser-based heating. This study used soot samples from two broad categories of sources: (a) an engine source, specifically a diesel engine, and (b) two biomass-fueled sources burning wood-based fuels, i.e., a wood-boiler and a cookstove.
A 1999 1.7 L Mercedes Benz direct-injection common rail diesel engine was operated at a single speed-load point of 1500 rpm and 2.6 bar, generating gram quantities of soot. The engine specifications and detailed description of the system are given elsewhere (Strzelec et al. Citation2010). This engine used ultra-low sulfur diesel (ULSD) fuel, and ULSD blended with varying proportions (5–20%) of soy methyl ester biodiesel (B100). For example, B5 is 5% biodiesel blended with ULSD. Variations used are ULSD, B5, B20, and B100, where B100 is 100% biodiesel. Given the limited quantities of soot typically available from sampling at real sources, our comparative analysis first focused on diesel soot. The gram quantities obtained enabled extensive characterization and analysis. However, to also illustrate the technique on sparse soot quantities, cookstove- and wood boiler-generated soot samples were obtained directly on TEM grids. The cookstove-soot was from a Jiko Poa cookstove burning wet and dry red oak wood in a rocket-type stove that uses small-diameter wood as fuel. The cookstove consists of a vertical chimney ensuring efficient combustion before the flames reach the cooking surface. Details of the cookstove used can be found elsewhere (Jetter et al. Citation2012). The wood boiler used is manufactured by alternative fuel boilers. More details on the technology and collection procedure are provided elsewhere (Hays et al. Citation2011; Singh, Gaddam et al. Citation2018).
2.2. Laser derivatization apparatus
Nascent soot is typically obtained on a filter paper or collected directly on TEM grids. Unless the samples were acquired directly on carbon thin-film TEM grids, soot was deposited on 300 mesh C/Cu lacey TEM grids by a dry-filter paper rub before annealing. Samples were laser-heated using 10 Hz of the 1,064 nm wavelength of the Nd:YAG laser, with a fixed pulse width set to 8 ns. For annealing soot, one pulse of 150 mJ/cm2 fluence was used, and soot was heated directly on TEM grids in an inert atmosphere of nitrogen. A schematic of the apparatus is shown in .
Figure 1. A schematic of the laser heating apparatus.
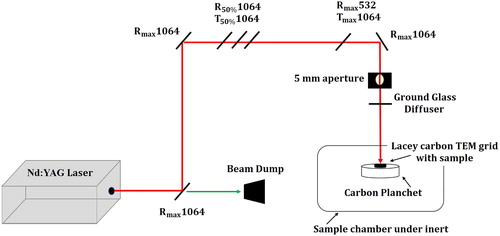
Laser fluence was determined by analyzing the changes in carbon nanostructure for multiple laser fluences ranging from 25 to 200 mJ/cm2 in a previous study (Abrahamson et al. Citation2017). The fluence used in this study was chosen to cause the sample to anneal and not ablate. At this fluence, soot reaches a temperature of ∼3,000 °C.
2.3. Nanostructure and compositional analysis
For nanostructure quantification, high-resolution TEM images were obtained using the FEI Talos F200X S/TEM instrument. Bright-field imaging was used here at magnifications of 390, 500, or 650 kx. Before collecting any images, the TEM grid was first surveyed to ensure that nanostructure and morphology of the material being imaged was uniform across the grid. From the survey, regions for imaging by TEM were selected so as to minimize interference from the lacey carbon support of the TEM grid itself and focus on the material being studied. In addition, regions where particles were highly overlapped or clustered were generally avoided. In such a situation, imaging is dominated by mass-thickness contrast, and therefore, details of particle nanostructure or aggregate morphology cannot be observed. Finally, images were taken from >10 regions per TEM grid. Imaging in a similar fashion from a second TEM grid was also done to ensure consistency of inferences and conclusions drawn from TEM micrographs. In-house image quantification algorithms were used to assess soot nanostructure for its fringe length and curvature (Yehliu, Vander Wal, and Boehman Citation2011).
For compositional analysis, EDS was performed in STEM mode using the Super X-EDS system in the FEI Talos F200X. The FEI Talos 200FX uses the ESPIRIT software which includes a background model subtraction, peak deconvolution based on known ratios, and relies on the Cliff-Lorimer method. Also taken into account are detector geometry factors and accelerating voltage. The quantification results usually include a 3-sigma error number, which is also dependent on which peak is chosen for the quantification. These methods are well known, accepted, and validated by the manufacturer within the stated uncertainty. Uncertainty estimate reported here is a 1-sigma standard deviation. This is based on the expected uncertainty in the identification of pixels as being those of one element vs. another when quantifying EDS data.
XPS experiments were performed using a Physical Electronics VersaProbe II instrument equipped with a monochromatic Al Kα x-ray source (hν = 1.4867 keV) and a concentric hemispherical analyzer. Quantitative analysis of XPS data has been done for the C1s spectra at 289 eV as well as with the corresponding O1s spectra at 532 eV. O1s spectra have not been shown here but were present in the analysis and results reported. Instead, comparative C1s spectra are shown to visually demonstrate the change in the spectra for the four soots analyzed.
3. Results and discussion
Laser derivatization and related data analysis are briefly illustrated using cookstove soot. This is followed by a detailed analysis of the differences observed in diesel engine generated soot after laser derivatization, owing to differences in fuel chemistry. Oxygen content and its evolution upon laser heat treatment play a significant role in dictating soot nanostructure evolution, and nascent soot chemistry is, therefore, a key factor in determining final soot nanostructure. An independent check was performed using functionalized carbon black. Inferences for soot nanostructure evolution were drawn using observations from similar laser annealing studies on functionalized carbon black.
Examples of biomass-fueled sources were chosen to demonstrate the reciprocal case where likeness in nascent and laser annealed soot nanostructure was observed, owing to similar fuel composition. Understanding factors that would result in similar or differentiated soot nanostructure is essential to being able to use laser derivatization towards potential identification of the source of soot.
3.1. Illustrating laser derivatization and nanostructure quantification
Laser derivatization was demonstrated to accentuate nanostructure statistics between soots of varying origin. As an illustration, shows TEM images of nascent and laser annealed soot nanostructure for soot generated by a cookstove burning wet red oak wood. shows corresponding graphs of fringe length and tortuosity statistics quantified from their TEM images.
Figure 2. TEM micrographs of cookstove generated soot burning wet red oakwood showing (a, b) nascent and (c, d) laser annealed soot nanostructure.
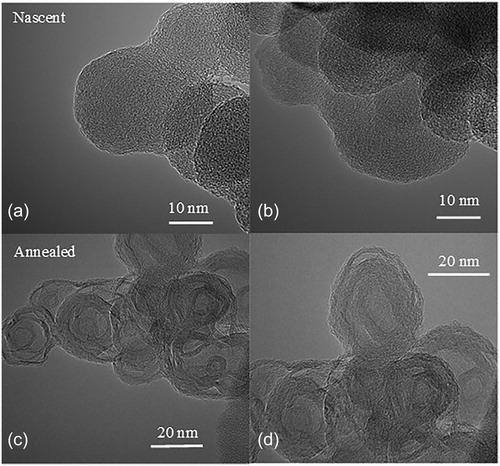
Figure 3. Length and tortuosity statistics of nascent and laser annealed cookstove generated soot.
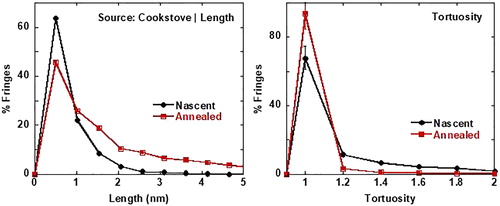
shows a greater percentage of longer and straighter (tortuosity = 1) fringes for annealed soot than for nascent soot. While laser annealing will likely result in longer and straighter fringes, this rearrangement in soot nanostructure at high temperatures (>3,000 °C) is not uniformly true and greatly depends upon the soot’s chemistry before laser annealing, as subsequently demonstrated.
3.2. Differentiating soot nanostructure within a source
Soot generated from widely varying sources show significant visual differences in their nascent nanostructure. However, such obvious differences in nascent nanostructure may not be evident in soot generated by similar engine combustion parameters. For instance, the same engine may be operated with different fuels, all other parameters (e.g., load, timing, injection pressure) being consistent. Soot generated in such cases may be expected to have similar nascent nanostructure.
Laser derivatization of soot to test its nanostructure evolution on laser heat treatment is described in this section for soot generated using different fuels. ULSD and its blends with biodiesel were used as fuel in a Mercedes Bens direct injection diesel engine. Soot generated by the engine operating with the different fuel blends imaged before and after laser annealing is shown in .
Figure 4. TEM images showing (Top row: a, c, e, g) nascent and (Bottom row: b, d, f, h) annealed nanostructure of ULSD, B5, B20, and B100 as indicated.
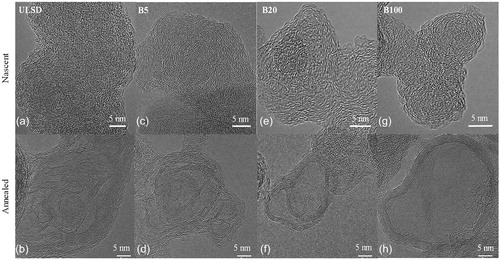
shows the evolution of nanostructure upon annealing for soot generated when the engine operates with ULSD (referred to as ULSD-soot), B5 (referred to as B5-soot), B20 (referred to as B20-soot), and B100 (referred to as B100-soot). ULSD- and B5-soot show ribbon-like particle interiors with the lamellae arranged somewhat concentrically to its peripheral “graphitic” band. More biodiesel blended with ULSD results in B20- and B100-soot that exhibit a hollow-shell-like nanostructure upon laser annealing, with an outer banded perimeter and a hollow core, indicated by the mass-thickness contrast of the images in .
The similarity in the nascent nanostructure of ULSD-, B5-, B20-, and B100-soot is shown by images a, c, e, and g, respectively, and quantified by fringe analysis in .
Figure 5. Fringe length and tortuosity statistics for nascent ULSD-, B5-, B20-, and B100-soot.
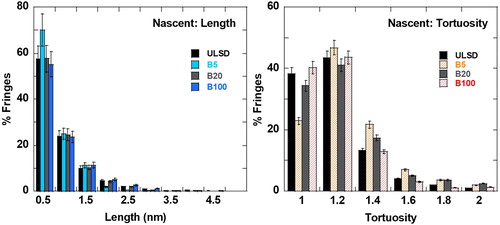
shows the similarity in fringe length and tortuosity statistics for the four soot types, within error bars, also visible from their respective TEM micrographs in . Nevertheless, laser derivatization of these four soot samples, with seeming similarity in their nascent nanostructure, results in disparate annealed nanostructures. Fuel chemistry systematically varies for these soot samples with the proportion of biofuel blended with ULSD. The resultant variation in the chemistry of the combustion-produced soot is proposed as the cause for this divergence in the nanostructure of these soot samples upon laser heating. The role of the elemental composition of soot, specifically oxygen content, is confirmed by compositional analysis of the nascent soot by EDS for volumetric analysis and by XPS for surface analysis. shows an overlay of carbon (blue pixels) and oxygen (red pixels) obtained using spatial elemental mapping by EDS. For each soot sample, EDS was performed on ∼10 regions. Quantified results are averaged and presented in in atomic percentages (at. %). EDS and XPS measure relative quantities, and therefore the carbon % is calculated by subtracting the oxygen % from the total 100%, assuming only carbon and oxygen are present. Significant quantities (>0.5 at. %) of other elements were not observed.
Figure 6. EDS maps showing relative carbon and oxygen content for ULSD, B5, B20, and B100.
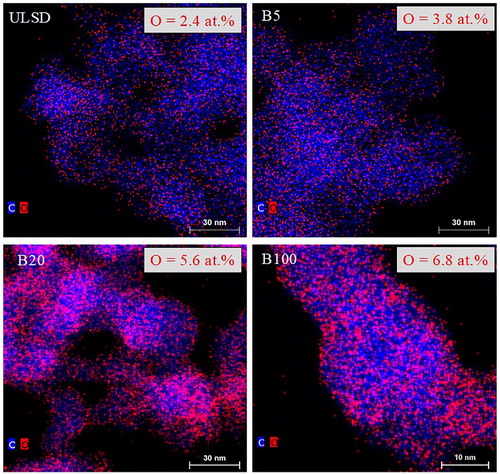
Table 1. Elemental C and O quantified by EDS.
Nascent soot generated by the engine operating with the four fuel blends showed an increase in the oxygen content as the proportion of biofuel blended with ULSD increased. The oxygen content in ULSD- and B100-soot has also been reported elsewhere (Strzelec et al. Citation2010) with B100-soot having a higher at. % of oxygen, confirmed here by EDS in . As a secondary check, XPS was used to infer the surface composition of the four soot samples. C1s XPS spectra for the four soot samples, overlaid for comparison, are presented in . Each C1s spectrum has been individually curve-fitted for C and O quantification. The individual curve fits follow in . Not having any “standard” soot sample, nascent carbon black (R250) without any oxygen was used as a baseline reference for the curve fits.
Figure 7. XPS C1s spectra of ULSD-, B5-, B20-, and B100-soot.
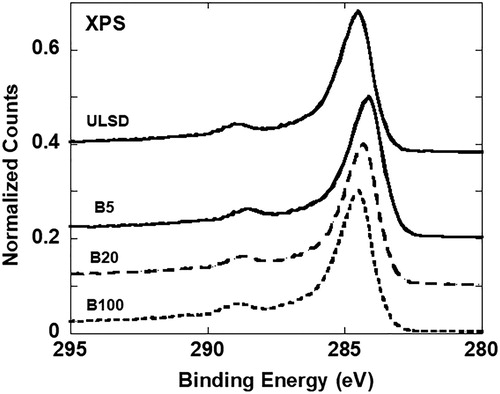
Figure 8. XPS curve fits to the C1s spectra of ULSD-, B5-, B20-, and B100-soot.
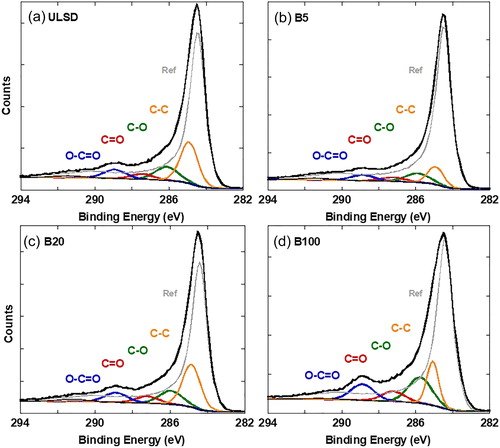
shows curve fits to the C1s spectra for all four soot samples. Peak broadening relative to the reference material (Ref, R250, Cabot Corp.) and the prominent bump at ∼289 eV indicate the presence of oxygen with the likely functional groups observed at increasing binding energy shown by their respective curve fits. A significant presence of O–C = O groups was observed in B100-soot, relative to ULSD- or B5-soot. Quantified using the area under the curve, at. % of carbon and oxygen were measured (based on counts) and the at. % oxygen calculated after curve is tabulated for comparison in . Calculated values are from curve fits after accounting for the number of oxygen atoms bonded to carbon in O–C = O, C = O, and C–O groups. The last column of is the deviation of calculated oxygen from measured values. This quantity is the difference in the two values as a percent of the measured oxygen.
Table 2. Quantified at. % of C and O using XPS.
Measured and calculated at. % oxygen increased as the proportion of biodiesel blended with ULSD increased, a trend similar to that observed by EDS. The agreement between measured and calculated oxygen at. % improved as the amount of oxygen detected increased, and the best agreement in values was for B100-soot. Although ULSD shows higher oxygen at. % relative to B5, the large deviation between measured and calculated oxygen likely means ULSD has a similar oxygen content as B5, supported by the similarity in the evolved nanostructures upon laser heating. Sampling depth accounts for the differences between EDS and XPS values. The XPS signal detected is from the top ∼2 nm of the soot surface. In contrast, given the <100 nm sample thickness for TEM, EDS in STEM mode provides a volumetric measure of the oxygen in individual particles and aggregates with the added advantage of being able to create a spatial elemental map. Quantifiable amounts of other elements were not observed in the XPS or EDS of the functionalized material, and thus the effect of laser heating has been attributed to oxygen, the only element other than carbon that can influence its nanostructure.
3.2.1. Validation of oxygen content driving nanostructure development under high-temperature heat treatment
The compositional evaluation of diesel-engine generated soot supports the postulate that the increase in elemental oxygen causes the observed divergence in nanostructure evolution from ribbon-like carbon lamellae arrangements (observed for ULSD- and B5-soot) to hollow shells (exhibited by B20- and B100-soot). As a test of this claim, functionalized carbon black was used as reference material with its chemistry modified to mimic that of biodiesel soot. Subsequently, laser annealing was performed on these chemical analogs: 6- and 48-h nitric acid (HNO3) functionalized carbon black (R250), referred to as HNO3-R250, with 13 at. % and 26 at. % XPS-reported oxygen, respectively. These samples were also laser-heated with one pulse of 150 mJ/cm2 fluence of the Nd:YAG laser (10 Hz, 1,064 nm) under an inert. shows TEM micrographs of HNO3-R250 after laser annealing.
Figure 9. TEM micrographs of (a, b) 6- and (c, d) 48-hour HNO3 treated R250 after laser annealing with one pulse of the Nd:YAG operating with a fluence of 150 mJ/cm2 at the different indicated magnifications.
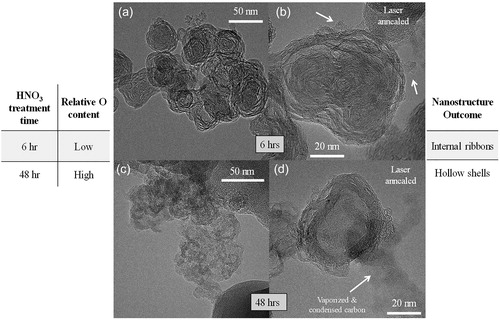
A similar divergence in nanostructural evolution, i.e., concentric/ribbon-like arrangement of lamellae vs. hollow shells, is also observed after HNO3-R250 is subjected to laser heat treatment in a similar manner as biodiesel soot. The 6-h HNO3-treatment results in a lower oxygen content (∼13 at.% by XPS), and this material correspondingly shows a ribbon-like, somewhat concentric carbon lamellae arrangement after laser heat treatment () as compared to the hollow shells observed with the 48-h HNO3-treatment () where the starting material contains significantly more oxygen (∼26 at.% by XPS).
Thus, the nanostructure evolution of functionalized carbon black with low and high oxygen is similar to that observed in biodiesel soot, compared in . It tracks with oxygen content of the material, i.e., a low oxygen content (<15 at. % by XPS and <5 at. % by EDS) results in a ribbon-like internal particle nanostructure upon laser annealing while a comparatively high oxygen content (>15 at. % by XPS and >5 at. % by EDS) results in a hollow, shell-like particle nanostructure when laser-heated.
Table 3. Oxygen content comparison for biodiesel soot and functionalized carbon black.
3.2.2. Discussion on the effect of oxygen on nanostructure evolution of carbon upon laser annealing
When an oxygenated carbon such as B100-soot or the 48-h HNO3-treated R250 is subjected to one pulse of the Nd:YAG laser, the sample reaches a temperature >3,000 °C in <10 nanoseconds and cools down to ambient over the next few thousand microseconds. High-temperature heat treatment simultaneously activates all energies required for vaporization, lamellae de-wrinkling, lamellae mobilization, and rearrangement. Some carbon fragments from the particle’s interior are likely lost to gasification in the presence of available oxygen escaping as CO and CO2. The arrows in show evidence of vaporized and condensed carbon, also observed elsewhere (Abrahamson et al. Citation2017). High oxygen content leads to the extensive breakup of lamellae as gasification occurs. The smaller fragments coupled with high mobility at the elevated temperatures results in (internal) templating against the peripherical shell. The more resistant basal plane carbon along the particle’s perimeter keeps the particle intact and provides a template for the lamellae to orient peripherally, giving it a banded appearance.
On the other hand, when the available oxygen content is low, such as in B5-soot or the 6-h HNO3-treated R250, relatively less carbon is lost to gasification leaving behind more of it in the particle’s interior. Lower oxygen content results in a lesser degree of lamellae breakup, and these larger (longer) fragments are geometrically constrained, leading to the development of internal ribbons and compartments.
In both cases, the carbon mass lost by gasification facilitates lamellae reconfiguration into stable structures given morphological confinement. Gasification also contributes to the observed differences in the internal void volume. The relative contributions of the two processes are not resolved here, only their net contributions.
3.3. Similarity in soot nanostructure between sources
Nanostructure evolution upon laser annealing follows divergent pathways, and its evolution appears to be dictated by its initial nanostructure, influenced by fuel chemistry. Fuel chemistry differences manifest themselves in nascent soot nanostructure enhanced by laser derivatization. Reciprocally, the similarity in fuel chemistry is observed to result in similar nascent soot nanostructure, maintaining nanostructural similarity after laser derivatization. Although generated by different sources, the following examples of soot from a cookstove and a wood boiler illustrate the resemblance in nascent soot nanostructure. These also evolve similarly upon laser heating, seen visually by TEM and quantified by fringe analysis while EDS and XPS quantify the oxygen content.
3.3.1. Wood-fired boiler vs. cookstove generated soot
Soot is generated by and sampled from a wood-fired boiler burning pine wood and a residential cookstove burning oak wood. Both sources are biomass-fueled, and the soot generated by these sources shows similar nanostructure upon laser heating ().
Figure 10. TEM images showing (a, c) nascent and (b, d) annealed nanostructure of soot generated by a (top row) wood-fired boiler burning pine wood and (bottom row) cookstove burning oak wood.
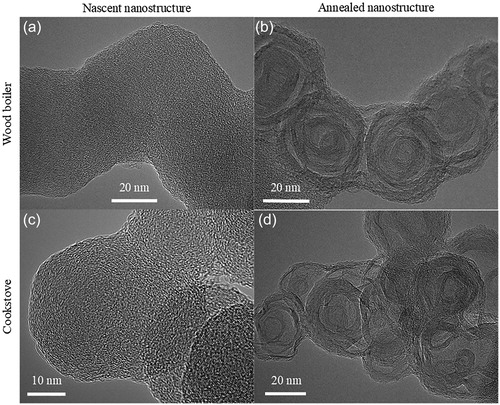
Quantified fringe statistics confirm the visual similarity in nanostructure. Difference plots in show similar degrees of change of the annealed soot relative to the nascent material. Longer and straighter fringes are observed for both soot types, arranged somewhat concentric to the particle perimeter, as observed by their respective TEM images.
Figure 11. Fringe statistics showing similarity in the degree of change observed after laser heating soot from a wood boiler and a cookstove.
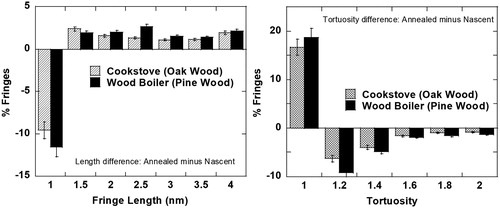
This similarity in nanostructure can be attributed to the observed equivalent oxygen content of the nascent soot, quantified by EDS and XPS in . Being wood-based, both have comparable oxygen present due to their high cellulose and hemicellulose content.
Table 4. C and O quantification for wood-fired boiler and cookstove soot by EDS and XPS.
Given the lack of availability of sufficient quantities of soot sampled from these two sources, comparative chemical analysis was limited. However, the similarity in qualitative TEM micrographs, quantified EDS, and XPS data indicates commonality in the formation conditions of the soot. Thus, similar nanostructures after laser heating may also be observed, and it is important to identify and study such outcomes and reasons for the observed similarity.
4. Summary
The premise of source identification using laser derivatization is that soot formation conditions differ by fuel, pressure, temperature, timescale, and species across combustion sources. This blend of formation conditions leads to different chemical composition (C/H, heteroatoms) and other structural variations, including cross-links, defects, etc., in the soot. The effects of the lattice defects and crystallite organization become magnified during rapid annealing under the action of pulsed laser heating. Our goal is to illustrate improved nanostructure recognition brought about by laser annealing to differentiate soots formed under different operational conditions yet originating from the same source. Nanostructure evolution on laser heating has been shown to depend upon the oxygen content present in the fuel used, subsequently influencing nascent soot chemistry and thereby its annealed nanostructure. Specifically, higher oxygen content in nascent soot results in the formation of hollow shell-like particles upon laser annealing while a lower oxygen content shows nanostructure evolution in the form of ribbon-like lamellae in the particle’s interior within a graphitic or banded perimeter. At annealing temperatures of 2,000 °C and beyond, all oxygen will be dissociated from the carbon sp2 framework, creating radical sites, and for this reason only the relative amount of oxygen content, rather than specific chemical form, is relevant to the annealed carbon nanostructure. Reciprocally, soot from different sources burning fuels comparable in their chemistry may result in nanostructure similarity after laser annealing, as demonstrated by the wood- and oil-fueled sources. The role of fuel chemistry and its influence on soot nanostructure is significant, observed by evaluating the nanostructure of soot generated by the use of like fuels in unlike sources or the use of varying fuel blends in the same source.
Given the number of variables involved and the complexity of the soot formation process, soot differentiation based on nanostructure can be meaningful when assessed and documented one receptor site at a time in order to unambiguously identify sources contributing to a receptor site. Developing a database of known soot samples and identifying unknown soot samples based on a database match of soots analyzed similarly could ultimately help tackle more complicated differentiations, i.e., across receptor sites, sources, and conditions. Source identification would, in turn, help develop mitigation strategies towards controlling soot emissions while also informing source models for better predictive modeling.
Acknowledgments
Carbon black was provided by Cabot Corp. Biodiesel soot samples were provided by Dr. Andrea Strzelec (U. Wisconsin-Madison, College of Engineering), generated at the National Transportation Research Center c/o Oakridge National Labs, while soots from biomass sources were provided by Dr. Michael D. Hays, c/o The U.S. EPA, National Risk Management Research Laboratory. Material characterizations were performed using the facilities of the Materials Research Institute at the Pennsylvania State University.
Additional information
Funding
References
- Abrahamson, J. P. 2017. Pulsed laser annealing of carbon. PhD Thesis. The Pennsylvania State University. doi:10.1016/j.carbon.2017.08.080.
- Abrahamson, J. P., A. Jain, A. van Duin, and R. L. Vander Wal. 2018a. Carbon structure and resulting graphitizability upon oxygen evolution. Carbon 135:171–9. doi:10.1016/j.carbon.2018.04.055.
- Abrahamson, J. P., A. Jain, A. van Duin, and R. L. Vander Wal. 2018b. Trajectories of graphitizable anthracene coke and non-graphitizable sucrose char during the earliest stages of annealing by rapid CO2 laser heating. C 4 (2):36. https://doi.org/10.3390/c4020036.
- Abrahamson, J. P., M. Singh, J. P. Mathews, and R. L. Vander Wal. 2017. Pulsed laser annealing of carbon black. Carbon 124 (14):380–90. doi:10.1016/j.carbon.2017.08.080.
- Aeroqual. 2018. Air pollution modelling: What it is and what can it tell us? https://www.aeroqual.com/air-pollution-modelling.
- Anand, G. 2017. India’s air pollution now rivals China’s as deadliest in the world. New York Times, February 14, Late Editi edition. http://ezaccess.libraries.psu.edu/login?url=https://search.proquest.com/docview/1867807344?accountid=13158.
- Bacon, G. E., and B. E. Warren. 1956. X-ray diffraction studies of neutron-irradiated graphite. Acta Crystallogr. 9 (12):1029–35. doi:10.1107/S0365110X56002989.
- Biscoe, J., and B. E. Warren. 1942. An x‐ray study of carbon black. J. Appl. Phys. 13 (6):364–71. doi:10.1063/1.1714879.
- Boehman, A. L., J. Song, and M. Alam. 2005. Impact of biodiesel blending on diesel soot and the regeneration of particulate filters. Energy Fuels 19 (5):1857–64. doi:10.1021/ef0500585.
- Cass, G. R. 1998. Organic molecular tracers for particulate air pollution sources. Trends Anal. Chem. 17 (6):356–66. doi:10.1016/S0165-9936(98)00040-5.
- Craievich, A. F. 1976. On the structure of glassy carbon. Mater. Res. Bull. 11 (10):1249–55. doi:10.1016/0025-5408(76)90029-5.
- Davidson, C. I., R. F. Phalen, and P. A. Solomon. 2005. Airborne particulate matter and human health: A review. Aerosol Sci. Technol. 39 (8):737–49. doi:10.1080/02786820500191348.
- Dilger, M., J. Orasche, R. Zimmermann, H.-R. Paur, S. Diabaté, and C. Weiss. 2016. Toxicity of wood smoke particles in human A549 lung epithelial cells: The role of PAHs, soot and zinc. Arch. Toxicol. 90 (12):3029–44. doi:10.1007/s00204-016-1659-1.
- Earth System Science Education Alliance (ESSEA). 2017. Global climate change: Albedo. https://esseacourses.strategies.org/module.php?module_id=99.
- Ess, M. N., H. Bladt, W. Mühlbauer, S. I. Seher, C. Zöllner, S. Lorenz, D. Brüggemann, U. Nieken, N. P. Ivleva, and R. Niessner. 2016. Reactivity and structure of soot generated at varying biofuel content and engine operating parameters. Combust. Flame 163:157–69. doi:10.1016/j.combustflame.2015.09.016.
- Franklin, R. E. 1950. The interpretation of diffuse x-ray diagrams of carbon. Acta Crystallogr. 3 (2):107–21. doi:10.1107/S0365110X50000264.
- Franklin, R. E. 1951. The structure of graphitic carbons. Acta Crystallogr. 4 (3):253–261. https://doi.org/10.1107/S0365110X51000842.
- Gülder, Ö. L. 1995. Effects of oxygen on soot formation in methane, propane, and n-butane diffusion flames. Combust. Flame 101 (3):302–10. doi:10.1016/0010-2180(94)00217-G.
- Hays, M. D., B. Gullett, C. King, and J. Robinson. 2011. Characterization of carbonaceous aerosols emitted from outdoor wood boilers. Energy Fuels 25:5632–8. doi:10.1021/ef2012694.
- Hays, M. D., and R. L. Vander Wal. 2007. Heterogeneous soot nanostructure in atmospheric and combustion source aerosols. Energy Fuels 21 (2):801–11. doi:10.1021/ef060442h.
- Houska, C. R., and B. E. Warren. 1954. X‐ray study of the graphitization of carbon black. J. Appl. Phys. 25 (12):1503–9. doi:10.1063/1.1702373.
- Huang, C.-H., and R. L. Vander Wal. 2016. Partial premixing effects upon soot nanostructure. Combust. Flame 168:403–8. doi:10.1016/j.combustflame.2016.01.006.
- Hurt, R. H., G. P. Crawford, and H.-S. Shim. 2000. Equilibrium nanostructure of primary soot particles. Proc. Combust. Inst. 28 (2):2539–46. doi:10.1016/S0082-0784(00)80670-0.
- Illi, J. C., T. Vancetta, D. D. Alves, D. M. M. Osório, L. Bianchin, D. M. de Quevedo, and F. Juchem. 2017. Integrated assessment of air pollution by metals and source apportionment using ryegrass (Lolium multiflorum Lam.) in Southern Brazil. Environ. Sci. Pollut. Res. 24 (3):2790–803. doi:10.1007/s11356-016-8041-y.
- Jaramillo, I. C., C. K. Gaddam, R. L. Vander Wal, and J. S. Lighty. 2015. Effect of nanostructure, oxidative pressure and extent of oxidation on model carbon reactivity. Combust. Flame 162 (5):1848–56. doi:10.1016/j.combustflame.2014.12.006.
- Jetter, J., Y. Zhao, K. R. Smith, B. Khan, T. Yelverton, P. DeCarlo, and M. D. Hays. 2012. Pollutant emissions and energy efficiency under controlled conditions for household biomass cookstoves and implications for metrics useful in setting international test standards. Environ. Sci. Technol. 46:10827–34. doi:10.1021/es301693f.
- Johnson, J., D. B. Kittelson, and W. F. Watts. 2005. Source apportionment of diesel and spark ignition exhaust aerosol using on-road data from the Minneapolis Metropolitan Area. Atmos. Environ. 39(11):2111–21. doi:10.1016/j.atmosenv.2004.12.018.
- Kim, D., B. M. Kumfer, C. Anastasio, I. M. Kennedy, and T. M. Young. 2009. Environmental aging of polycyclic aromatic hydrocarbons on soot and its effect on source identification. Chemosphere 76 (8):1075–81. doi:10.1016/j.chemosphere.2009.04.031.
- Kinsey, J., D. Williams, Y. Dong, and R. Logan. 2007. Characterization of fine particle and gaseous emissions during school bus idling. Environ. Sci. Technol. 41 (14):4972–9. doi:10.1021/es0625024.
- Knauer, M., M. E. Schuster, D. Su, R. Schlögl, R. Niessner, and N. P. Ivleva. 2009. Soot structure and reactivity analysis by Raman microspectroscopy, temperature-programmed oxidation, and high-resolution transmission electron microscopy. J. Phys. Chem. A 113 (50):13871–80. doi:10.1021/jp905639d.
- Liati, A., D. Schreiber, P. Dimopoulos Eggenschwiler, Y. Arroyo Rojas Dasilva, and A. C. Spiteri. 2016. Electron microscopic characterization of soot particulate matter emitted by modern direct injection gasoline engines. Combust. Flame 166:307–15. doi:10.1016/j.combustflame.2016.01.031.
- Muleski, G. E., C. Cowherd, and J. Kinsey. 2005. Particulate emissions from construction activities. J. Air Waste Manage. Assoc. 55 (6):772–83. doi:10.1080/10473289.2005.10464669.
- Oberlin, A. 1984. Carbonization and graphitization. Carbon 22 (6):521–41. doi:10.1016/0008-6223(84)90086-1.
- Pope, C. A., A. Bhatnagar, J. P. McCracken, W. Abplanalp, D. J. Conklin, and T. O’Toole. 2016. Exposure to fine particulate air pollution is associated with endothelial injury and systemic inflammation. Circ. Res. 119 (11):1204–14. http://circres.ahajournals.org/content/early/2016/10/19/CIRCRESAHA.116.309279.abstract. doi:10.1161/CIRCRESAHA.116.309279.
- PR Newswire. 2016. Three million people dying yearly due to outdoor air pollution, says WHO. May 25. http://ezaccess.libraries.psu.edu/login?url=https://search.proquest.com/docview/1790910674?accountid=13158.
- Robertson, J., and E. P. O’Reilly. 1987. Electronic and atomic structure of amorphous carbon. Phys. Rev. B 35 (6):2946–57. doi:10.1103/PhysRevB.35.2946.
- Shapiro, M., P. Vainshtein, D. Dutcher, M. Emery, M. Stolzenburg, D. B. Kittelson, and P. H. McMurry. 2012. Characterization of agglomerates by simultaneous measurement of mobility, vacuum aerodynamic diameter and mass. J. Aerosol Sci. 44:24–45. doi:10.1016/j.jaerosci.2011.08.004.
- Short, M. A., and P. L. Walker. 1963. Measurement of interlayer spacings and crystal sizes in turbostratic carbons. Carbon 1 (1):3–9. doi:10.1016/0008-6223(63)90003-4.
- Shrestha, G., S. J. Traina, and C. W. Swanston. 2010. Black carbon’s properties and role in the environment: A comprehensive review. Sustainability 2 (1):294–320. doi:10.3390/su2010294.
- Singh, M., J. P. Abrahamson, and R. L. Vander Wal. 2018. Informing TiRe-LII assumptions for soot nanostructure and optical properties for estimation of soot primary particle diameter. Appl. Phys. B 124 (7):124–130. doi:10.1007/s00340-018-6994-x.
- Singh, M., C. K. Gaddam, J. P. Abrahamson, and R. L. Vander Wal. 2018. Soot differentiation by laser derivatization. Aerosol Sci. Technol. 53 (2):207–29. doi:10.1080/02786826.2018.1554243.
- Slonczewski, J. C., and P. R. Weiss. 1958. Band structure of graphite. Phys. Rev. 109 (2):272–9. doi:10.1103/PhysRev.109.272.
- Strzelec, A., T. Toops, S. Daw, D. Foster, and C. Rutland. 2010. ULSD and biodiesel particulate oxidation model: Combined effects of volatiles and fixed carbon combustion. SAE 2010 Powertrains Fuels & Lubricants Meeting, Oak Ridge National Lab. (ORNL), Oak Ridge, TN, October 25. https://doi.org/10.4271/2010-01-2127.
- The Interprofessional Technical Centre for Studies on Air Pollution (CITEPA). 2017. Particulate matter classification. https://www.citepa.org/en/air-and-climate/pollutants-and-ghg/particulate-matter.
- Tuinstra, F., and J. L. Koenig. 1970. Raman spectrum of graphite. J. Chem. Phys. 53 (3):1126–30. doi:10.1063/1.1674108.
- US EPA. 2018a. Managing air quality—Air quality modeling. https://www.epa.gov/air-quality-management-process/managing-air-quality-air-quality-modeling.
- US EPA. 2018b. Particulate matter (PM) basics. https://www.epa.gov/pm-pollution/particulate-matter-pm-basics#PM.
- US EPA. 2018c. Support centre for regulatory atmospheric modeling (SCRAM). https://www.epa.gov/scram/modeling-applications-and-tools.
- US EPA. 2019a. Air monitoring, measuring and emissions research. https://www.epa.gov/air-research/air-monitoring-measuring-and-emissions-research.
- US EPA. 2019b. Health and environmental effects of particulate matter (PM). https://www.epa.gov/pm-pollution/health-and-environmental-effects-particulate-matter-pm.
- Vander Wal, R. L. 2005. Soot nanostructure: Definition, quantification and implications. SAE Technical Paper Series 10, April 11. https://doi.org/10.4271/2005-01-0964.
- Vander Wal, R. L., V. M. Bryg, and M. D. Hays. 2011. XPS analysis of combustion aerosols for chemical composition, surface chemistry, and carbon chemical state. Anal. Chem. 83:1924–30. doi:10.1021/ac102365s.
- Vander Wal, R. L., and C. J. Mueller. 2006. Initial investigation of effects of fuel oxygenation on nanostructure of soot from a direct-injection diesel engine. Energy Fuels 20 (6):2364–9. https://doi.org/10.1021/ef060201+.
- Vander Wal, R. L., A. Strzelec, T. J. Toops, C. Stuart Daw, and C. L. Genzale. 2013. Forensics of soot: C5-related nanostructure as a diagnostic of in-cylinder chemistry. Fuel 113:522–6. doi:10.1016/j.fuel.2013.05.104.
- Vander Wal, R. L., A. J. Tomasek, M. I. Pamphlet, C. D. Taylor, and W. K. Thompson. 2004. Analysis of HRTEM images for carbon nanostructure quantification. J. Nanoparticle Res. 6 (6):555–68. doi:10.1007/s11051-004-3724-6.
- Viana, M., T. A. J. Kuhlbusch, X. Querol, A. Alastuey, R. M. Harrison, P. K. Hopke, W. Winiwarter, M. Vallius, S. Szidat, A. S. H. Prévôt, et al. 2008. Source apportionment of particulate matter in Europe: A review of methods and results. J. Aerosol Sci. 39 (10):827–49. doi:10.1016/j.jaerosci.2008.05.007.
- Walker, P. L. 1972. Carbon-an old but new material. Carbon 10 (3):355. doi:10.1016/0008-6223(72)90522-2.
- Walker, P. L. 1990. Carbon: An old but new material revisited. Carbon 28 (2–3):261–79. doi:10.1016/0008-6223(90)90001-F.
- Warren, B. E. 1941. X-ray diffraction in random layer lattices. Phys. Rev. 59 (9):693–8. doi:10.1103/PhysRev.59.693.
- Wei, Y., K. Wang, W. Wang, S. Liu, X. Chen, Y. Yang, and S. Bai. 2014. Comparison study on the emission characteristics of diesel- and dimethyl ether-originated particulate matters. Appl. Energy 130:357–69. doi:10.1016/j.apenergy.2014.05.058.
- Yehliu, K., R. L. Vander Wal, and A. L. Boehman. 2011. A comparison of soot nanostructure obtained using two high resolution transmission electron microscopy image analysis algorithms. Carbon 49 (13):4256–68. doi:10.1016/j.carbon.2011.06.003.